Petersburg, ND Map & Demographics
Petersburg Map
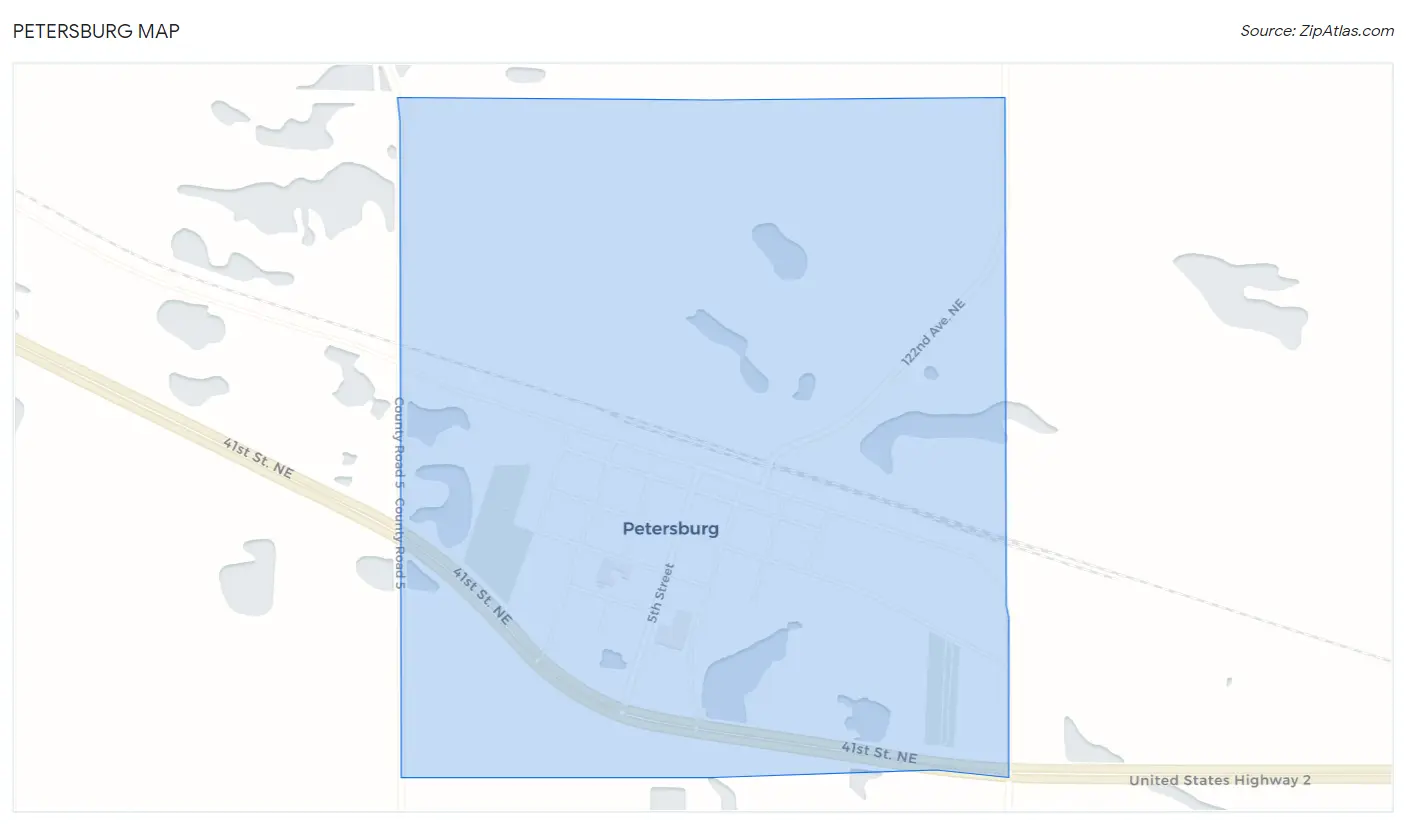
Petersburg Overview
$33,340
PER CAPITA INCOME
$88,750
AVG FAMILY INCOME
$53,750
AVG HOUSEHOLD INCOME
58.7%
WAGE / INCOME GAP [ % ]
41.3¢/ $1
WAGE / INCOME GAP [ $ ]
0.43
INEQUALITY / GINI INDEX
131
TOTAL POPULATION
59
MALE POPULATION
72
FEMALE POPULATION
81.94
MALES / 100 FEMALES
122.03
FEMALES / 100 MALES
60.3
MEDIAN AGE
3.4
AVG FAMILY SIZE
2.3
AVG HOUSEHOLD SIZE
50
LABOR FORCE [ PEOPLE ]
49.5%
PERCENT IN LABOR FORCE
Petersburg Zip Codes
Petersburg Area Codes
Income in Petersburg
Income Overview in Petersburg
Per Capita Income in Petersburg is $33,340, while median incomes of families and households are $88,750 and $53,750 respectively.
| Characteristic | Number | Measure |
| Per Capita Income | 131 | $33,340 |
| Median Family Income | 29 | $88,750 |
| Mean Family Income | 29 | $107,124 |
| Median Household Income | 58 | $53,750 |
| Mean Household Income | 58 | $70,966 |
| Income Deficit | 29 | $0 |
| Wage / Income Gap (%) | 131 | 58.70% |
| Wage / Income Gap ($) | 131 | 41.30¢ per $1 |
| Gini / Inequality Index | 131 | 0.43 |
Earnings by Sex in Petersburg
Average Earnings in Petersburg are $42,083, $57,500 for men and $23,750 for women, a difference of 58.7%.
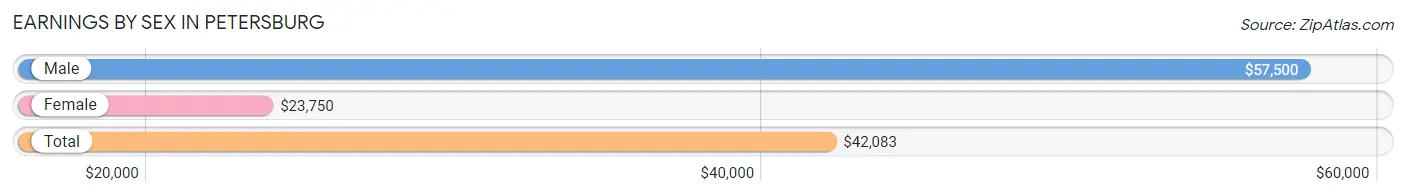
| Sex | Number | Average Earnings |
| Male | 32 (56.1%) | $57,500 |
| Female | 25 (43.9%) | $23,750 |
| Total | 57 (100.0%) | $42,083 |
Earnings by Sex by Income Bracket in Petersburg
The most common earnings brackets in Petersburg are $100,000+ for men (8 | 25.0%) and $7,500 to $9,999 for women (4 | 16.0%).
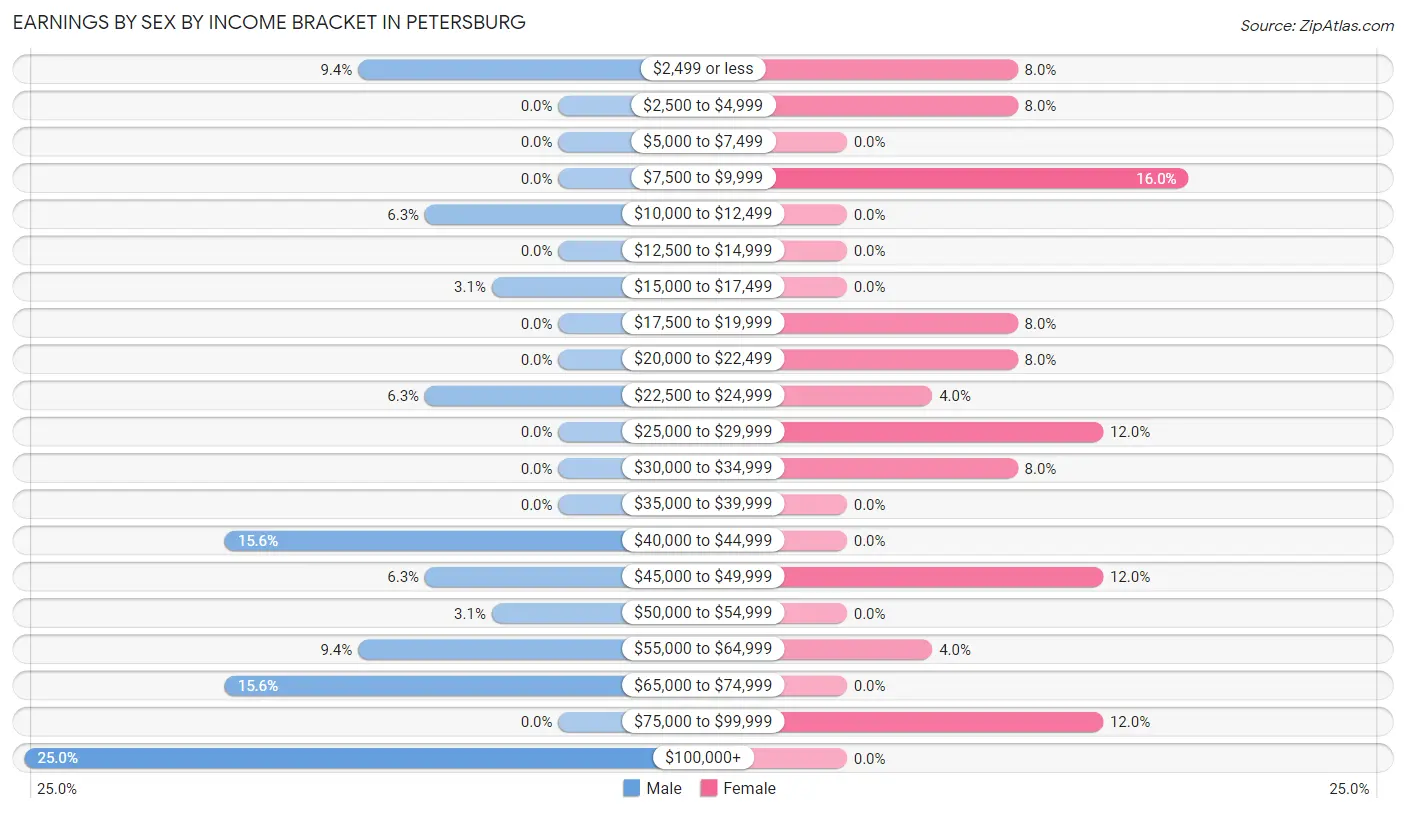
| Income | Male | Female |
| $2,499 or less | 3 (9.4%) | 2 (8.0%) |
| $2,500 to $4,999 | 0 (0.0%) | 2 (8.0%) |
| $5,000 to $7,499 | 0 (0.0%) | 0 (0.0%) |
| $7,500 to $9,999 | 0 (0.0%) | 4 (16.0%) |
| $10,000 to $12,499 | 2 (6.2%) | 0 (0.0%) |
| $12,500 to $14,999 | 0 (0.0%) | 0 (0.0%) |
| $15,000 to $17,499 | 1 (3.1%) | 0 (0.0%) |
| $17,500 to $19,999 | 0 (0.0%) | 2 (8.0%) |
| $20,000 to $22,499 | 0 (0.0%) | 2 (8.0%) |
| $22,500 to $24,999 | 2 (6.2%) | 1 (4.0%) |
| $25,000 to $29,999 | 0 (0.0%) | 3 (12.0%) |
| $30,000 to $34,999 | 0 (0.0%) | 2 (8.0%) |
| $35,000 to $39,999 | 0 (0.0%) | 0 (0.0%) |
| $40,000 to $44,999 | 5 (15.6%) | 0 (0.0%) |
| $45,000 to $49,999 | 2 (6.2%) | 3 (12.0%) |
| $50,000 to $54,999 | 1 (3.1%) | 0 (0.0%) |
| $55,000 to $64,999 | 3 (9.4%) | 1 (4.0%) |
| $65,000 to $74,999 | 5 (15.6%) | 0 (0.0%) |
| $75,000 to $99,999 | 0 (0.0%) | 3 (12.0%) |
| $100,000+ | 8 (25.0%) | 0 (0.0%) |
| Total | 32 (100.0%) | 25 (100.0%) |
Earnings by Sex by Educational Attainment in Petersburg
Average earnings in Petersburg are $60,833 for men and $25,417 for women, a difference of 58.2%. Men with an educational attainment of high school diploma enjoy the highest average annual earnings of $70,000, while those with college or associate's degree education earn the least with $53,750. Women with an educational attainment of college or associate's degree earn the most with the average annual earnings of $40,000, while those with college or associate's degree education have the smallest earnings of $40,000.
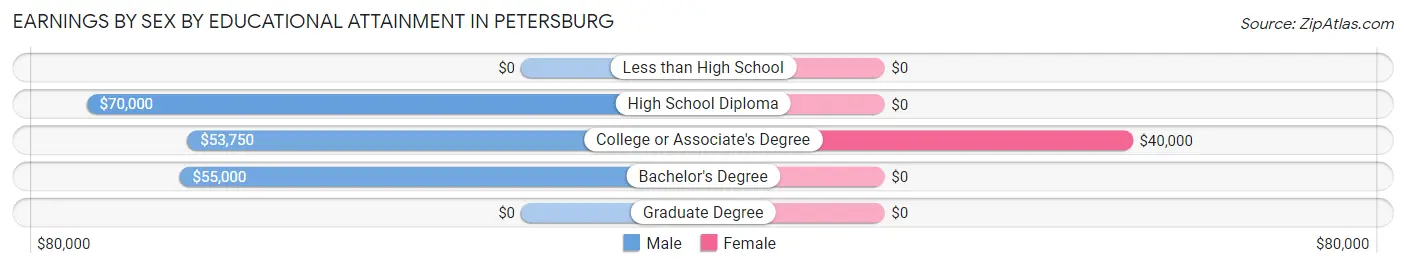
| Educational Attainment | Male Income | Female Income |
| Less than High School | - | - |
| High School Diploma | $70,000 | $0 |
| College or Associate's Degree | $53,750 | $40,000 |
| Bachelor's Degree | $55,000 | $0 |
| Graduate Degree | - | - |
| Total | $60,833 | $25,417 |
Family Income in Petersburg
Family Income Brackets in Petersburg
According to the Petersburg family income data, there are 7 families falling into the $50,000 to $74,999 income range, which is the most common income bracket and makes up 24.1% of all families.
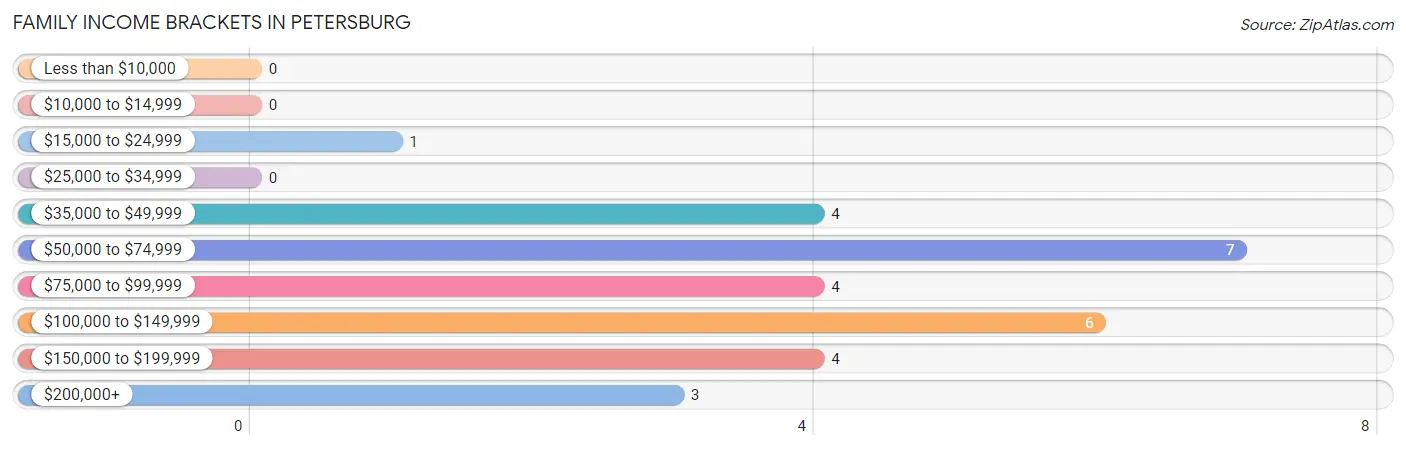
| Income Bracket | # Families | % Families |
| Less than $10,000 | 0 | 0.0% |
| $10,000 to $14,999 | 0 | 0.0% |
| $15,000 to $24,999 | 1 | 3.4% |
| $25,000 to $34,999 | 0 | 0.0% |
| $35,000 to $49,999 | 4 | 13.8% |
| $50,000 to $74,999 | 7 | 24.1% |
| $75,000 to $99,999 | 4 | 13.8% |
| $100,000 to $149,999 | 6 | 20.7% |
| $150,000 to $199,999 | 4 | 13.8% |
| $200,000+ | 3 | 10.3% |
Family Income by Famaliy Size in Petersburg
2-person families (19 | 65.5%) account for the highest median family income in Petersburg with $75,625 per family, while 2-person families (19 | 65.5%) have the highest median income of $37,812 per family member.
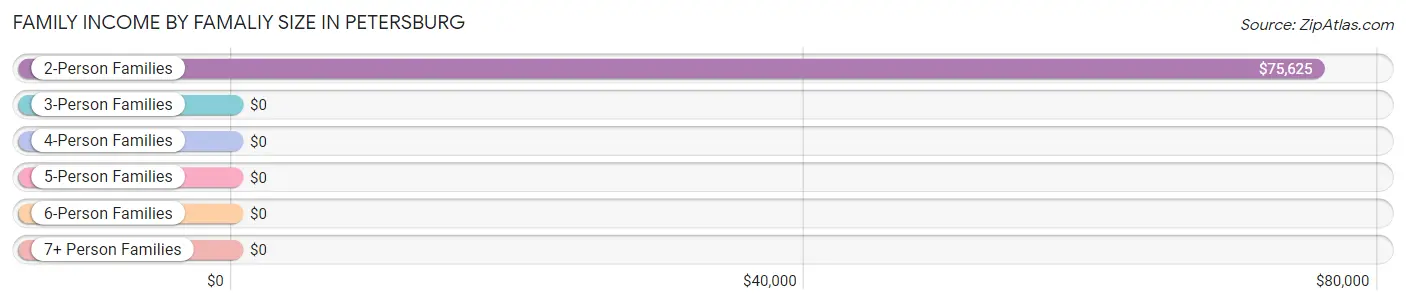
| Income Bracket | # Families | Median Income |
| 2-Person Families | 19 (65.5%) | $75,625 |
| 3-Person Families | 5 (17.2%) | $0 |
| 4-Person Families | 2 (6.9%) | $0 |
| 5-Person Families | 2 (6.9%) | $0 |
| 6-Person Families | 1 (3.5%) | $0 |
| 7+ Person Families | 0 (0.0%) | $0 |
| Total | 29 (100.0%) | $88,750 |
Family Income by Number of Earners in Petersburg
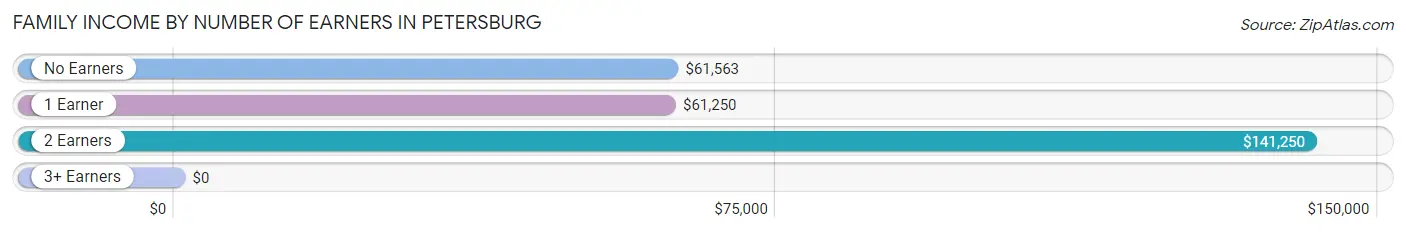
| Number of Earners | # Families | Median Income |
| No Earners | 7 (24.1%) | $61,563 |
| 1 Earner | 9 (31.0%) | $61,250 |
| 2 Earners | 11 (37.9%) | $141,250 |
| 3+ Earners | 2 (6.9%) | $0 |
| Total | 29 (100.0%) | $88,750 |
Household Income in Petersburg
Household Income Brackets in Petersburg
With 13 households falling in the category, the $35,000 to $49,999 income range is the most frequent in Petersburg, accounting for 22.4% of all households.
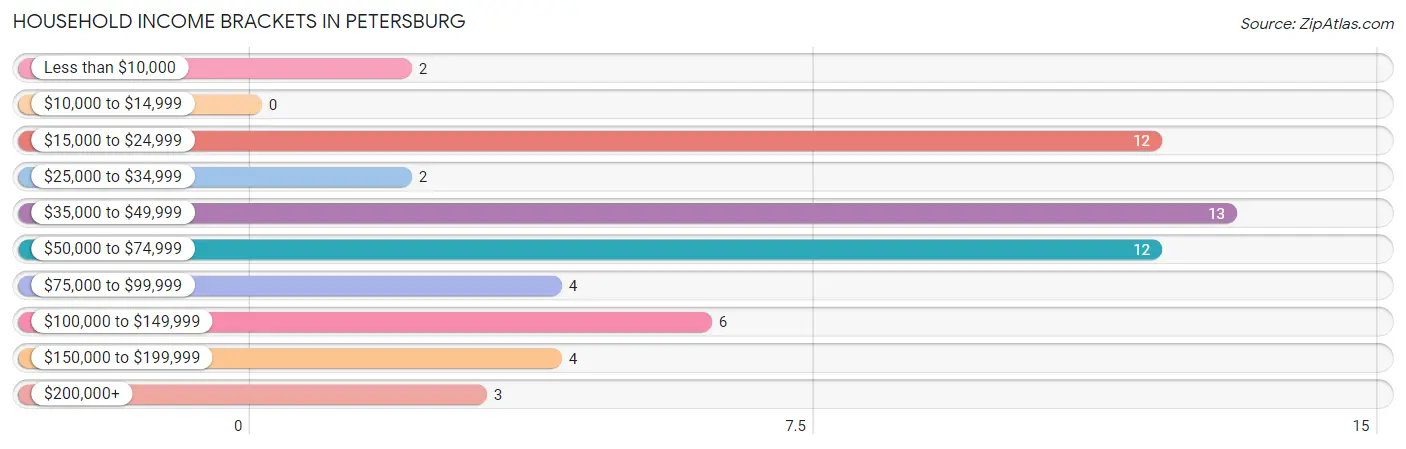
| Income Bracket | # Households | % Households |
| Less than $10,000 | 2 | 3.4% |
| $10,000 to $14,999 | 0 | 0.0% |
| $15,000 to $24,999 | 12 | 20.7% |
| $25,000 to $34,999 | 2 | 3.4% |
| $35,000 to $49,999 | 13 | 22.4% |
| $50,000 to $74,999 | 12 | 20.7% |
| $75,000 to $99,999 | 4 | 6.9% |
| $100,000 to $149,999 | 6 | 10.3% |
| $150,000 to $199,999 | 4 | 6.9% |
| $200,000+ | 3 | 5.2% |
Household Income by Householder Age in Petersburg
The median household income in Petersburg is $53,750, with the highest median household income of $83,750 found in the 25 to 44 years age bracket for the primary householder. A total of 12 households (20.7%) fall into this category. Meanwhile, the 15 to 24 years age bracket for the primary householder has the lowest median household income of $0, with 1 households (1.7%) in this group.
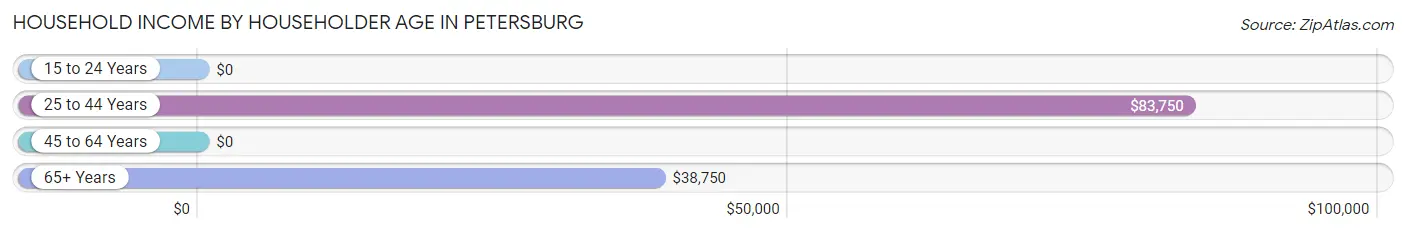
| Income Bracket | # Households | Median Income |
| 15 to 24 Years | 1 (1.7%) | $0 |
| 25 to 44 Years | 12 (20.7%) | $83,750 |
| 45 to 64 Years | 13 (22.4%) | $0 |
| 65+ Years | 32 (55.2%) | $38,750 |
| Total | 58 (100.0%) | $53,750 |
Poverty in Petersburg
Income Below Poverty by Sex and Age in Petersburg
With 6.8% poverty level for males and 1.4% for females among the residents of Petersburg, 65 to 74 year old males and 55 to 64 year old females are the most vulnerable to poverty, with 4 males (18.2%) and 1 females (8.3%) in their respective age groups living below the poverty level.
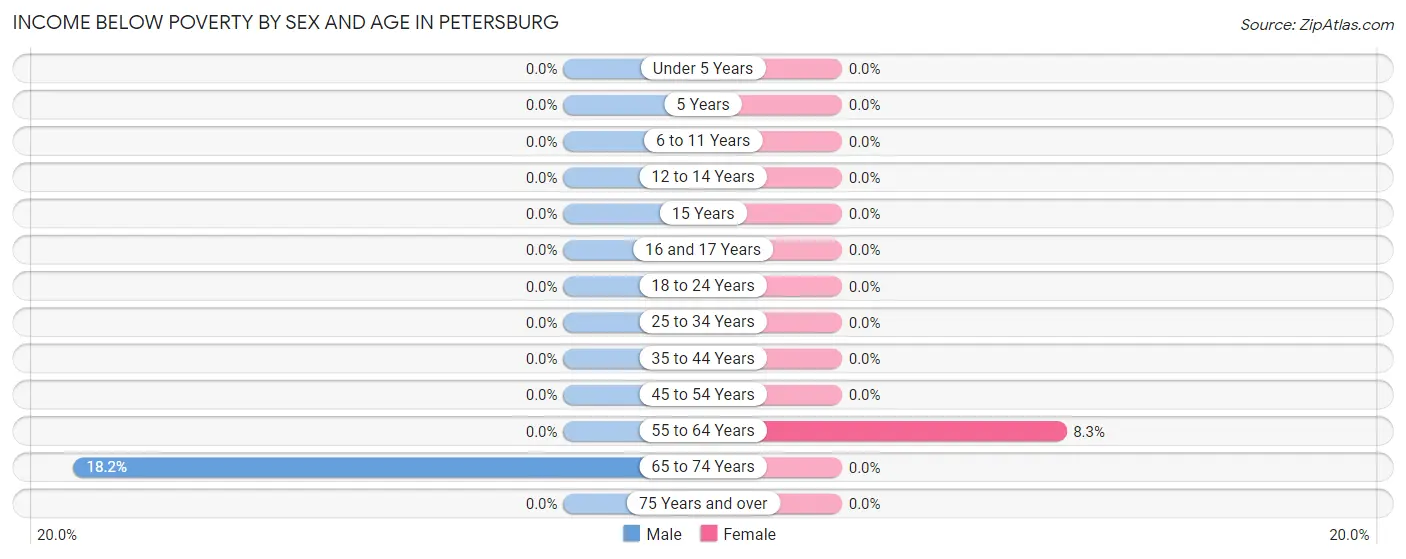
| Age Bracket | Male | Female |
| Under 5 Years | 0 (0.0%) | 0 (0.0%) |
| 5 Years | 0 (0.0%) | 0 (0.0%) |
| 6 to 11 Years | 0 (0.0%) | 0 (0.0%) |
| 12 to 14 Years | 0 (0.0%) | 0 (0.0%) |
| 15 Years | 0 (0.0%) | 0 (0.0%) |
| 16 and 17 Years | 0 (0.0%) | 0 (0.0%) |
| 18 to 24 Years | 0 (0.0%) | 0 (0.0%) |
| 25 to 34 Years | 0 (0.0%) | 0 (0.0%) |
| 35 to 44 Years | 0 (0.0%) | 0 (0.0%) |
| 45 to 54 Years | 0 (0.0%) | 0 (0.0%) |
| 55 to 64 Years | 0 (0.0%) | 1 (8.3%) |
| 65 to 74 Years | 4 (18.2%) | 0 (0.0%) |
| 75 Years and over | 0 (0.0%) | 0 (0.0%) |
| Total | 4 (6.8%) | 1 (1.4%) |
Income Above Poverty by Sex and Age in Petersburg
According to the poverty statistics in Petersburg, males aged under 5 years and females aged 5 years are the age groups that are most secure financially, with 100.0% of males and 100.0% of females in these age groups living above the poverty line.
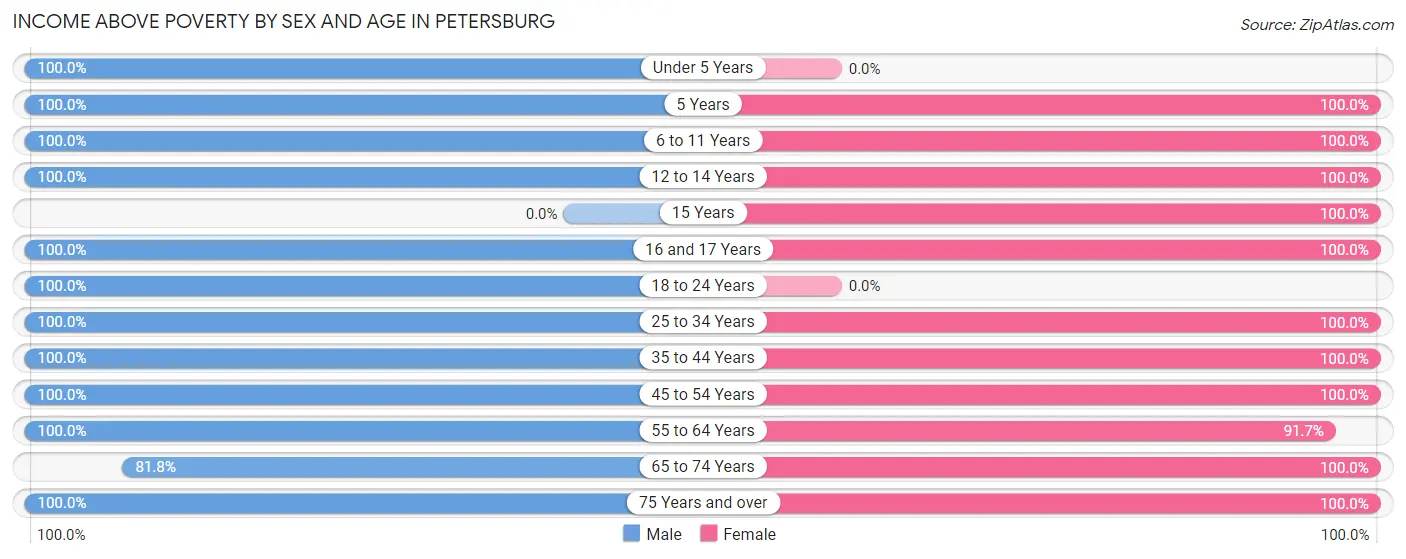
| Age Bracket | Male | Female |
| Under 5 Years | 2 (100.0%) | 0 (0.0%) |
| 5 Years | 1 (100.0%) | 8 (100.0%) |
| 6 to 11 Years | 6 (100.0%) | 6 (100.0%) |
| 12 to 14 Years | 1 (100.0%) | 4 (100.0%) |
| 15 Years | 0 (0.0%) | 2 (100.0%) |
| 16 and 17 Years | 1 (100.0%) | 4 (100.0%) |
| 18 to 24 Years | 1 (100.0%) | 0 (0.0%) |
| 25 to 34 Years | 6 (100.0%) | 4 (100.0%) |
| 35 to 44 Years | 6 (100.0%) | 7 (100.0%) |
| 45 to 54 Years | 1 (100.0%) | 1 (100.0%) |
| 55 to 64 Years | 7 (100.0%) | 11 (91.7%) |
| 65 to 74 Years | 18 (81.8%) | 13 (100.0%) |
| 75 Years and over | 5 (100.0%) | 11 (100.0%) |
| Total | 55 (93.2%) | 71 (98.6%) |
Income Below Poverty Among Married-Couple Families in Petersburg
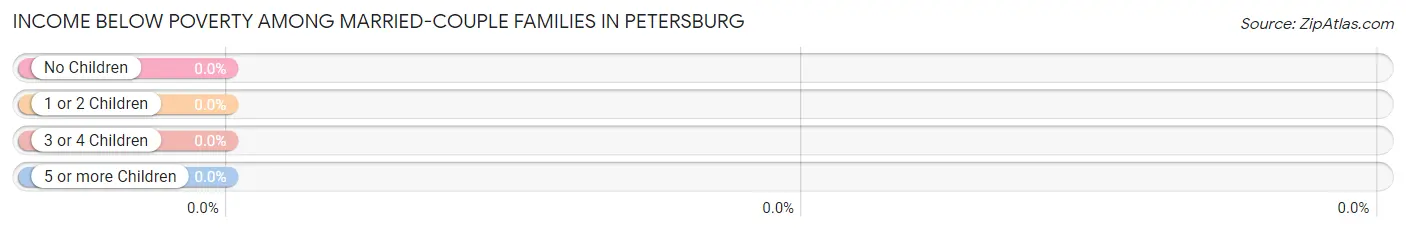
| Children | Above Poverty | Below Poverty |
| No Children | 18 (100.0%) | 0 (0.0%) |
| 1 or 2 Children | 7 (100.0%) | 0 (0.0%) |
| 3 or 4 Children | 3 (100.0%) | 0 (0.0%) |
| 5 or more Children | 0 (0.0%) | 0 (0.0%) |
| Total | 28 (100.0%) | 0 (0.0%) |
Income Below Poverty Among Single-Parent Households in Petersburg
| Children | Single Father | Single Mother |
| No Children | 0 (0.0%) | 0 (0.0%) |
| 1 or 2 Children | 0 (0.0%) | 0 (0.0%) |
| 3 or 4 Children | 0 (0.0%) | 0 (0.0%) |
| 5 or more Children | 0 (0.0%) | 0 (0.0%) |
| Total | 0 (0.0%) | 0 (0.0%) |
Income Below Poverty Among Married-Couple vs Single-Parent Households in Petersburg
| Children | Married-Couple Families | Single-Parent Households |
| No Children | 0 (0.0%) | 0 (0.0%) |
| 1 or 2 Children | 0 (0.0%) | 0 (0.0%) |
| 3 or 4 Children | 0 (0.0%) | 0 (0.0%) |
| 5 or more Children | 0 (0.0%) | 0 (0.0%) |
| Total | 0 (0.0%) | 0 (0.0%) |
Race in Petersburg
The most populous races in Petersburg are White / Caucasian (113 | 86.3%), Two or more Races (9 | 6.9%), and Hispanic or Latino (5 | 3.8%).
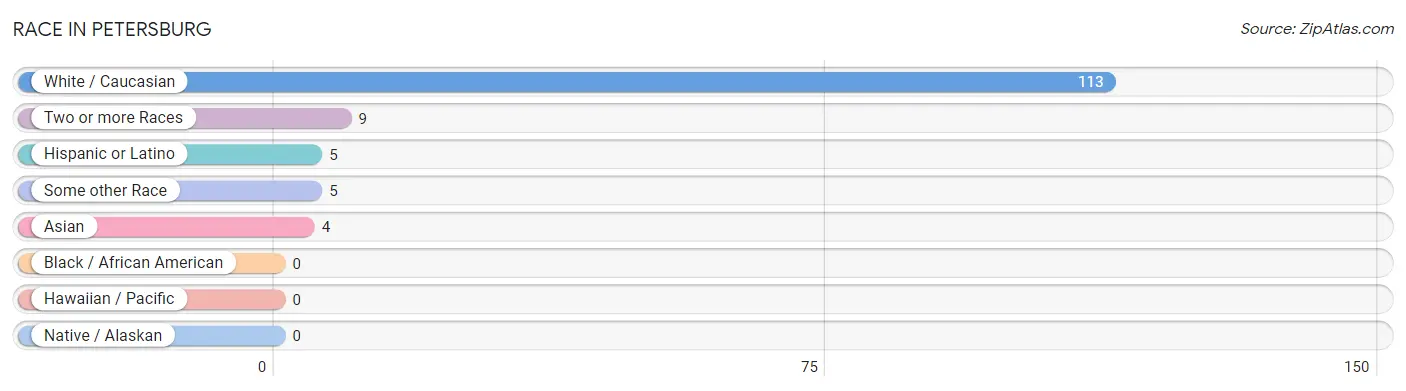
| Race | # Population | % Population |
| Asian | 4 | 3.0% |
| Black / African American | 0 | 0.0% |
| Hawaiian / Pacific | 0 | 0.0% |
| Hispanic or Latino | 5 | 3.8% |
| Native / Alaskan | 0 | 0.0% |
| White / Caucasian | 113 | 86.3% |
| Two or more Races | 9 | 6.9% |
| Some other Race | 5 | 3.8% |
| Total | 131 | 100.0% |
Ancestry in Petersburg
The most populous ancestries reported in Petersburg are Norwegian (50 | 38.2%), German (32 | 24.4%), Korean (9 | 6.9%), Irish (8 | 6.1%), and Finnish (7 | 5.3%), together accounting for 80.9% of all Petersburg residents.
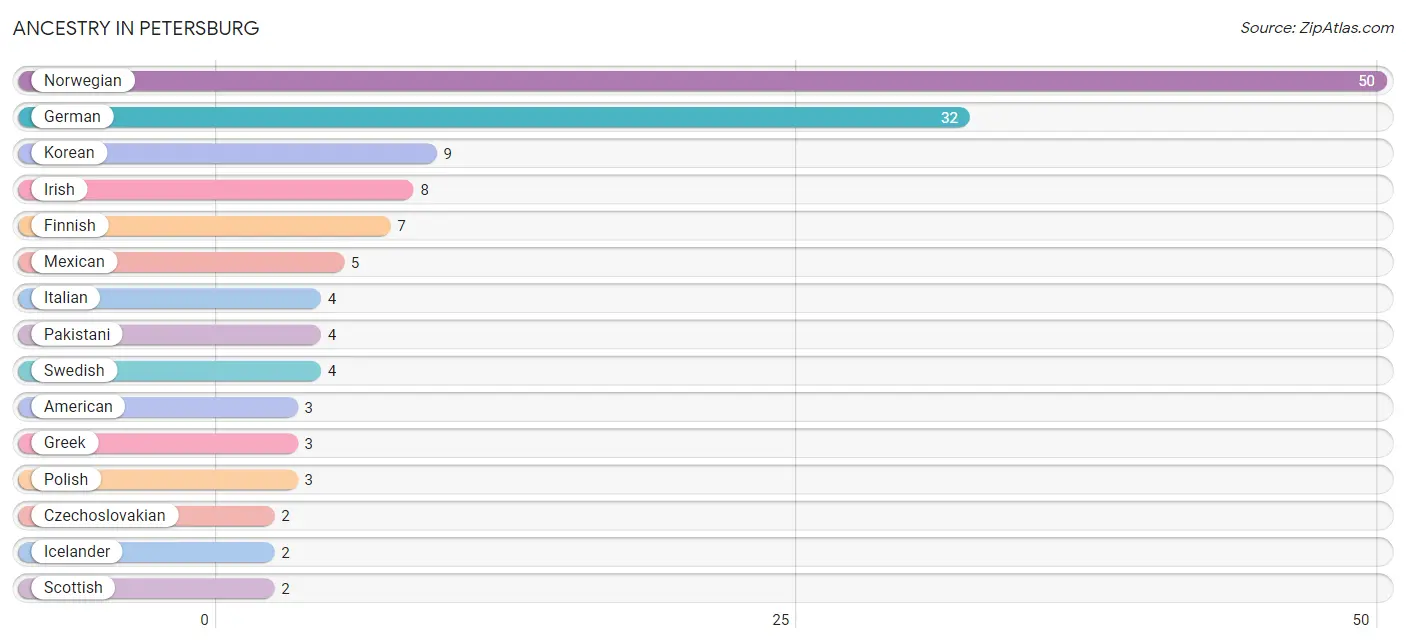
| Ancestry | # Population | % Population |
| American | 3 | 2.3% |
| Czechoslovakian | 2 | 1.5% |
| Danish | 1 | 0.8% |
| Dutch | 1 | 0.8% |
| European | 1 | 0.8% |
| Finnish | 7 | 5.3% |
| French Canadian | 1 | 0.8% |
| German | 32 | 24.4% |
| Greek | 3 | 2.3% |
| Icelander | 2 | 1.5% |
| Irish | 8 | 6.1% |
| Italian | 4 | 3.0% |
| Korean | 9 | 6.9% |
| Mexican | 5 | 3.8% |
| Norwegian | 50 | 38.2% |
| Pakistani | 4 | 3.0% |
| Polish | 3 | 2.3% |
| Scotch-Irish | 1 | 0.8% |
| Scottish | 2 | 1.5% |
| Swedish | 4 | 3.0% |
| Swiss | 2 | 1.5% | View All 21 Rows |
Immigrants in Petersburg
The most numerous immigrant groups reported in Petersburg came from Asia (4 | 3.0%), South Eastern Asia (4 | 3.0%), Thailand (4 | 3.0%), Europe (1 | 0.8%), and Germany (1 | 0.8%), together accounting for 10.7% of all Petersburg residents.
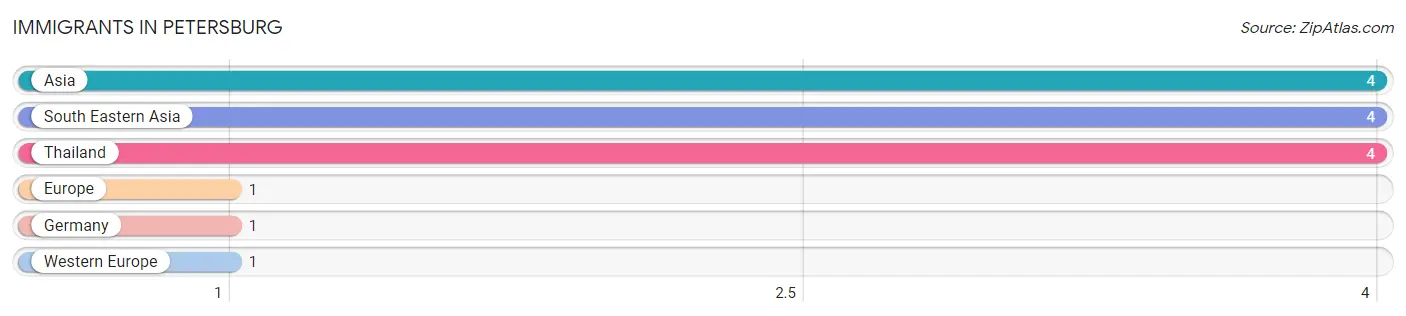
| Immigration Origin | # Population | % Population |
| Asia | 4 | 3.0% |
| Europe | 1 | 0.8% |
| Germany | 1 | 0.8% |
| South Eastern Asia | 4 | 3.0% |
| Thailand | 4 | 3.0% |
| Western Europe | 1 | 0.8% | View All 6 Rows |
Sex and Age in Petersburg
Sex and Age in Petersburg
The most populous age groups in Petersburg are 70 to 74 Years (12 | 20.3%) for men and 5 to 9 Years (12 | 16.7%) for women.
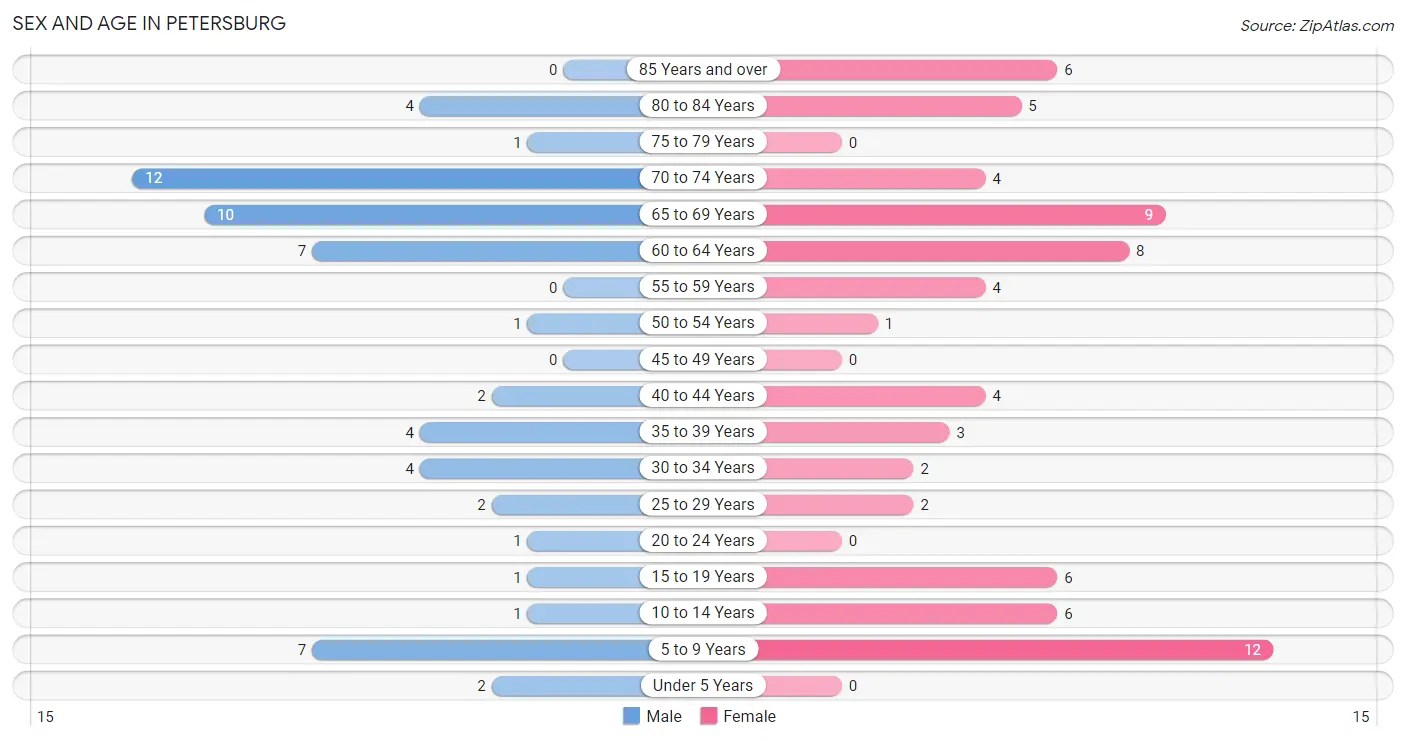
| Age Bracket | Male | Female |
| Under 5 Years | 2 (3.4%) | 0 (0.0%) |
| 5 to 9 Years | 7 (11.9%) | 12 (16.7%) |
| 10 to 14 Years | 1 (1.7%) | 6 (8.3%) |
| 15 to 19 Years | 1 (1.7%) | 6 (8.3%) |
| 20 to 24 Years | 1 (1.7%) | 0 (0.0%) |
| 25 to 29 Years | 2 (3.4%) | 2 (2.8%) |
| 30 to 34 Years | 4 (6.8%) | 2 (2.8%) |
| 35 to 39 Years | 4 (6.8%) | 3 (4.2%) |
| 40 to 44 Years | 2 (3.4%) | 4 (5.6%) |
| 45 to 49 Years | 0 (0.0%) | 0 (0.0%) |
| 50 to 54 Years | 1 (1.7%) | 1 (1.4%) |
| 55 to 59 Years | 0 (0.0%) | 4 (5.6%) |
| 60 to 64 Years | 7 (11.9%) | 8 (11.1%) |
| 65 to 69 Years | 10 (17.0%) | 9 (12.5%) |
| 70 to 74 Years | 12 (20.3%) | 4 (5.6%) |
| 75 to 79 Years | 1 (1.7%) | 0 (0.0%) |
| 80 to 84 Years | 4 (6.8%) | 5 (6.9%) |
| 85 Years and over | 0 (0.0%) | 6 (8.3%) |
| Total | 59 (100.0%) | 72 (100.0%) |
Families and Households in Petersburg
Median Family Size in Petersburg
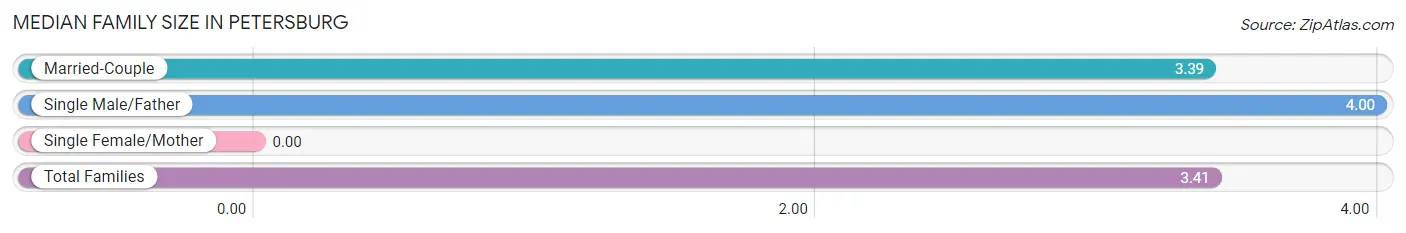
| Family Type | # Families | Family Size |
| Married-Couple | 28 (96.6%) | 3.39 |
| Single Male/Father | 1 (3.5%) | 4.00 |
| Single Female/Mother | 0 (0.0%) | - |
| Total Families | 29 (100.0%) | 3.41 |
Median Household Size in Petersburg
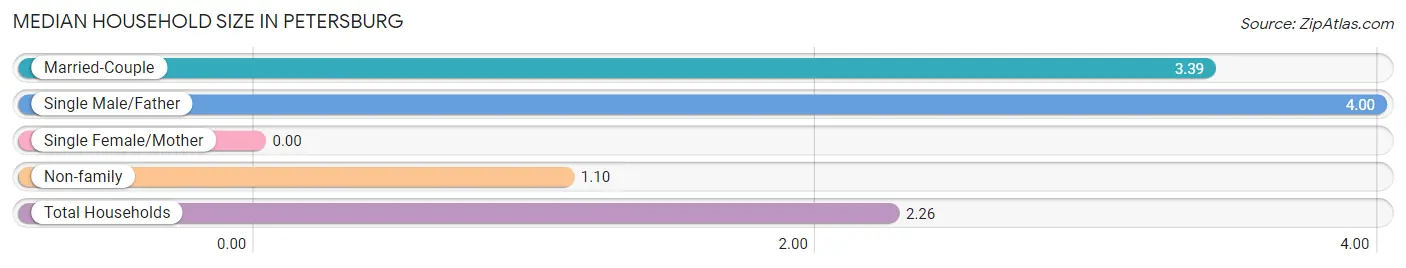
| Household Type | # Households | Household Size |
| Married-Couple | 28 (48.3%) | 3.39 |
| Single Male/Father | 1 (1.7%) | 4.00 |
| Single Female/Mother | 0 (0.0%) | - |
| Non-family | 29 (50.0%) | 1.10 |
| Total Households | 58 (100.0%) | 2.26 |
Household Size by Marriage Status in Petersburg
Out of a total of 58 households in Petersburg, 29 (50.0%) are family households, while 29 (50.0%) are nonfamily households. The most numerous type of family households are 2-person households, comprising 19, and the most common type of nonfamily households are 1-person households, comprising 25.
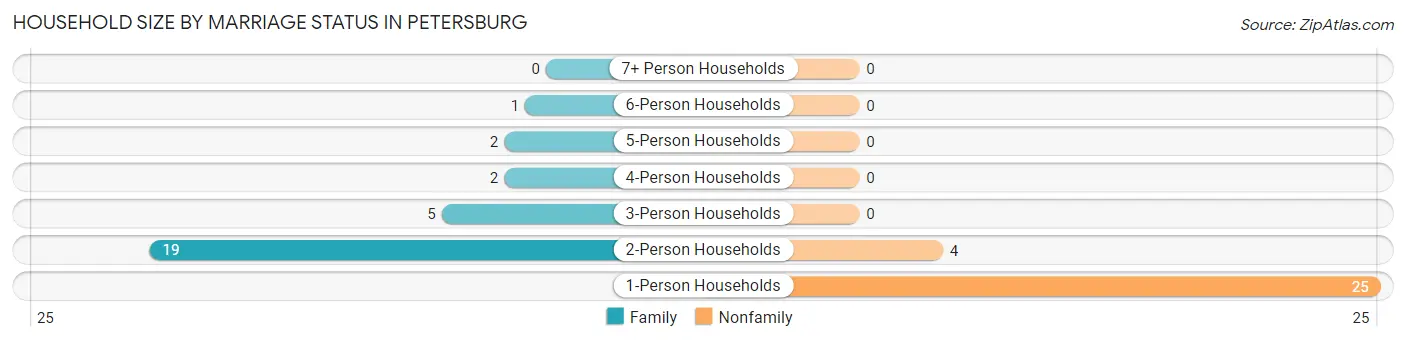
| Household Size | Family Households | Nonfamily Households |
| 1-Person Households | - | 25 (43.1%) |
| 2-Person Households | 19 (32.8%) | 4 (6.9%) |
| 3-Person Households | 5 (8.6%) | 0 (0.0%) |
| 4-Person Households | 2 (3.5%) | 0 (0.0%) |
| 5-Person Households | 2 (3.5%) | 0 (0.0%) |
| 6-Person Households | 1 (1.7%) | 0 (0.0%) |
| 7+ Person Households | 0 (0.0%) | 0 (0.0%) |
| Total | 29 (50.0%) | 29 (50.0%) |
Female Fertility in Petersburg
Fertility by Age in Petersburg
| Age Bracket | Women with Births | Births / 1,000 Women |
| 15 to 19 years | 0 (0.0%) | 0.0 |
| 20 to 34 years | 0 (0.0%) | 0.0 |
| 35 to 50 years | 0 (0.0%) | 0.0 |
| Total | 0 (0.0%) | 0.0 |
Fertility by Age by Marriage Status in Petersburg
| Age Bracket | Married | Unmarried |
| 15 to 19 years | 0 (0.0%) | 0 (0.0%) |
| 20 to 34 years | 0 (0.0%) | 0 (0.0%) |
| 35 to 50 years | 0 (0.0%) | 0 (0.0%) |
| Total | 0 (0.0%) | 0 (0.0%) |
Fertility by Education in Petersburg
| Educational Attainment | Women with Births | Births / 1,000 Women |
| Less than High School | 0 (0.0%) | 0.0 |
| High School Diploma | 0 (0.0%) | 0.0 |
| College or Associate's Degree | 0 (0.0%) | 0.0 |
| Bachelor's Degree | 0 (0.0%) | 0.0 |
| Graduate Degree | 0 (0.0%) | 0.0 |
| Total | 0 (0.0%) | 0.0 |
Fertility by Education by Marriage Status in Petersburg
| Educational Attainment | Married | Unmarried |
| Less than High School | 0 (0.0%) | 0 (0.0%) |
| High School Diploma | 0 (0.0%) | 0 (0.0%) |
| College or Associate's Degree | 0 (0.0%) | 0 (0.0%) |
| Bachelor's Degree | 0 (0.0%) | 0 (0.0%) |
| Graduate Degree | 0 (0.0%) | 0 (0.0%) |
| Total | 0 (0.0%) | 0 (0.0%) |
Employment Characteristics in Petersburg
Employment by Class of Employer in Petersburg
Among the 50 employed individuals in Petersburg, private company employees (30 | 60.0%), federal government employees (5 | 10.0%), and not-for-profit organizations (4 | 8.0%) make up the most common classes of employment.
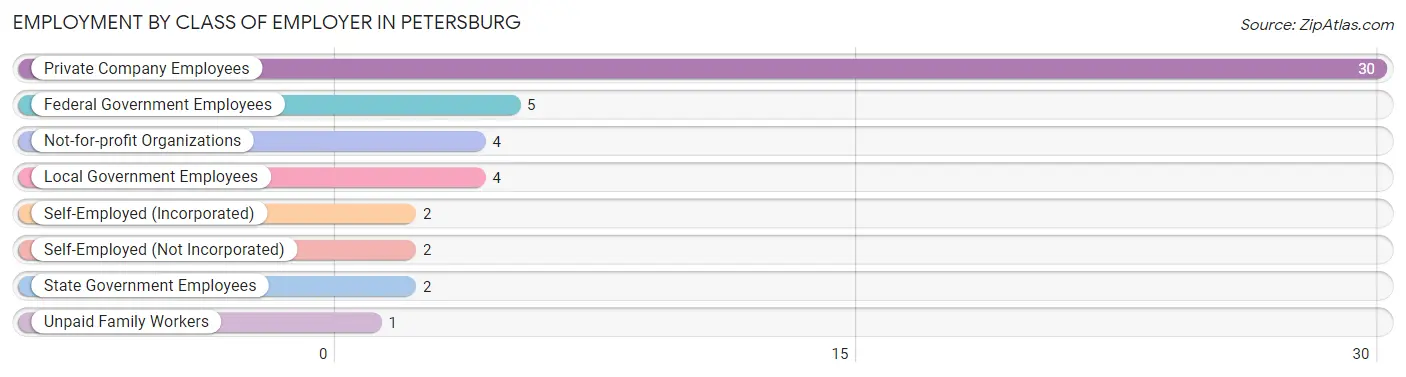
| Employer Class | # Employees | % Employees |
| Private Company Employees | 30 | 60.0% |
| Self-Employed (Incorporated) | 2 | 4.0% |
| Self-Employed (Not Incorporated) | 2 | 4.0% |
| Not-for-profit Organizations | 4 | 8.0% |
| Local Government Employees | 4 | 8.0% |
| State Government Employees | 2 | 4.0% |
| Federal Government Employees | 5 | 10.0% |
| Unpaid Family Workers | 1 | 2.0% |
| Total | 50 | 100.0% |
Employment Status by Age in Petersburg
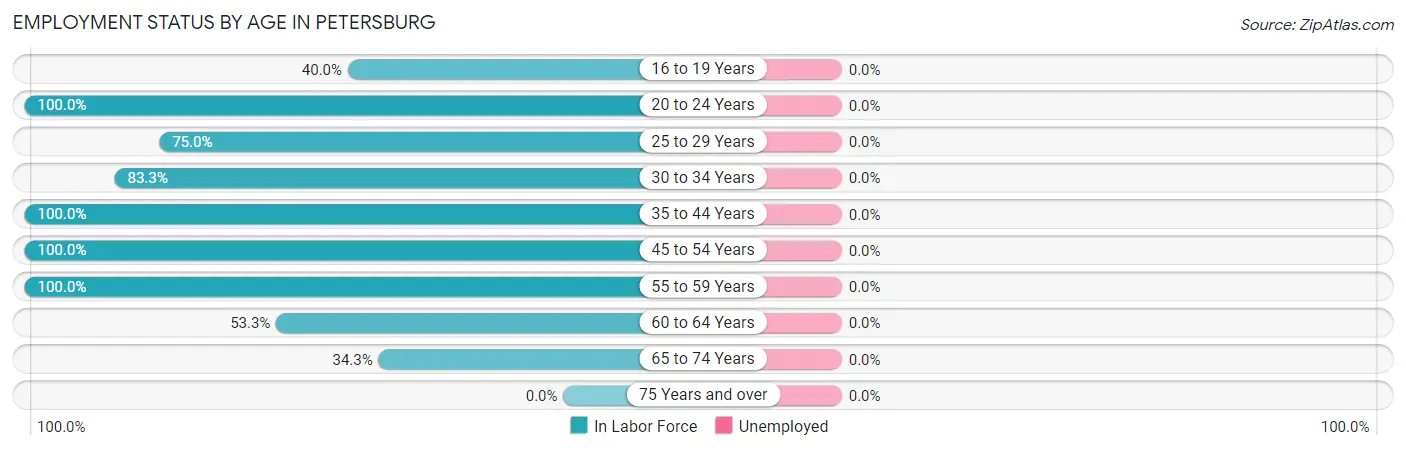
| Age Bracket | In Labor Force | Unemployed |
| 16 to 19 Years | 2 (40.0%) | 0 (0.0%) |
| 20 to 24 Years | 1 (100.0%) | 0 (0.0%) |
| 25 to 29 Years | 3 (75.0%) | 0 (0.0%) |
| 30 to 34 Years | 5 (83.3%) | 0 (0.0%) |
| 35 to 44 Years | 13 (100.0%) | 0 (0.0%) |
| 45 to 54 Years | 2 (100.0%) | 0 (0.0%) |
| 55 to 59 Years | 4 (100.0%) | 0 (0.0%) |
| 60 to 64 Years | 8 (53.3%) | 0 (0.0%) |
| 65 to 74 Years | 12 (34.3%) | 0 (0.0%) |
| 75 Years and over | 0 (0.0%) | 0 (0.0%) |
| Total | 50 (49.5%) | 0 (0.0%) |
Employment Status by Educational Attainment in Petersburg
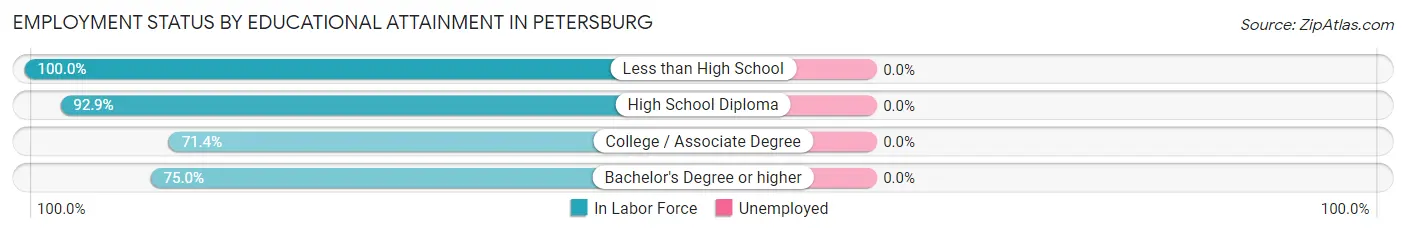
| Educational Attainment | In Labor Force | Unemployed |
| Less than High School | 1 (100.0%) | 0 (0.0%) |
| High School Diploma | 13 (92.9%) | 0 (0.0%) |
| College / Associate Degree | 15 (71.4%) | 0 (0.0%) |
| Bachelor's Degree or higher | 6 (75.0%) | 0 (0.0%) |
| Total | 35 (79.5%) | 0 (0.0%) |
Employment Occupations by Sex in Petersburg
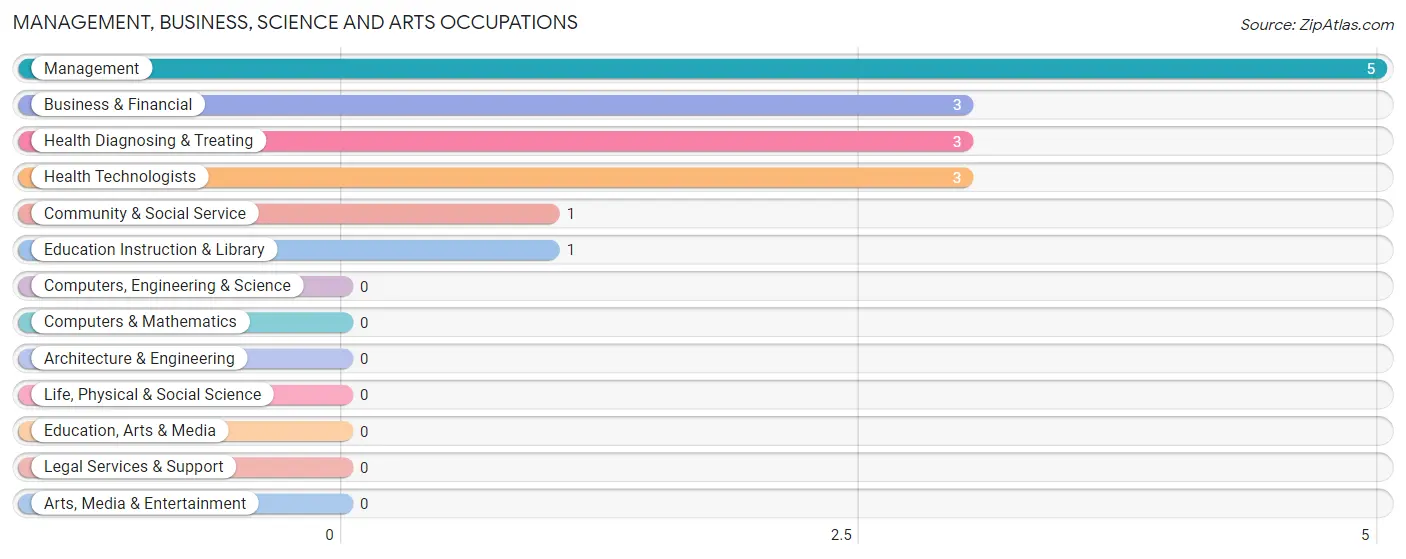
Management, Business, Science and Arts Occupations
The most common Management, Business, Science and Arts occupations in Petersburg are Management (5 | 10.2%), Business & Financial (3 | 6.1%), Health Diagnosing & Treating (3 | 6.1%), Health Technologists (3 | 6.1%), and Community & Social Service (1 | 2.0%).
Management, Business, Science and Arts Occupations by Sex
Within the Management, Business, Science and Arts occupations in Petersburg, the most male-oriented occupations are Management (100.0%), and Business & Financial (100.0%), while the most female-oriented occupations are Community & Social Service (100.0%), Education Instruction & Library (100.0%), and Health Diagnosing & Treating (100.0%).
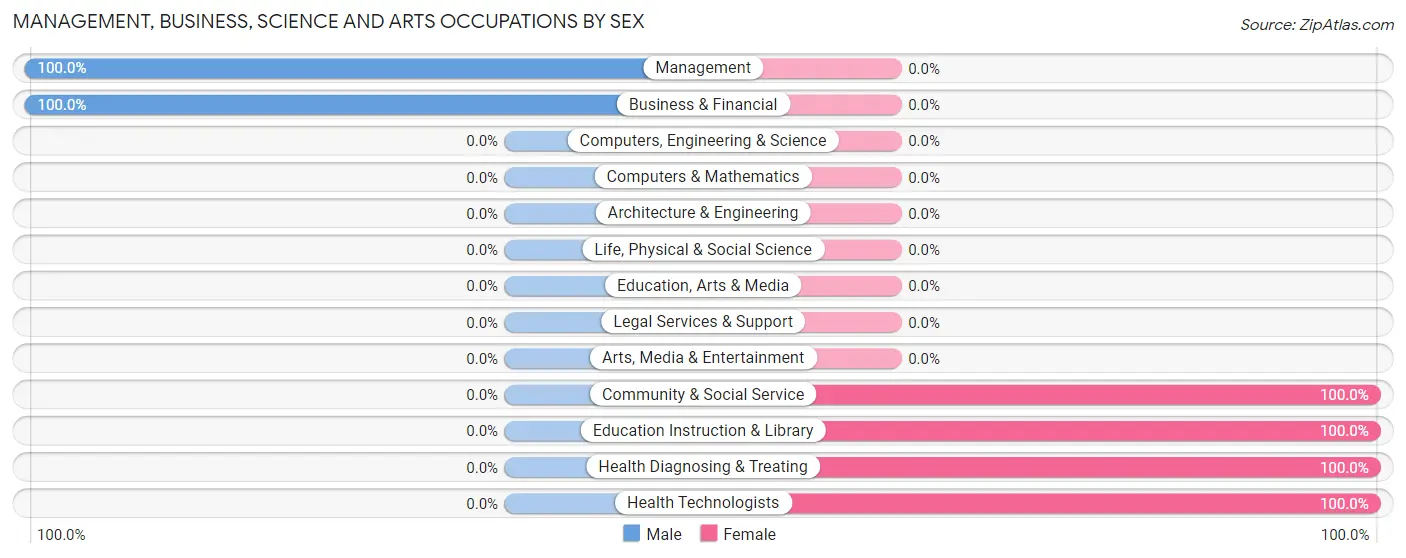
| Occupation | Male | Female |
| Management | 5 (100.0%) | 0 (0.0%) |
| Business & Financial | 3 (100.0%) | 0 (0.0%) |
| Computers, Engineering & Science | 0 (0.0%) | 0 (0.0%) |
| Computers & Mathematics | 0 (0.0%) | 0 (0.0%) |
| Architecture & Engineering | 0 (0.0%) | 0 (0.0%) |
| Life, Physical & Social Science | 0 (0.0%) | 0 (0.0%) |
| Community & Social Service | 0 (0.0%) | 1 (100.0%) |
| Education, Arts & Media | 0 (0.0%) | 0 (0.0%) |
| Legal Services & Support | 0 (0.0%) | 0 (0.0%) |
| Education Instruction & Library | 0 (0.0%) | 1 (100.0%) |
| Arts, Media & Entertainment | 0 (0.0%) | 0 (0.0%) |
| Health Diagnosing & Treating | 0 (0.0%) | 3 (100.0%) |
| Health Technologists | 0 (0.0%) | 3 (100.0%) |
| Total (Category) | 8 (66.7%) | 4 (33.3%) |
| Total (Overall) | 27 (55.1%) | 22 (44.9%) |
Services Occupations
The most common Services occupations in Petersburg are Food Preparation & Serving (5 | 10.2%), Security & Protection (3 | 6.1%), Law Enforcement (3 | 6.1%), Healthcare Support (2 | 4.1%), and Cleaning & Maintenance (1 | 2.0%).
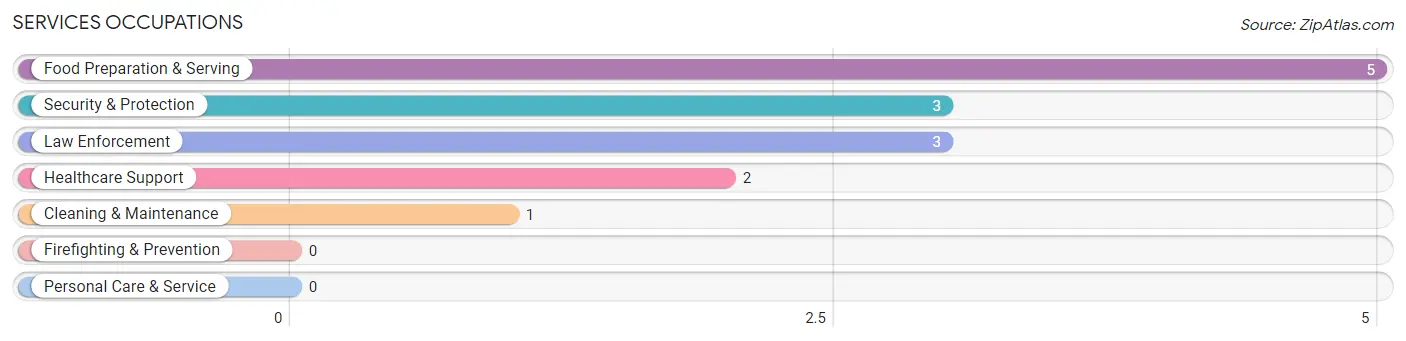
Services Occupations by Sex
Within the Services occupations in Petersburg, the most male-oriented occupations are Security & Protection (100.0%), Law Enforcement (100.0%), and Cleaning & Maintenance (100.0%), while the most female-oriented occupations are Healthcare Support (100.0%), and Food Preparation & Serving (100.0%).
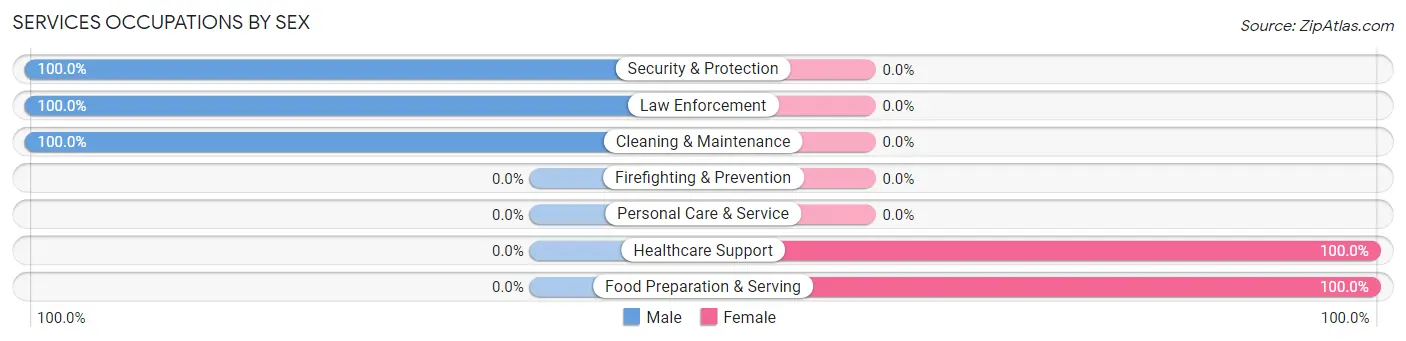
| Occupation | Male | Female |
| Healthcare Support | 0 (0.0%) | 2 (100.0%) |
| Security & Protection | 3 (100.0%) | 0 (0.0%) |
| Firefighting & Prevention | 0 (0.0%) | 0 (0.0%) |
| Law Enforcement | 3 (100.0%) | 0 (0.0%) |
| Food Preparation & Serving | 0 (0.0%) | 5 (100.0%) |
| Cleaning & Maintenance | 1 (100.0%) | 0 (0.0%) |
| Personal Care & Service | 0 (0.0%) | 0 (0.0%) |
| Total (Category) | 4 (36.4%) | 7 (63.6%) |
| Total (Overall) | 27 (55.1%) | 22 (44.9%) |
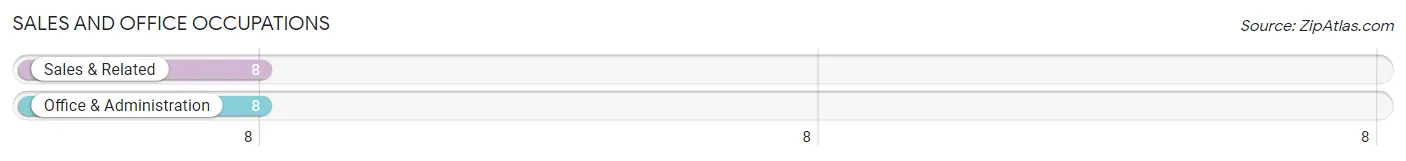
Sales and Office Occupations
The most common Sales and Office occupations in Petersburg are Sales & Related (8 | 16.3%), and Office & Administration (8 | 16.3%).
Sales and Office Occupations by Sex
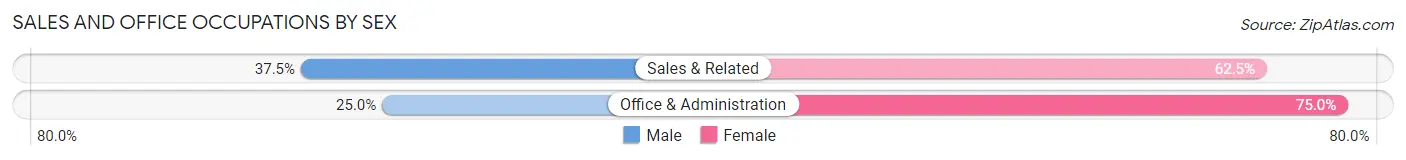
| Occupation | Male | Female |
| Sales & Related | 3 (37.5%) | 5 (62.5%) |
| Office & Administration | 2 (25.0%) | 6 (75.0%) |
| Total (Category) | 5 (31.2%) | 11 (68.8%) |
| Total (Overall) | 27 (55.1%) | 22 (44.9%) |
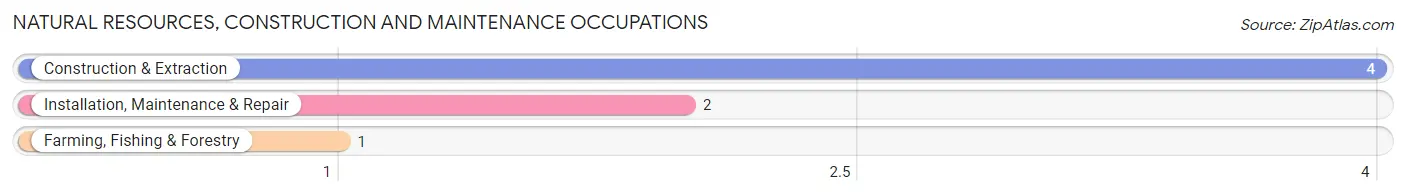
Natural Resources, Construction and Maintenance Occupations
The most common Natural Resources, Construction and Maintenance occupations in Petersburg are Construction & Extraction (4 | 8.2%), Installation, Maintenance & Repair (2 | 4.1%), and Farming, Fishing & Forestry (1 | 2.0%).
Natural Resources, Construction and Maintenance Occupations by Sex
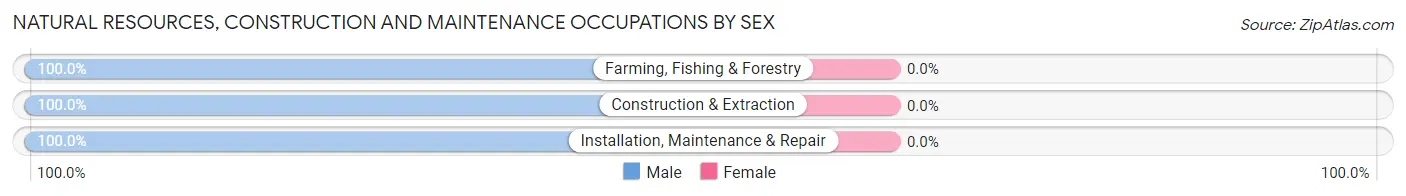
| Occupation | Male | Female |
| Farming, Fishing & Forestry | 1 (100.0%) | 0 (0.0%) |
| Construction & Extraction | 4 (100.0%) | 0 (0.0%) |
| Installation, Maintenance & Repair | 2 (100.0%) | 0 (0.0%) |
| Total (Category) | 7 (100.0%) | 0 (0.0%) |
| Total (Overall) | 27 (55.1%) | 22 (44.9%) |
Production, Transportation and Moving Occupations
The most common Production, Transportation and Moving occupations in Petersburg are Production (2 | 4.1%), and Transportation (1 | 2.0%).
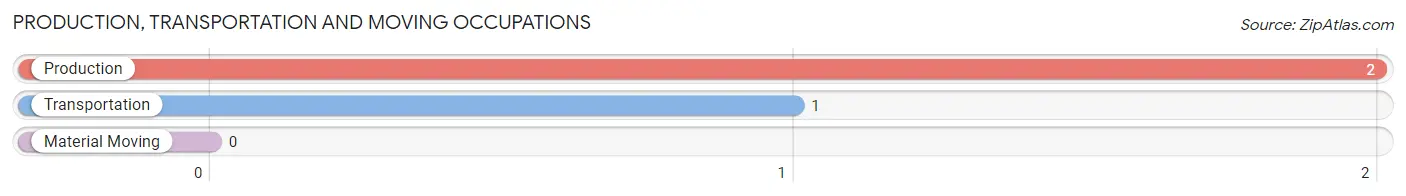
Production, Transportation and Moving Occupations by Sex
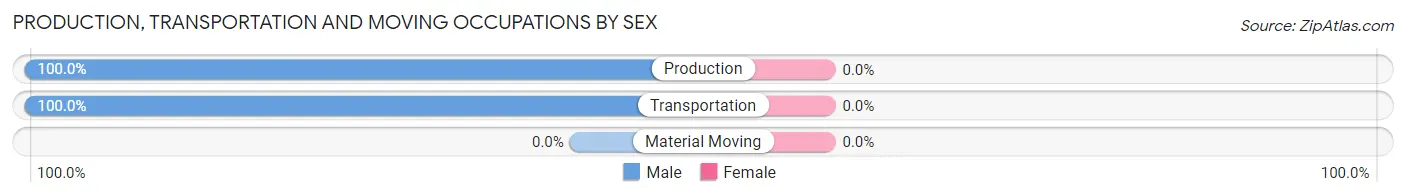
| Occupation | Male | Female |
| Production | 2 (100.0%) | 0 (0.0%) |
| Transportation | 1 (100.0%) | 0 (0.0%) |
| Material Moving | 0 (0.0%) | 0 (0.0%) |
| Total (Category) | 3 (100.0%) | 0 (0.0%) |
| Total (Overall) | 27 (55.1%) | 22 (44.9%) |
Employment Industries by Sex in Petersburg
Employment Industries in Petersburg
The major employment industries in Petersburg include Construction (9 | 18.4%), Retail Trade (6 | 12.2%), Public Administration (6 | 12.2%), Finance & Insurance (5 | 10.2%), and Educational Services (4 | 8.2%).
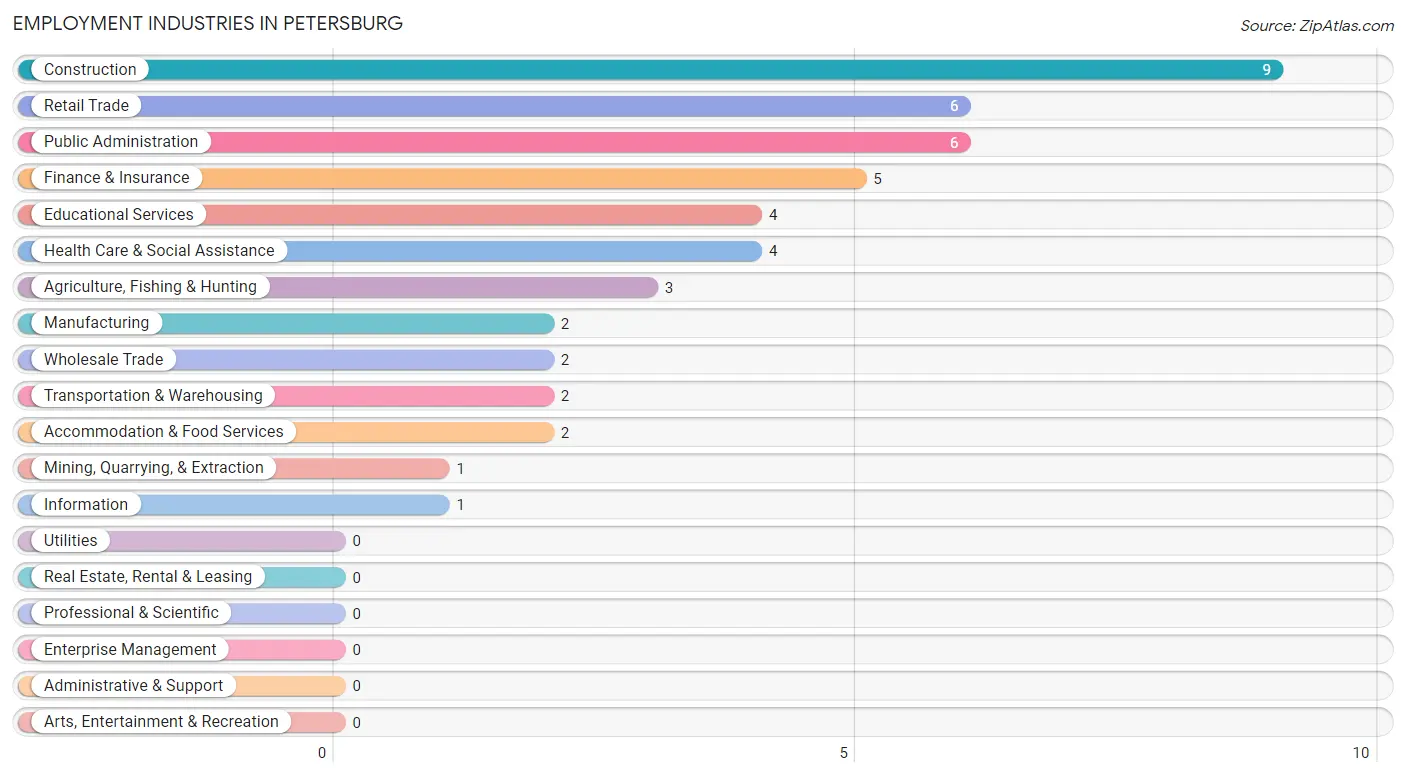
Employment Industries by Sex in Petersburg
The Petersburg industries that see more men than women are Agriculture, Fishing & Hunting (100.0%), Mining, Quarrying, & Extraction (100.0%), and Manufacturing (100.0%), whereas the industries that tend to have a higher number of women are Educational Services (100.0%), Health Care & Social Assistance (100.0%), and Accommodation & Food Services (100.0%).
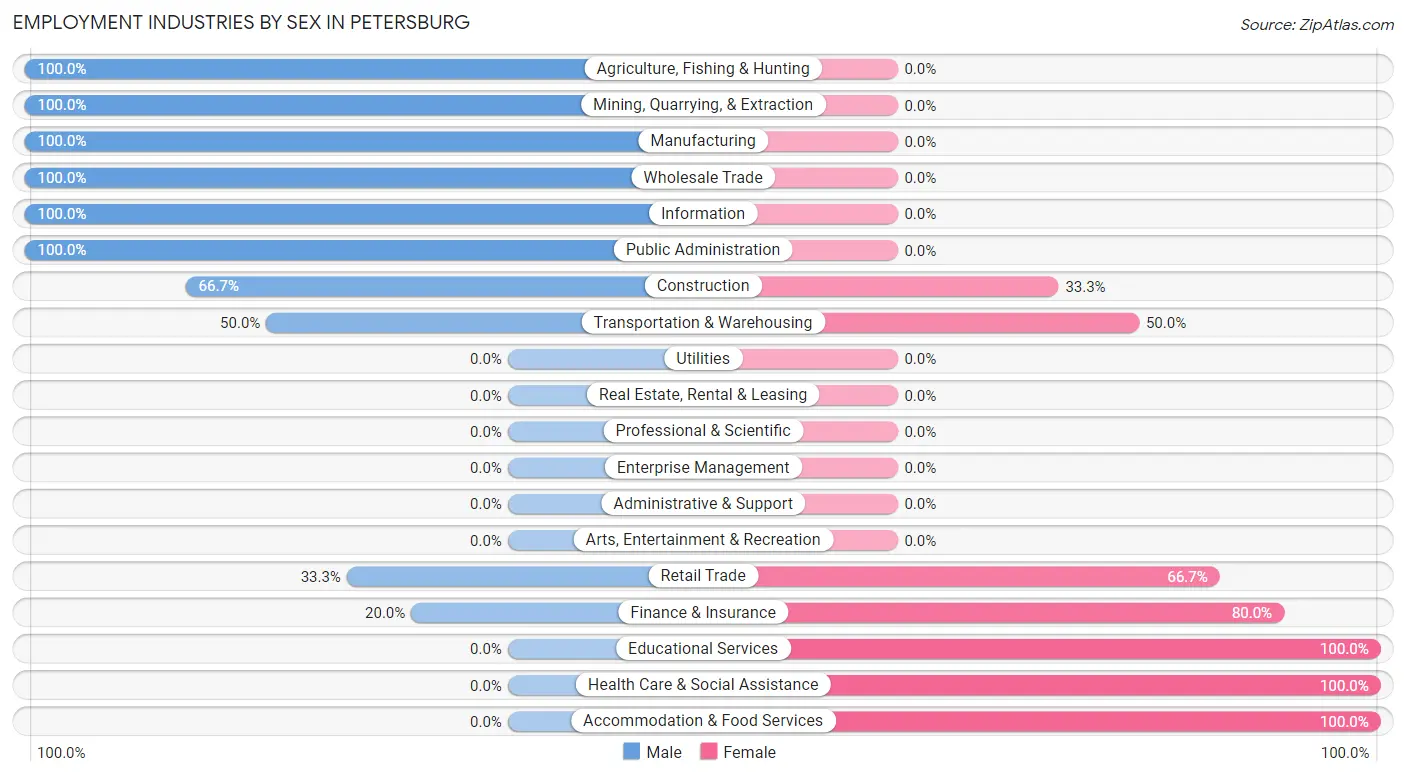
| Industry | Male | Female |
| Agriculture, Fishing & Hunting | 3 (100.0%) | 0 (0.0%) |
| Mining, Quarrying, & Extraction | 1 (100.0%) | 0 (0.0%) |
| Construction | 6 (66.7%) | 3 (33.3%) |
| Manufacturing | 2 (100.0%) | 0 (0.0%) |
| Wholesale Trade | 2 (100.0%) | 0 (0.0%) |
| Retail Trade | 2 (33.3%) | 4 (66.7%) |
| Transportation & Warehousing | 1 (50.0%) | 1 (50.0%) |
| Utilities | 0 (0.0%) | 0 (0.0%) |
| Information | 1 (100.0%) | 0 (0.0%) |
| Finance & Insurance | 1 (20.0%) | 4 (80.0%) |
| Real Estate, Rental & Leasing | 0 (0.0%) | 0 (0.0%) |
| Professional & Scientific | 0 (0.0%) | 0 (0.0%) |
| Enterprise Management | 0 (0.0%) | 0 (0.0%) |
| Administrative & Support | 0 (0.0%) | 0 (0.0%) |
| Educational Services | 0 (0.0%) | 4 (100.0%) |
| Health Care & Social Assistance | 0 (0.0%) | 4 (100.0%) |
| Arts, Entertainment & Recreation | 0 (0.0%) | 0 (0.0%) |
| Accommodation & Food Services | 0 (0.0%) | 2 (100.0%) |
| Public Administration | 6 (100.0%) | 0 (0.0%) |
| Total | 27 (55.1%) | 22 (44.9%) |
Education in Petersburg
School Enrollment in Petersburg
The most common levels of schooling among the 35 students in Petersburg are elementary school (12 | 34.3%), nursery / preschool (9 | 25.7%), and high school (7 | 20.0%).
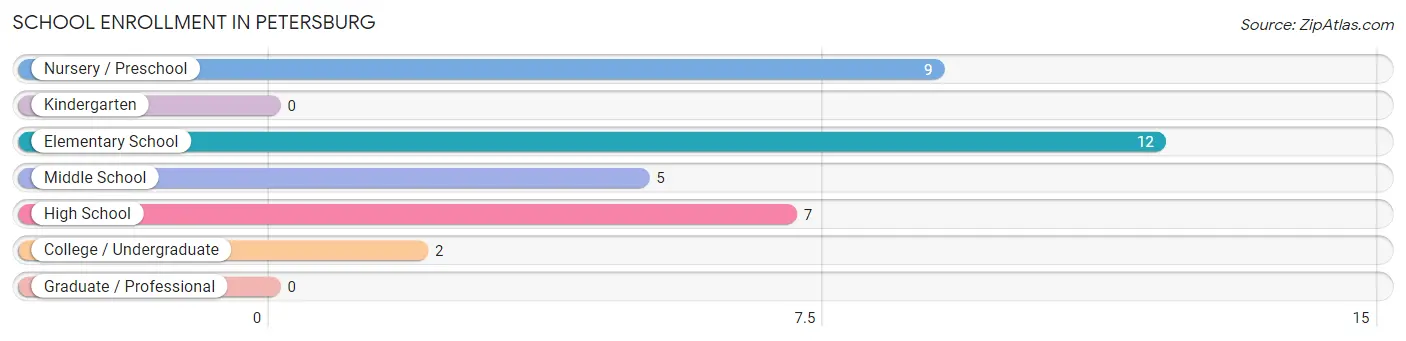
| School Level | # Students | % Students |
| Nursery / Preschool | 9 | 25.7% |
| Kindergarten | 0 | 0.0% |
| Elementary School | 12 | 34.3% |
| Middle School | 5 | 14.3% |
| High School | 7 | 20.0% |
| College / Undergraduate | 2 | 5.7% |
| Graduate / Professional | 0 | 0.0% |
| Total | 35 | 100.0% |
School Enrollment by Age by Funding Source in Petersburg
Out of a total of 35 students who are enrolled in schools in Petersburg, 1 (2.9%) attend a private institution, while the remaining 34 (97.1%) are enrolled in public schools. The age group of 25 to 34 year olds has the highest likelihood of being enrolled in private schools, with 1 (50.0% in the age bracket) enrolled. Conversely, the age group of 5 to 9 year old has the lowest likelihood of being enrolled in a private school, with 19 (100.0% in the age bracket) attending a public institution.
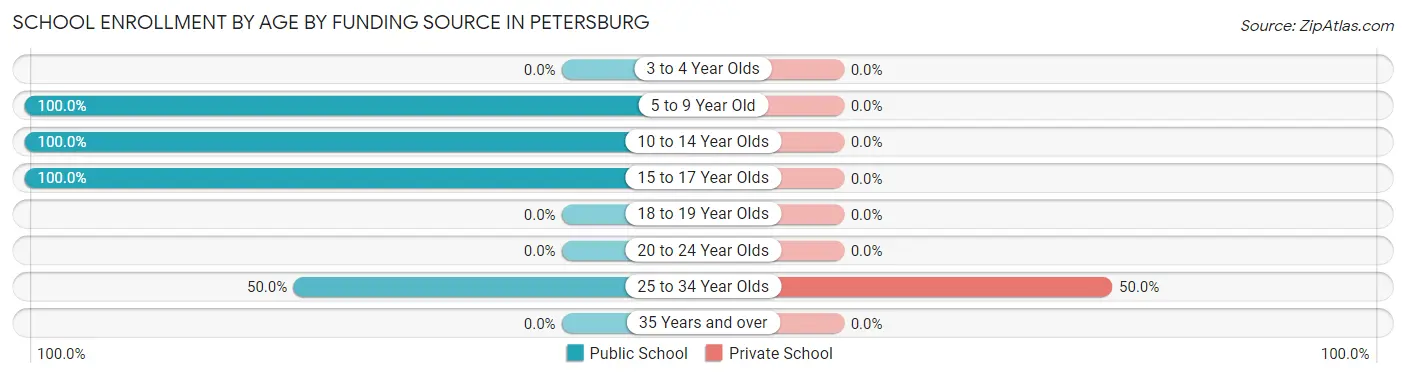
| Age Bracket | Public School | Private School |
| 3 to 4 Year Olds | 0 (0.0%) | 0 (0.0%) |
| 5 to 9 Year Old | 19 (100.0%) | 0 (0.0%) |
| 10 to 14 Year Olds | 7 (100.0%) | 0 (0.0%) |
| 15 to 17 Year Olds | 7 (100.0%) | 0 (0.0%) |
| 18 to 19 Year Olds | 0 (0.0%) | 0 (0.0%) |
| 20 to 24 Year Olds | 0 (0.0%) | 0 (0.0%) |
| 25 to 34 Year Olds | 1 (50.0%) | 1 (50.0%) |
| 35 Years and over | 0 (0.0%) | 0 (0.0%) |
| Total | 34 (97.1%) | 1 (2.9%) |
Educational Attainment by Field of Study in Petersburg
Education (9 | 37.5%), business (8 | 33.3%), physical & health sciences (2 | 8.3%), social sciences (2 | 8.3%), and computers & mathematics (1 | 4.2%) are the most common fields of study among 24 individuals in Petersburg who have obtained a bachelor's degree or higher.
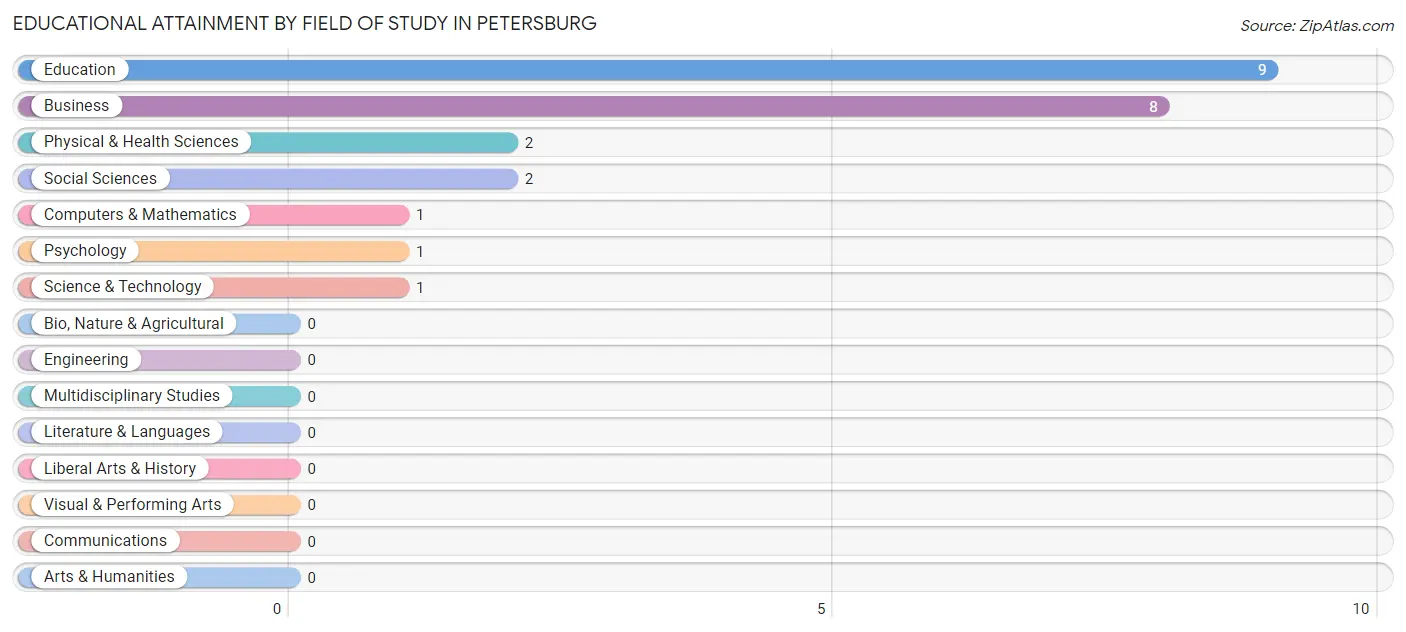
| Field of Study | # Graduates | % Graduates |
| Computers & Mathematics | 1 | 4.2% |
| Bio, Nature & Agricultural | 0 | 0.0% |
| Physical & Health Sciences | 2 | 8.3% |
| Psychology | 1 | 4.2% |
| Social Sciences | 2 | 8.3% |
| Engineering | 0 | 0.0% |
| Multidisciplinary Studies | 0 | 0.0% |
| Science & Technology | 1 | 4.2% |
| Business | 8 | 33.3% |
| Education | 9 | 37.5% |
| Literature & Languages | 0 | 0.0% |
| Liberal Arts & History | 0 | 0.0% |
| Visual & Performing Arts | 0 | 0.0% |
| Communications | 0 | 0.0% |
| Arts & Humanities | 0 | 0.0% |
| Total | 24 | 100.0% |
Transportation & Commute in Petersburg
Vehicle Availability by Sex in Petersburg
The most prevalent vehicle ownership categories in Petersburg are males with 2 vehicles (10, accounting for 35.7%) and females with 2 vehicles (2, making up 45.5%).
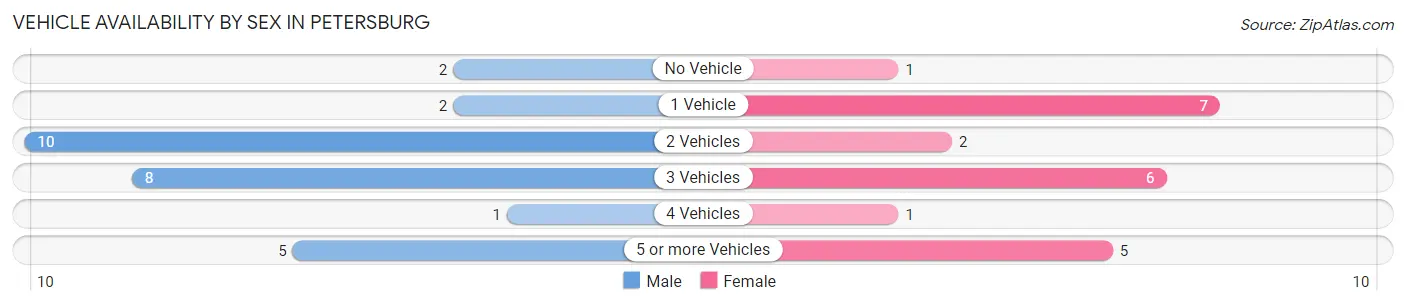
| Vehicles Available | Male | Female |
| No Vehicle | 2 (7.1%) | 1 (4.5%) |
| 1 Vehicle | 2 (7.1%) | 7 (31.8%) |
| 2 Vehicles | 10 (35.7%) | 2 (9.1%) |
| 3 Vehicles | 8 (28.6%) | 6 (27.3%) |
| 4 Vehicles | 1 (3.6%) | 1 (4.5%) |
| 5 or more Vehicles | 5 (17.9%) | 5 (22.7%) |
| Total | 28 (100.0%) | 22 (100.0%) |
Commute Time in Petersburg
The most frequently occuring commute durations in Petersburg are 30 to 34 minutes (10 commuters, 20.4%), 15 to 19 minutes (7 commuters, 14.3%), and 45 to 59 minutes (7 commuters, 14.3%).
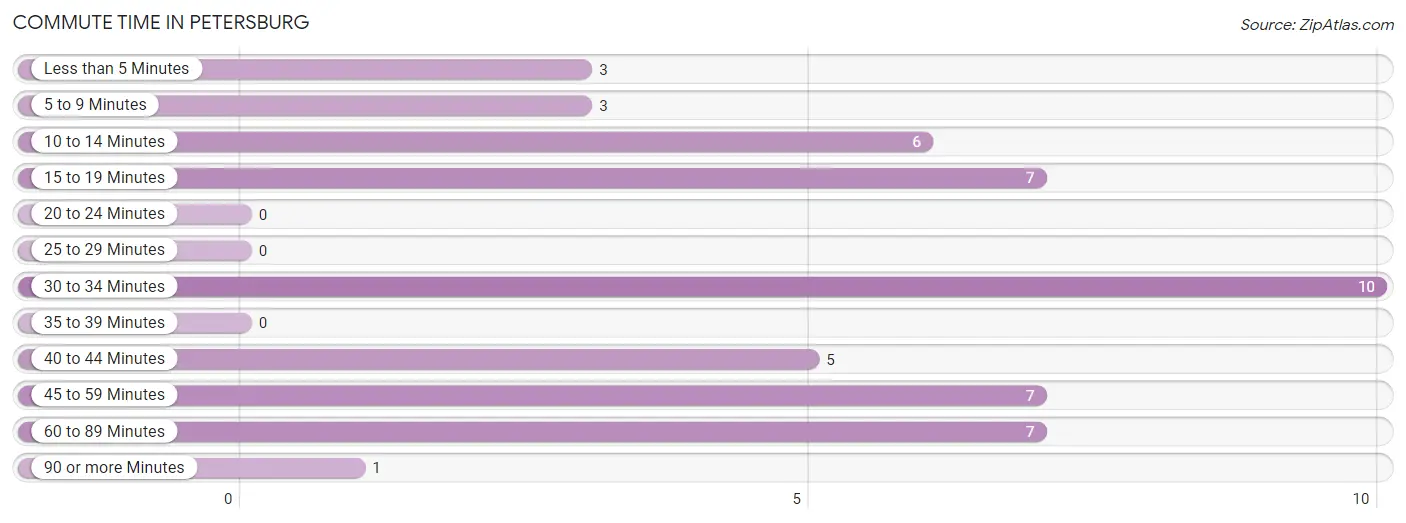
| Commute Time | # Commuters | % Commuters |
| Less than 5 Minutes | 3 | 6.1% |
| 5 to 9 Minutes | 3 | 6.1% |
| 10 to 14 Minutes | 6 | 12.2% |
| 15 to 19 Minutes | 7 | 14.3% |
| 20 to 24 Minutes | 0 | 0.0% |
| 25 to 29 Minutes | 0 | 0.0% |
| 30 to 34 Minutes | 10 | 20.4% |
| 35 to 39 Minutes | 0 | 0.0% |
| 40 to 44 Minutes | 5 | 10.2% |
| 45 to 59 Minutes | 7 | 14.3% |
| 60 to 89 Minutes | 7 | 14.3% |
| 90 or more Minutes | 1 | 2.0% |
Commute Time by Sex in Petersburg
The most common commute times in Petersburg are 30 to 34 minutes (7 commuters, 25.0%) for males and 15 to 19 minutes (4 commuters, 19.1%) for females.
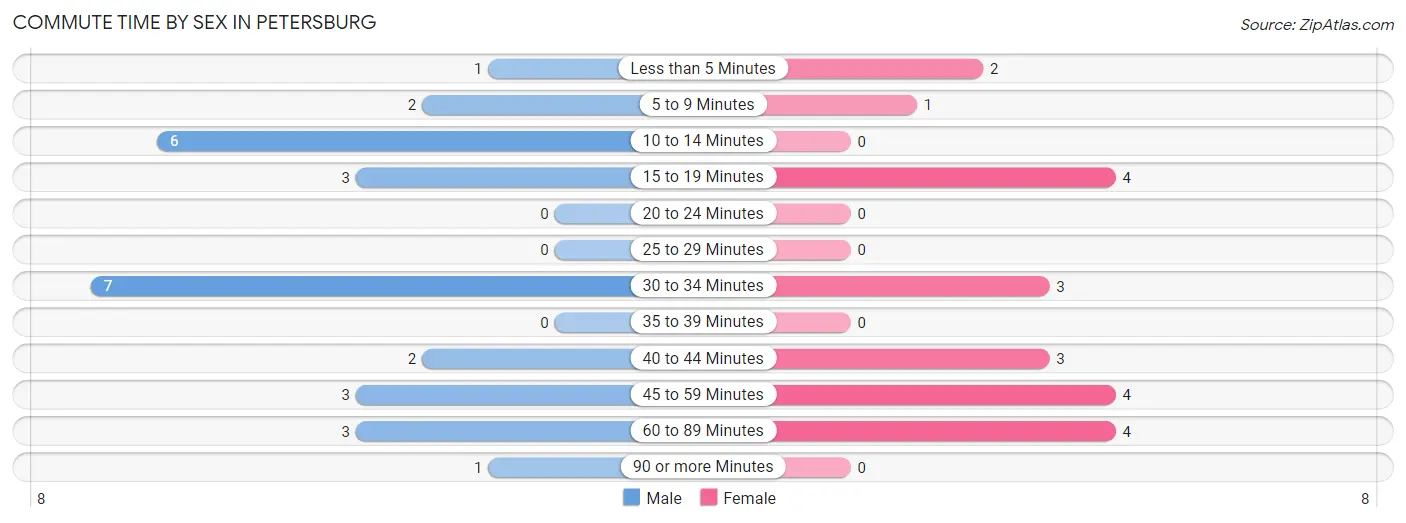
| Commute Time | Male | Female |
| Less than 5 Minutes | 1 (3.6%) | 2 (9.5%) |
| 5 to 9 Minutes | 2 (7.1%) | 1 (4.8%) |
| 10 to 14 Minutes | 6 (21.4%) | 0 (0.0%) |
| 15 to 19 Minutes | 3 (10.7%) | 4 (19.1%) |
| 20 to 24 Minutes | 0 (0.0%) | 0 (0.0%) |
| 25 to 29 Minutes | 0 (0.0%) | 0 (0.0%) |
| 30 to 34 Minutes | 7 (25.0%) | 3 (14.3%) |
| 35 to 39 Minutes | 0 (0.0%) | 0 (0.0%) |
| 40 to 44 Minutes | 2 (7.1%) | 3 (14.3%) |
| 45 to 59 Minutes | 3 (10.7%) | 4 (19.1%) |
| 60 to 89 Minutes | 3 (10.7%) | 4 (19.1%) |
| 90 or more Minutes | 1 (3.6%) | 0 (0.0%) |
Time of Departure to Work by Sex in Petersburg
The most frequent times of departure to work in Petersburg are 6:30 AM to 6:59 AM (8, 28.6%) for males and 7:00 AM to 7:29 AM (7, 33.3%) for females.
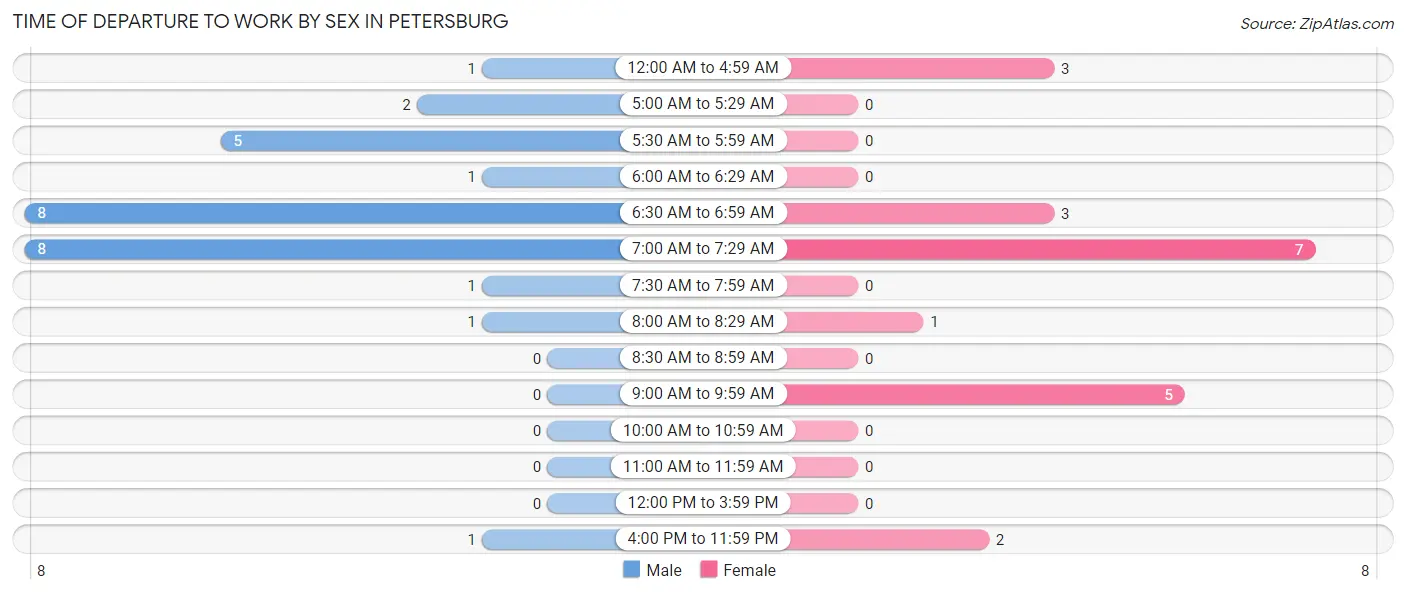
| Time of Departure | Male | Female |
| 12:00 AM to 4:59 AM | 1 (3.6%) | 3 (14.3%) |
| 5:00 AM to 5:29 AM | 2 (7.1%) | 0 (0.0%) |
| 5:30 AM to 5:59 AM | 5 (17.9%) | 0 (0.0%) |
| 6:00 AM to 6:29 AM | 1 (3.6%) | 0 (0.0%) |
| 6:30 AM to 6:59 AM | 8 (28.6%) | 3 (14.3%) |
| 7:00 AM to 7:29 AM | 8 (28.6%) | 7 (33.3%) |
| 7:30 AM to 7:59 AM | 1 (3.6%) | 0 (0.0%) |
| 8:00 AM to 8:29 AM | 1 (3.6%) | 1 (4.8%) |
| 8:30 AM to 8:59 AM | 0 (0.0%) | 0 (0.0%) |
| 9:00 AM to 9:59 AM | 0 (0.0%) | 5 (23.8%) |
| 10:00 AM to 10:59 AM | 0 (0.0%) | 0 (0.0%) |
| 11:00 AM to 11:59 AM | 0 (0.0%) | 0 (0.0%) |
| 12:00 PM to 3:59 PM | 0 (0.0%) | 0 (0.0%) |
| 4:00 PM to 11:59 PM | 1 (3.6%) | 2 (9.5%) |
| Total | 28 (100.0%) | 21 (100.0%) |
Housing Occupancy in Petersburg
Occupancy by Ownership in Petersburg
Of the total 58 dwellings in Petersburg, owner-occupied units account for 54 (93.1%), while renter-occupied units make up 4 (6.9%).
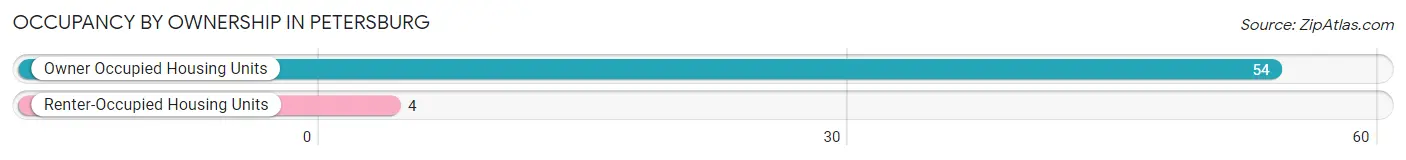
| Occupancy | # Housing Units | % Housing Units |
| Owner Occupied Housing Units | 54 | 93.1% |
| Renter-Occupied Housing Units | 4 | 6.9% |
| Total Occupied Housing Units | 58 | 100.0% |
Occupancy by Household Size in Petersburg
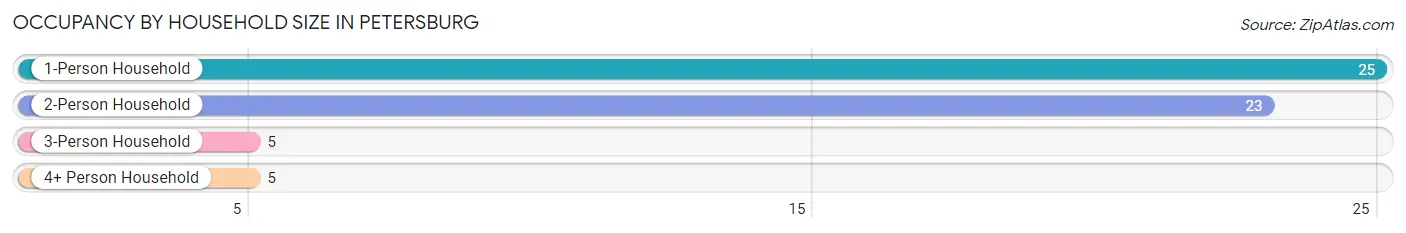
| Household Size | # Housing Units | % Housing Units |
| 1-Person Household | 25 | 43.1% |
| 2-Person Household | 23 | 39.7% |
| 3-Person Household | 5 | 8.6% |
| 4+ Person Household | 5 | 8.6% |
| Total Housing Units | 58 | 100.0% |
Occupancy by Ownership by Household Size in Petersburg
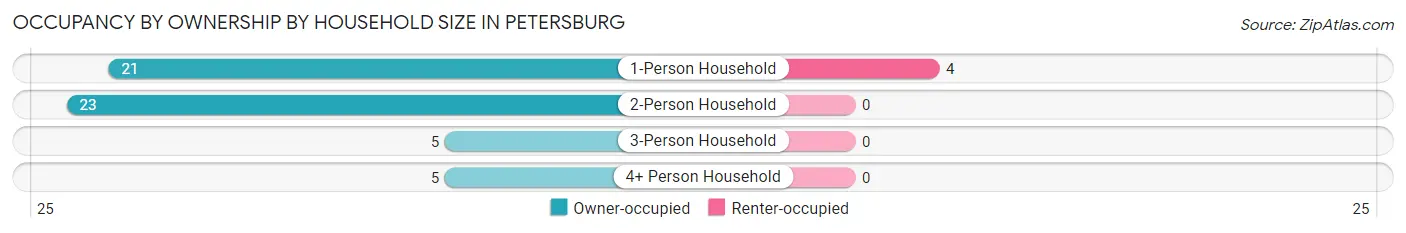
| Household Size | Owner-occupied | Renter-occupied |
| 1-Person Household | 21 (84.0%) | 4 (16.0%) |
| 2-Person Household | 23 (100.0%) | 0 (0.0%) |
| 3-Person Household | 5 (100.0%) | 0 (0.0%) |
| 4+ Person Household | 5 (100.0%) | 0 (0.0%) |
| Total Housing Units | 54 (93.1%) | 4 (6.9%) |
Occupancy by Educational Attainment in Petersburg
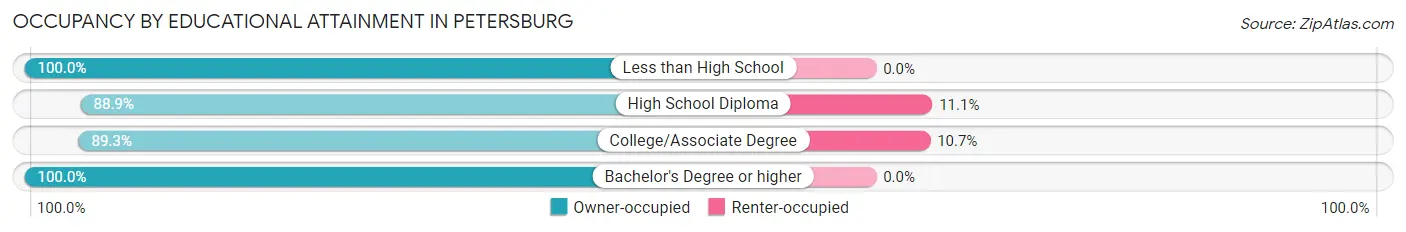
| Household Size | Owner-occupied | Renter-occupied |
| Less than High School | 3 (100.0%) | 0 (0.0%) |
| High School Diploma | 8 (88.9%) | 1 (11.1%) |
| College/Associate Degree | 25 (89.3%) | 3 (10.7%) |
| Bachelor's Degree or higher | 18 (100.0%) | 0 (0.0%) |
Occupancy by Age of Householder in Petersburg
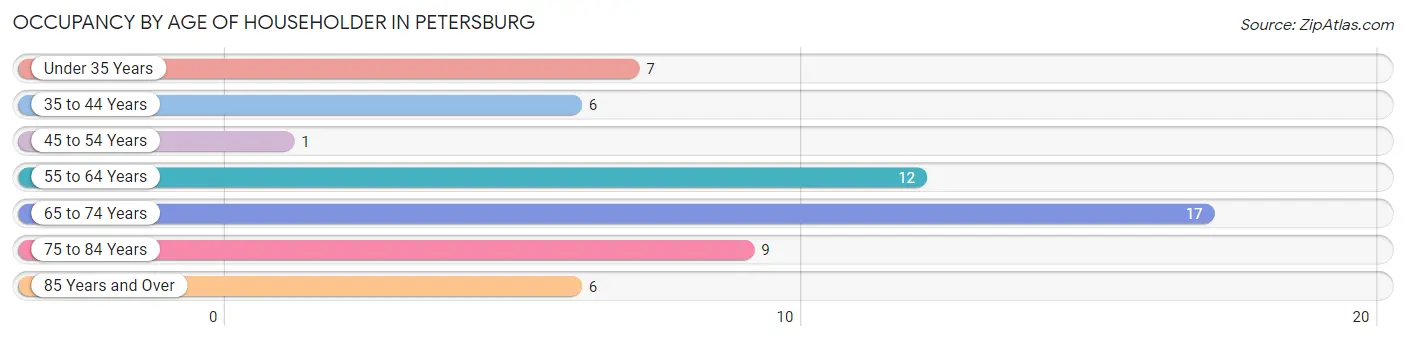
| Age Bracket | # Households | % Households |
| Under 35 Years | 7 | 12.1% |
| 35 to 44 Years | 6 | 10.3% |
| 45 to 54 Years | 1 | 1.7% |
| 55 to 64 Years | 12 | 20.7% |
| 65 to 74 Years | 17 | 29.3% |
| 75 to 84 Years | 9 | 15.5% |
| 85 Years and Over | 6 | 10.3% |
| Total | 58 | 100.0% |
Housing Finances in Petersburg
Median Income by Occupancy in Petersburg
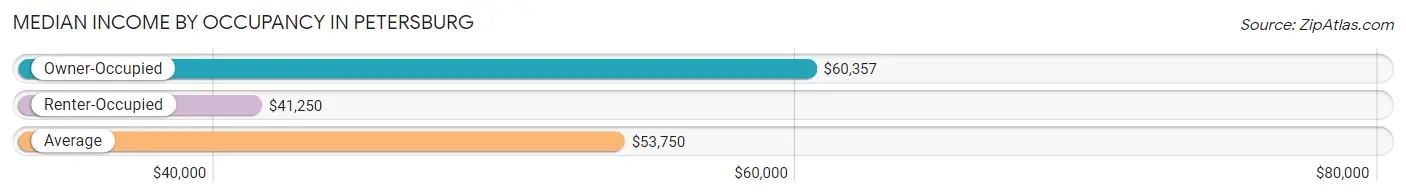
| Occupancy Type | # Households | Median Income |
| Owner-Occupied | 54 (93.1%) | $60,357 |
| Renter-Occupied | 4 (6.9%) | $41,250 |
| Average | 58 (100.0%) | $53,750 |
Occupancy by Householder Income Bracket in Petersburg
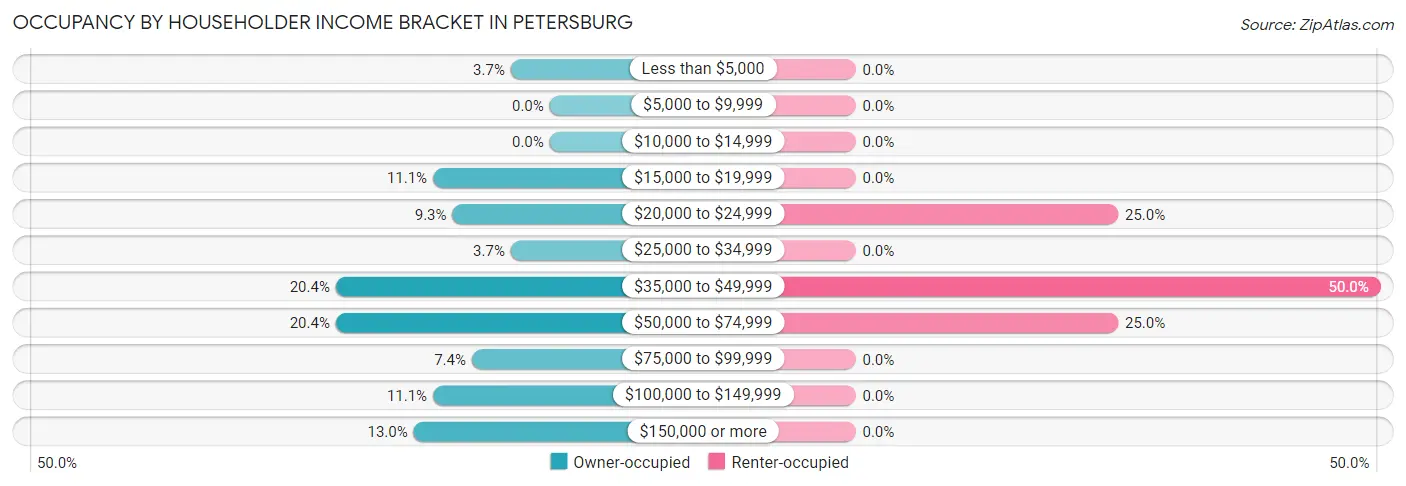
| Income Bracket | Owner-occupied | Renter-occupied |
| Less than $5,000 | 2 (3.7%) | 0 (0.0%) |
| $5,000 to $9,999 | 0 (0.0%) | 0 (0.0%) |
| $10,000 to $14,999 | 0 (0.0%) | 0 (0.0%) |
| $15,000 to $19,999 | 6 (11.1%) | 0 (0.0%) |
| $20,000 to $24,999 | 5 (9.3%) | 1 (25.0%) |
| $25,000 to $34,999 | 2 (3.7%) | 0 (0.0%) |
| $35,000 to $49,999 | 11 (20.4%) | 2 (50.0%) |
| $50,000 to $74,999 | 11 (20.4%) | 1 (25.0%) |
| $75,000 to $99,999 | 4 (7.4%) | 0 (0.0%) |
| $100,000 to $149,999 | 6 (11.1%) | 0 (0.0%) |
| $150,000 or more | 7 (13.0%) | 0 (0.0%) |
| Total | 54 (100.0%) | 4 (100.0%) |
Monthly Housing Cost Tiers in Petersburg
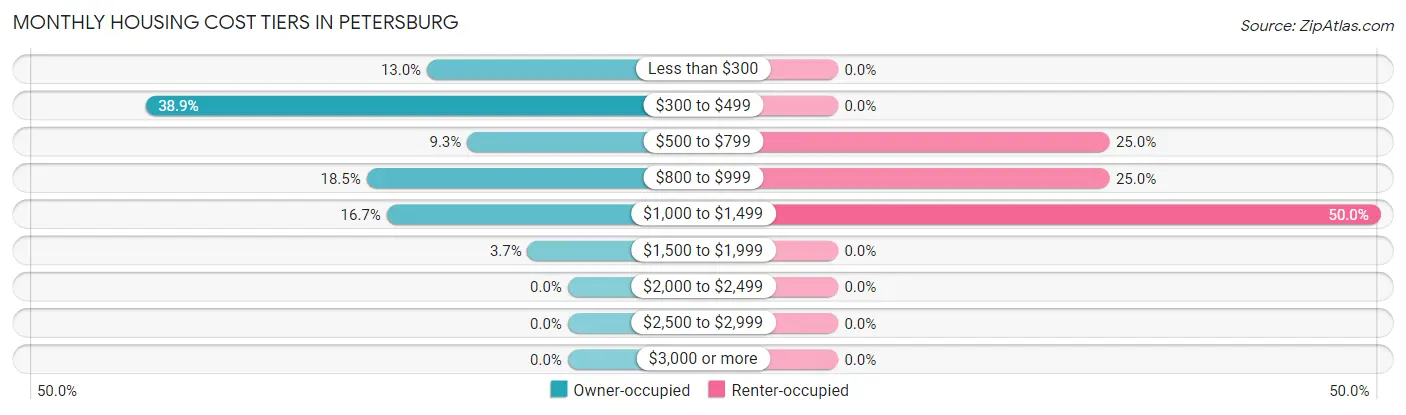
| Monthly Cost | Owner-occupied | Renter-occupied |
| Less than $300 | 7 (13.0%) | 0 (0.0%) |
| $300 to $499 | 21 (38.9%) | 0 (0.0%) |
| $500 to $799 | 5 (9.3%) | 1 (25.0%) |
| $800 to $999 | 10 (18.5%) | 1 (25.0%) |
| $1,000 to $1,499 | 9 (16.7%) | 2 (50.0%) |
| $1,500 to $1,999 | 2 (3.7%) | 0 (0.0%) |
| $2,000 to $2,499 | 0 (0.0%) | 0 (0.0%) |
| $2,500 to $2,999 | 0 (0.0%) | 0 (0.0%) |
| $3,000 or more | 0 (0.0%) | 0 (0.0%) |
| Total | 54 (100.0%) | 4 (100.0%) |
Physical Housing Characteristics in Petersburg
Housing Structures in Petersburg
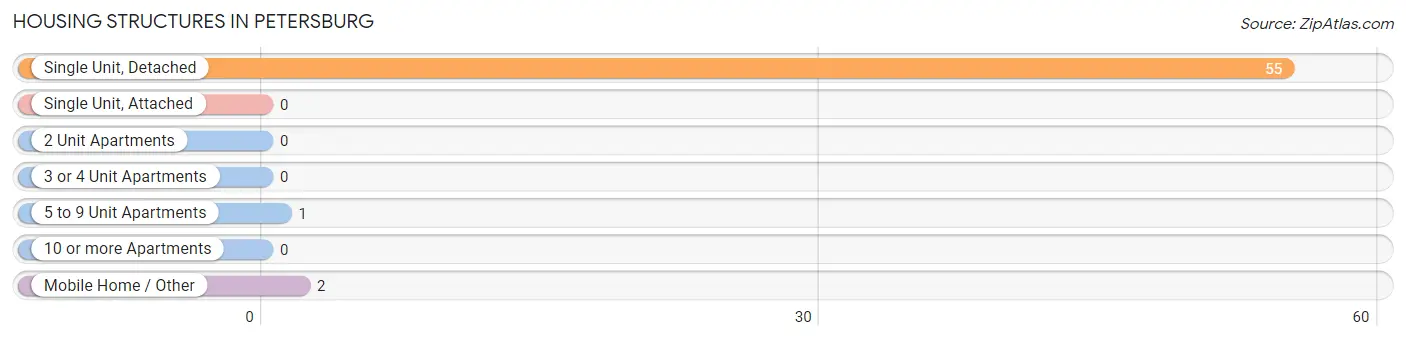
| Structure Type | # Housing Units | % Housing Units |
| Single Unit, Detached | 55 | 94.8% |
| Single Unit, Attached | 0 | 0.0% |
| 2 Unit Apartments | 0 | 0.0% |
| 3 or 4 Unit Apartments | 0 | 0.0% |
| 5 to 9 Unit Apartments | 1 | 1.7% |
| 10 or more Apartments | 0 | 0.0% |
| Mobile Home / Other | 2 | 3.5% |
| Total | 58 | 100.0% |
Housing Structures by Occupancy in Petersburg
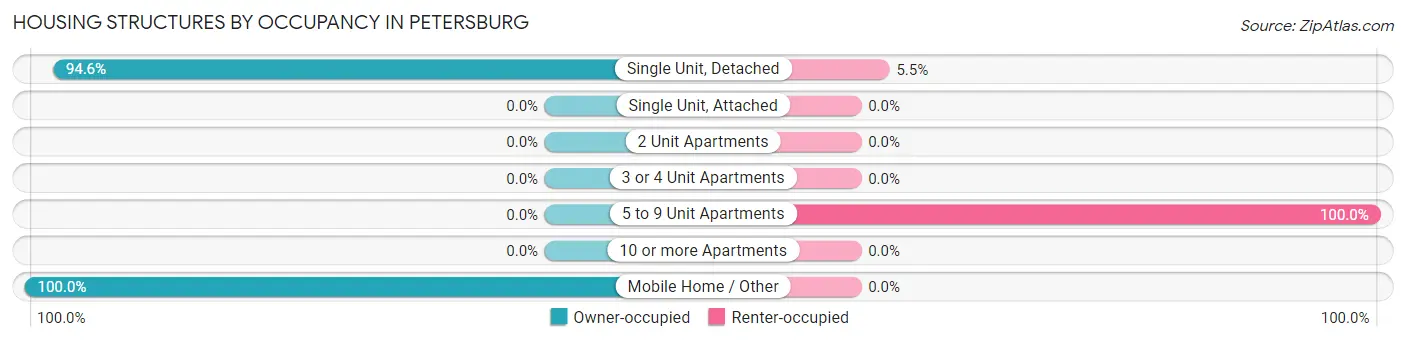
| Structure Type | Owner-occupied | Renter-occupied |
| Single Unit, Detached | 52 (94.6%) | 3 (5.4%) |
| Single Unit, Attached | 0 (0.0%) | 0 (0.0%) |
| 2 Unit Apartments | 0 (0.0%) | 0 (0.0%) |
| 3 or 4 Unit Apartments | 0 (0.0%) | 0 (0.0%) |
| 5 to 9 Unit Apartments | 0 (0.0%) | 1 (100.0%) |
| 10 or more Apartments | 0 (0.0%) | 0 (0.0%) |
| Mobile Home / Other | 2 (100.0%) | 0 (0.0%) |
| Total | 54 (93.1%) | 4 (6.9%) |
Housing Structures by Number of Rooms in Petersburg
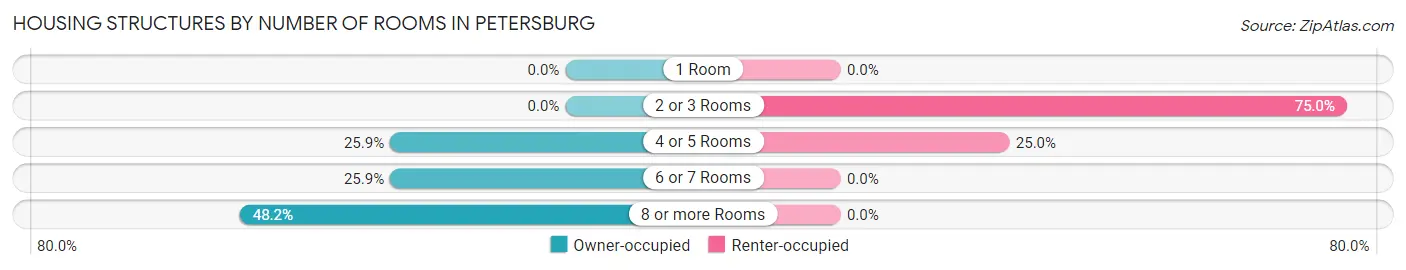
| Number of Rooms | Owner-occupied | Renter-occupied |
| 1 Room | 0 (0.0%) | 0 (0.0%) |
| 2 or 3 Rooms | 0 (0.0%) | 3 (75.0%) |
| 4 or 5 Rooms | 14 (25.9%) | 1 (25.0%) |
| 6 or 7 Rooms | 14 (25.9%) | 0 (0.0%) |
| 8 or more Rooms | 26 (48.1%) | 0 (0.0%) |
| Total | 54 (100.0%) | 4 (100.0%) |
Housing Structure by Heating Type in Petersburg
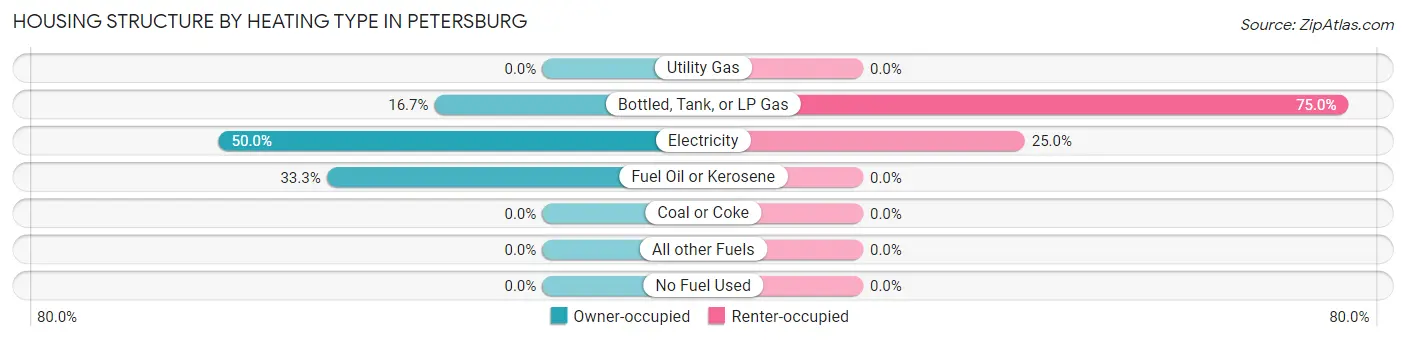
| Heating Type | Owner-occupied | Renter-occupied |
| Utility Gas | 0 (0.0%) | 0 (0.0%) |
| Bottled, Tank, or LP Gas | 9 (16.7%) | 3 (75.0%) |
| Electricity | 27 (50.0%) | 1 (25.0%) |
| Fuel Oil or Kerosene | 18 (33.3%) | 0 (0.0%) |
| Coal or Coke | 0 (0.0%) | 0 (0.0%) |
| All other Fuels | 0 (0.0%) | 0 (0.0%) |
| No Fuel Used | 0 (0.0%) | 0 (0.0%) |
| Total | 54 (100.0%) | 4 (100.0%) |
Household Vehicle Usage in Petersburg
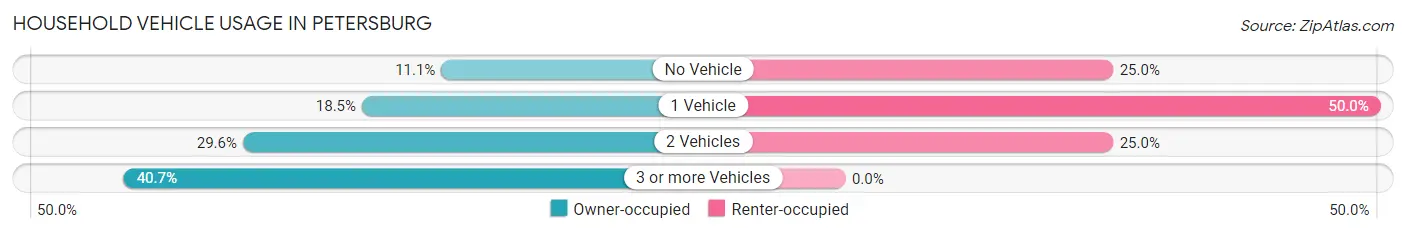
| Vehicles per Household | Owner-occupied | Renter-occupied |
| No Vehicle | 6 (11.1%) | 1 (25.0%) |
| 1 Vehicle | 10 (18.5%) | 2 (50.0%) |
| 2 Vehicles | 16 (29.6%) | 1 (25.0%) |
| 3 or more Vehicles | 22 (40.7%) | 0 (0.0%) |
| Total | 54 (100.0%) | 4 (100.0%) |
Real Estate & Mortgages in Petersburg
Real Estate and Mortgage Overview in Petersburg
| Characteristic | Without Mortgage | With Mortgage |
| Housing Units | 38 | 16 |
| Median Property Value | $90,000 | $117,900 |
| Median Household Income | $43,750 | $6 |
| Monthly Housing Costs | $375 | $0 |
| Real Estate Taxes | $508 | $0 |
Property Value by Mortgage Status in Petersburg
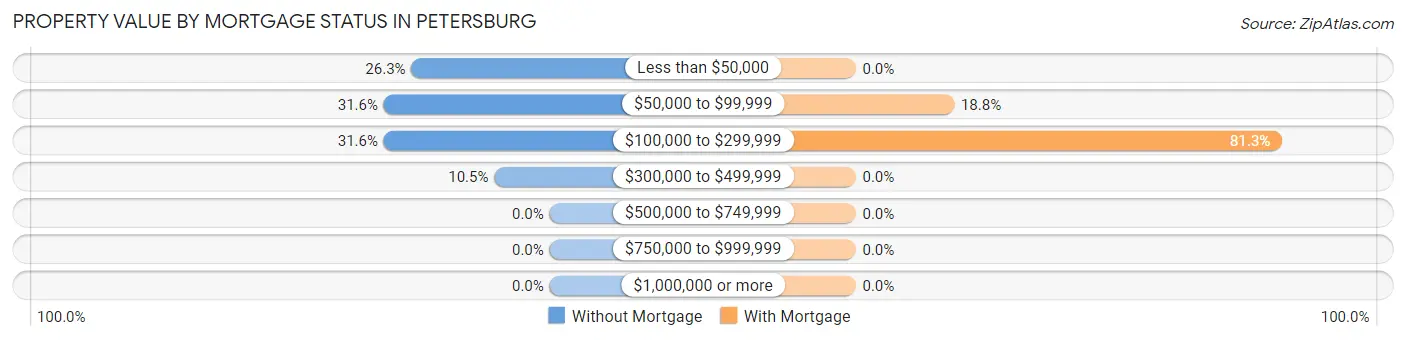
| Property Value | Without Mortgage | With Mortgage |
| Less than $50,000 | 10 (26.3%) | 0 (0.0%) |
| $50,000 to $99,999 | 12 (31.6%) | 3 (18.8%) |
| $100,000 to $299,999 | 12 (31.6%) | 13 (81.2%) |
| $300,000 to $499,999 | 4 (10.5%) | 0 (0.0%) |
| $500,000 to $749,999 | 0 (0.0%) | 0 (0.0%) |
| $750,000 to $999,999 | 0 (0.0%) | 0 (0.0%) |
| $1,000,000 or more | 0 (0.0%) | 0 (0.0%) |
| Total | 38 (100.0%) | 16 (100.0%) |
Household Income by Mortgage Status in Petersburg
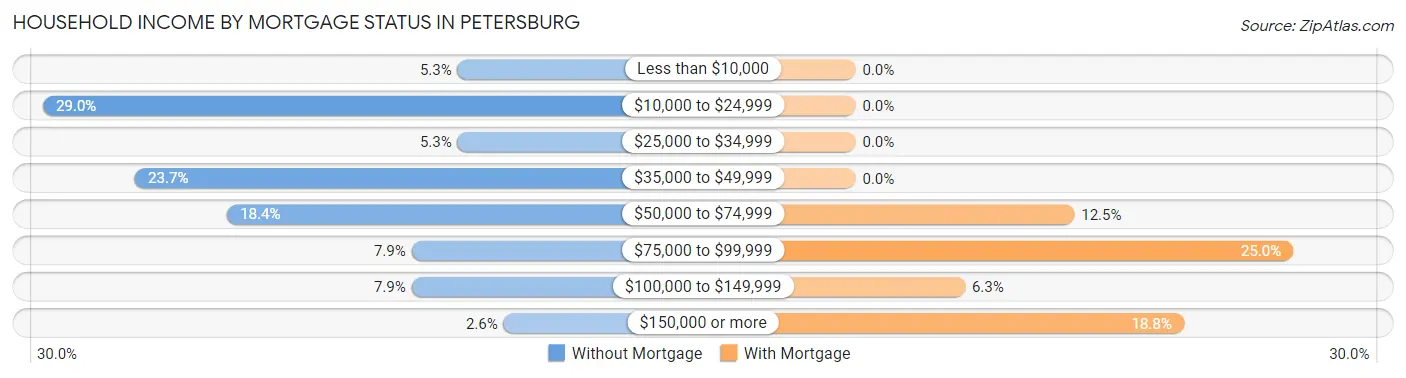
| Household Income | Without Mortgage | With Mortgage |
| Less than $10,000 | 2 (5.3%) | 0 (0.0%) |
| $10,000 to $24,999 | 11 (28.9%) | 0 (0.0%) |
| $25,000 to $34,999 | 2 (5.3%) | 0 (0.0%) |
| $35,000 to $49,999 | 9 (23.7%) | 0 (0.0%) |
| $50,000 to $74,999 | 7 (18.4%) | 2 (12.5%) |
| $75,000 to $99,999 | 3 (7.9%) | 4 (25.0%) |
| $100,000 to $149,999 | 3 (7.9%) | 1 (6.2%) |
| $150,000 or more | 1 (2.6%) | 3 (18.8%) |
| Total | 38 (100.0%) | 16 (100.0%) |
Property Value to Household Income Ratio in Petersburg
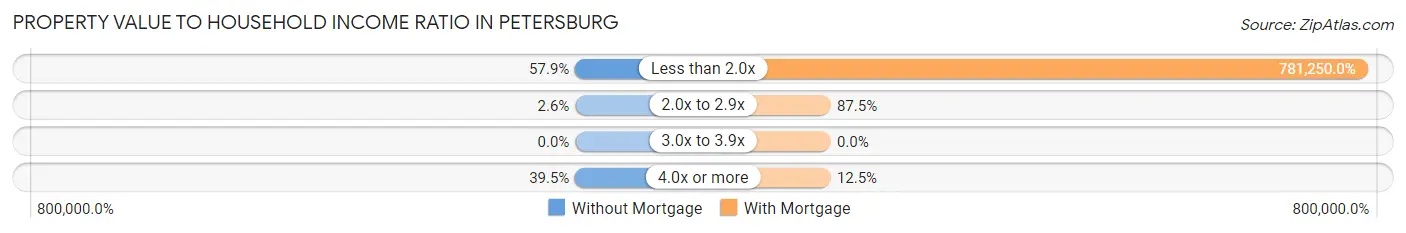
| Value-to-Income Ratio | Without Mortgage | With Mortgage |
| Less than 2.0x | 22 (57.9%) | 125,000 (781,250.0%) |
| 2.0x to 2.9x | 1 (2.6%) | 14 (87.5%) |
| 3.0x to 3.9x | 0 (0.0%) | 0 (0.0%) |
| 4.0x or more | 15 (39.5%) | 2 (12.5%) |
| Total | 38 (100.0%) | 16 (100.0%) |
Real Estate Taxes by Mortgage Status in Petersburg
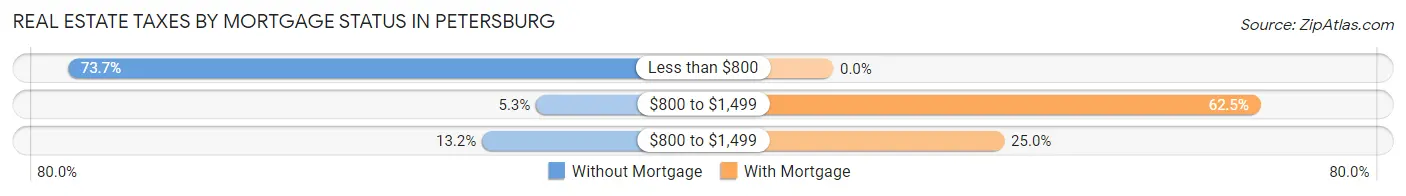
| Property Taxes | Without Mortgage | With Mortgage |
| Less than $800 | 28 (73.7%) | 0 (0.0%) |
| $800 to $1,499 | 2 (5.3%) | 10 (62.5%) |
| $800 to $1,499 | 5 (13.2%) | 4 (25.0%) |
| Total | 38 (100.0%) | 16 (100.0%) |
Health & Disability in Petersburg
Health Insurance Coverage by Age in Petersburg
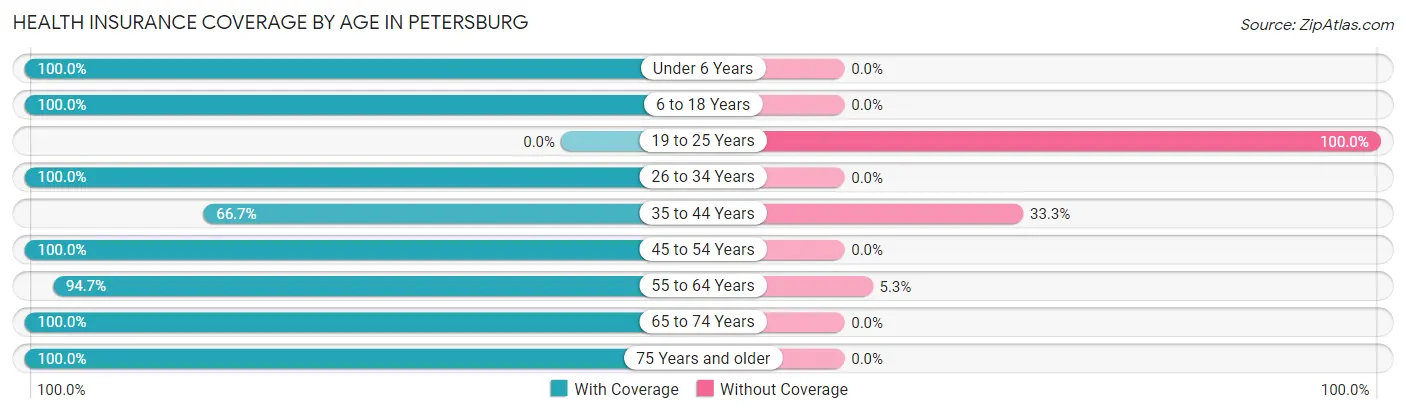
| Age Bracket | With Coverage | Without Coverage |
| Under 6 Years | 11 (100.0%) | 0 (0.0%) |
| 6 to 18 Years | 24 (100.0%) | 0 (0.0%) |
| 19 to 25 Years | 0 (0.0%) | 1 (100.0%) |
| 26 to 34 Years | 10 (100.0%) | 0 (0.0%) |
| 35 to 44 Years | 8 (66.7%) | 4 (33.3%) |
| 45 to 54 Years | 2 (100.0%) | 0 (0.0%) |
| 55 to 64 Years | 18 (94.7%) | 1 (5.3%) |
| 65 to 74 Years | 35 (100.0%) | 0 (0.0%) |
| 75 Years and older | 16 (100.0%) | 0 (0.0%) |
| Total | 124 (95.4%) | 6 (4.6%) |
Health Insurance Coverage by Citizenship Status in Petersburg
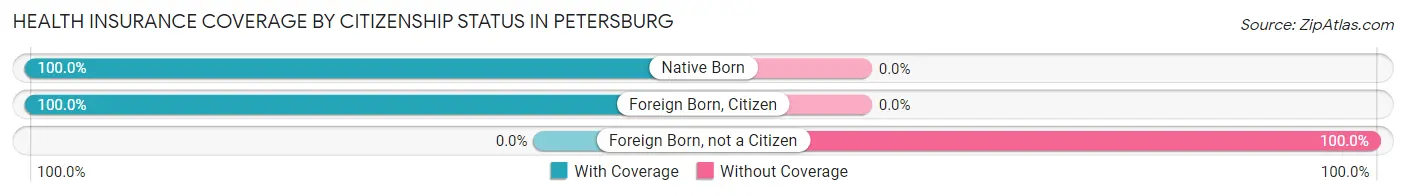
| Citizenship Status | With Coverage | Without Coverage |
| Native Born | 11 (100.0%) | 0 (0.0%) |
| Foreign Born, Citizen | 24 (100.0%) | 0 (0.0%) |
| Foreign Born, not a Citizen | 0 (0.0%) | 1 (100.0%) |
Health Insurance Coverage by Household Income in Petersburg
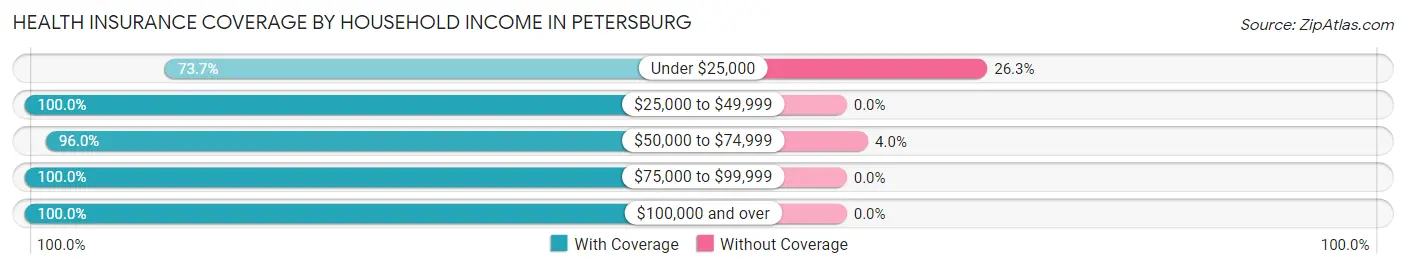
| Household Income | With Coverage | Without Coverage |
| Under $25,000 | 14 (73.7%) | 5 (26.3%) |
| $25,000 to $49,999 | 22 (100.0%) | 0 (0.0%) |
| $50,000 to $74,999 | 24 (96.0%) | 1 (4.0%) |
| $75,000 to $99,999 | 13 (100.0%) | 0 (0.0%) |
| $100,000 and over | 51 (100.0%) | 0 (0.0%) |
Public vs Private Health Insurance Coverage by Age in Petersburg
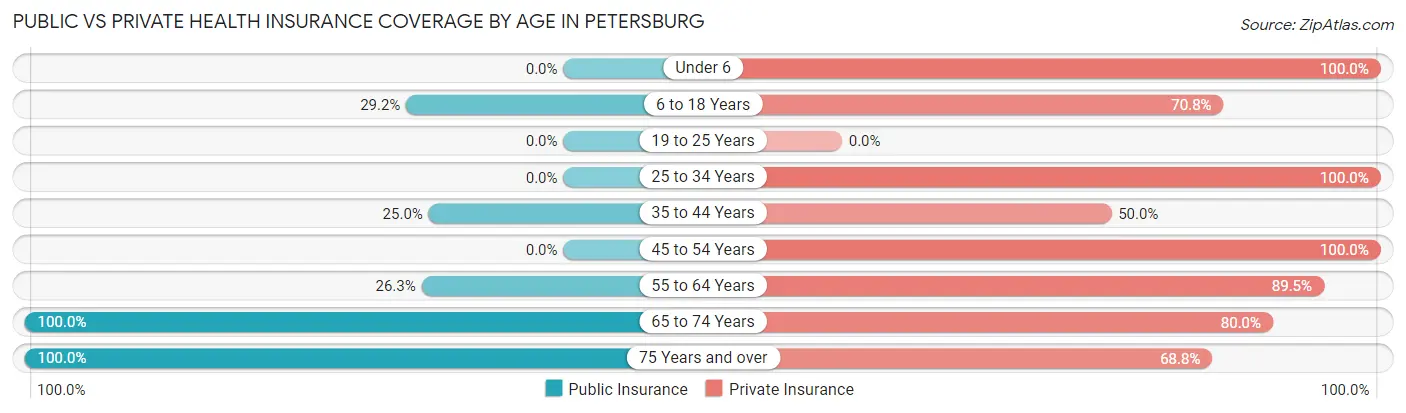
| Age Bracket | Public Insurance | Private Insurance |
| Under 6 | 0 (0.0%) | 11 (100.0%) |
| 6 to 18 Years | 7 (29.2%) | 17 (70.8%) |
| 19 to 25 Years | 0 (0.0%) | 0 (0.0%) |
| 25 to 34 Years | 0 (0.0%) | 10 (100.0%) |
| 35 to 44 Years | 3 (25.0%) | 6 (50.0%) |
| 45 to 54 Years | 0 (0.0%) | 2 (100.0%) |
| 55 to 64 Years | 5 (26.3%) | 17 (89.5%) |
| 65 to 74 Years | 35 (100.0%) | 28 (80.0%) |
| 75 Years and over | 16 (100.0%) | 11 (68.8%) |
| Total | 66 (50.8%) | 102 (78.5%) |
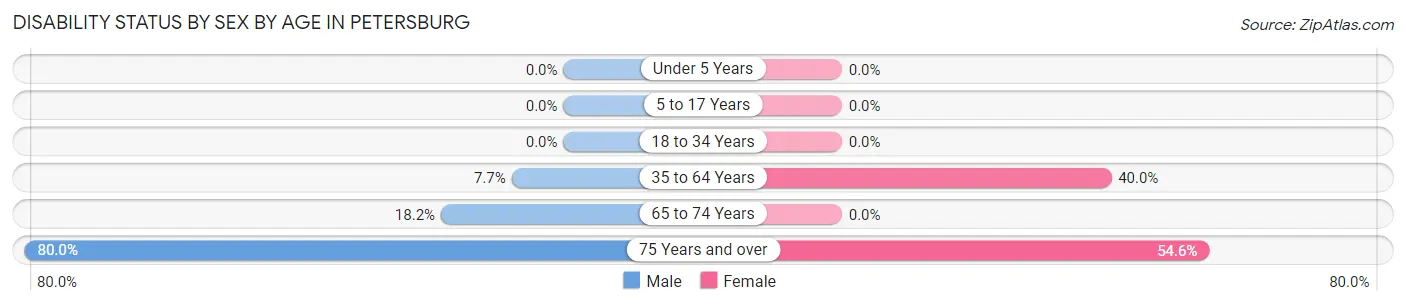
Disability Status by Sex by Age in Petersburg
| Age Bracket | Male | Female |
| Under 5 Years | 0 (0.0%) | 0 (0.0%) |
| 5 to 17 Years | 0 (0.0%) | 0 (0.0%) |
| 18 to 34 Years | 0 (0.0%) | 0 (0.0%) |
| 35 to 64 Years | 1 (7.7%) | 8 (40.0%) |
| 65 to 74 Years | 4 (18.2%) | 0 (0.0%) |
| 75 Years and over | 4 (80.0%) | 6 (54.5%) |
Disability Class by Sex by Age in Petersburg
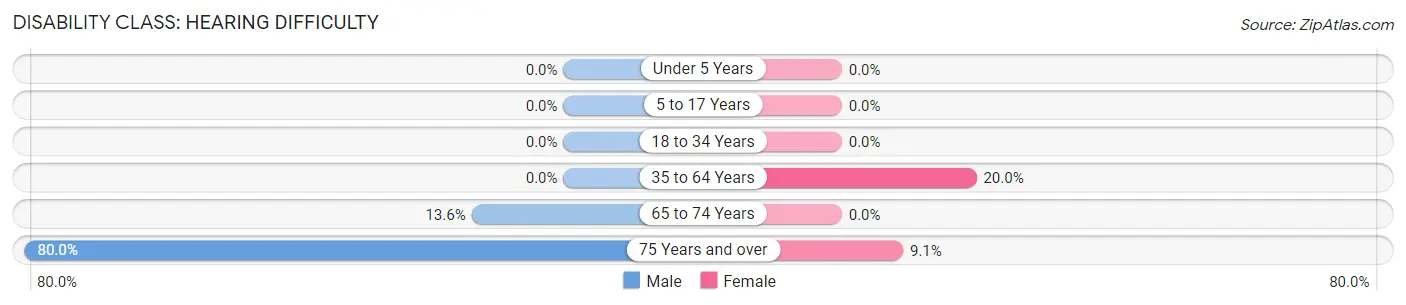
Disability Class: Hearing Difficulty
| Age Bracket | Male | Female |
| Under 5 Years | 0 (0.0%) | 0 (0.0%) |
| 5 to 17 Years | 0 (0.0%) | 0 (0.0%) |
| 18 to 34 Years | 0 (0.0%) | 0 (0.0%) |
| 35 to 64 Years | 0 (0.0%) | 4 (20.0%) |
| 65 to 74 Years | 3 (13.6%) | 0 (0.0%) |
| 75 Years and over | 4 (80.0%) | 1 (9.1%) |
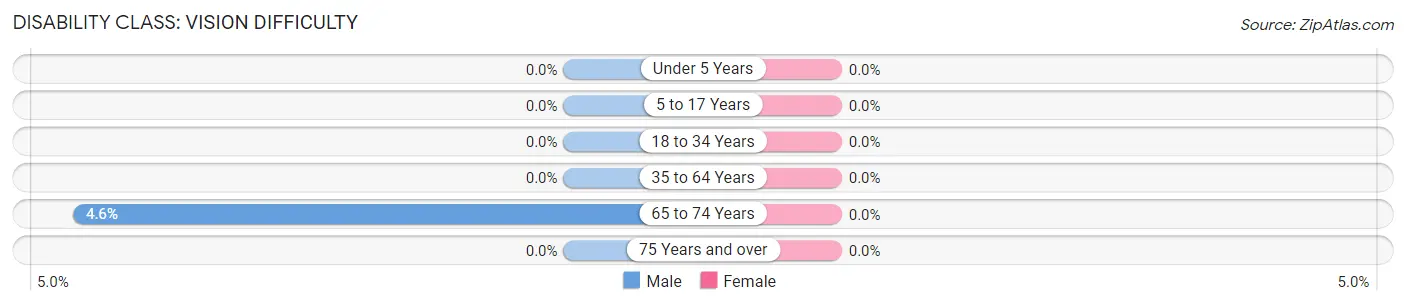
Disability Class: Vision Difficulty
| Age Bracket | Male | Female |
| Under 5 Years | 0 (0.0%) | 0 (0.0%) |
| 5 to 17 Years | 0 (0.0%) | 0 (0.0%) |
| 18 to 34 Years | 0 (0.0%) | 0 (0.0%) |
| 35 to 64 Years | 0 (0.0%) | 0 (0.0%) |
| 65 to 74 Years | 1 (4.5%) | 0 (0.0%) |
| 75 Years and over | 0 (0.0%) | 0 (0.0%) |
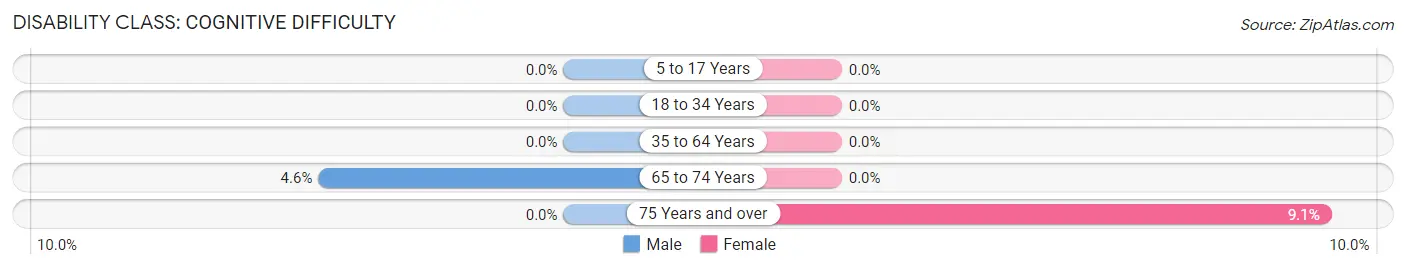
Disability Class: Cognitive Difficulty
| Age Bracket | Male | Female |
| 5 to 17 Years | 0 (0.0%) | 0 (0.0%) |
| 18 to 34 Years | 0 (0.0%) | 0 (0.0%) |
| 35 to 64 Years | 0 (0.0%) | 0 (0.0%) |
| 65 to 74 Years | 1 (4.5%) | 0 (0.0%) |
| 75 Years and over | 0 (0.0%) | 1 (9.1%) |
Disability Class: Ambulatory Difficulty
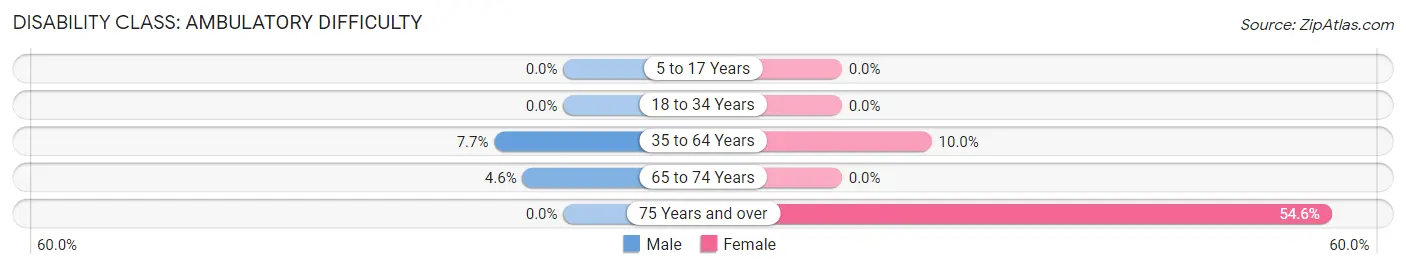
| Age Bracket | Male | Female |
| 5 to 17 Years | 0 (0.0%) | 0 (0.0%) |
| 18 to 34 Years | 0 (0.0%) | 0 (0.0%) |
| 35 to 64 Years | 1 (7.7%) | 2 (10.0%) |
| 65 to 74 Years | 1 (4.5%) | 0 (0.0%) |
| 75 Years and over | 0 (0.0%) | 6 (54.5%) |
Disability Class: Self-Care Difficulty
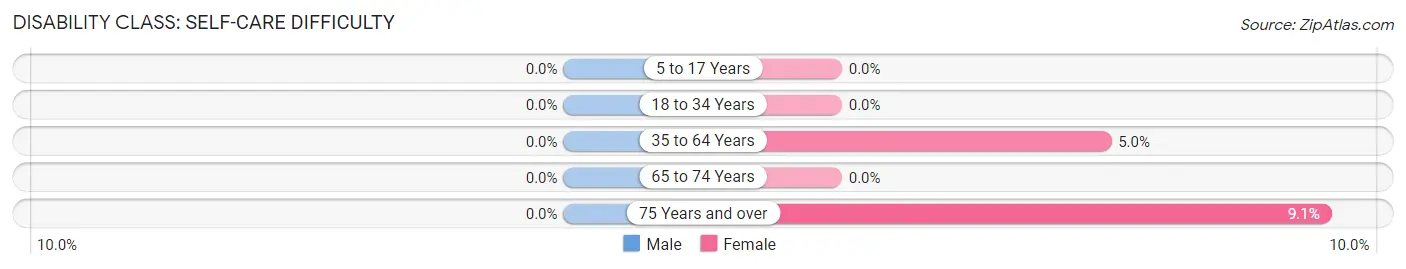
| Age Bracket | Male | Female |
| 5 to 17 Years | 0 (0.0%) | 0 (0.0%) |
| 18 to 34 Years | 0 (0.0%) | 0 (0.0%) |
| 35 to 64 Years | 0 (0.0%) | 1 (5.0%) |
| 65 to 74 Years | 0 (0.0%) | 0 (0.0%) |
| 75 Years and over | 0 (0.0%) | 1 (9.1%) |
Technology Access in Petersburg
Computing Device Access in Petersburg
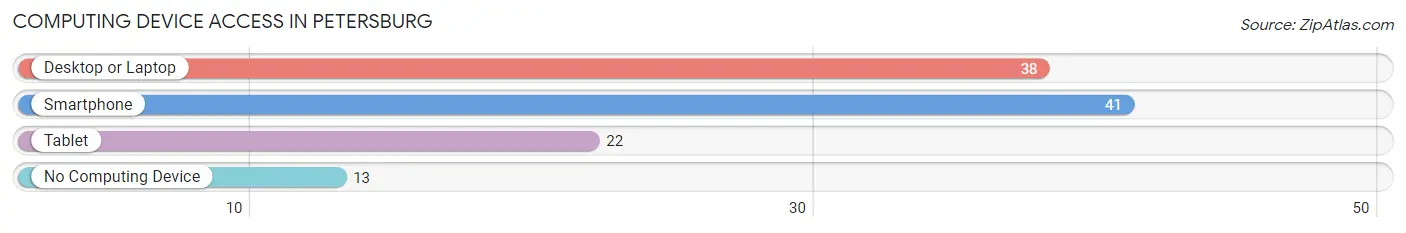
| Device Type | # Households | % Households |
| Desktop or Laptop | 38 | 65.5% |
| Smartphone | 41 | 70.7% |
| Tablet | 22 | 37.9% |
| No Computing Device | 13 | 22.4% |
| Total | 58 | 100.0% |
Internet Access in Petersburg
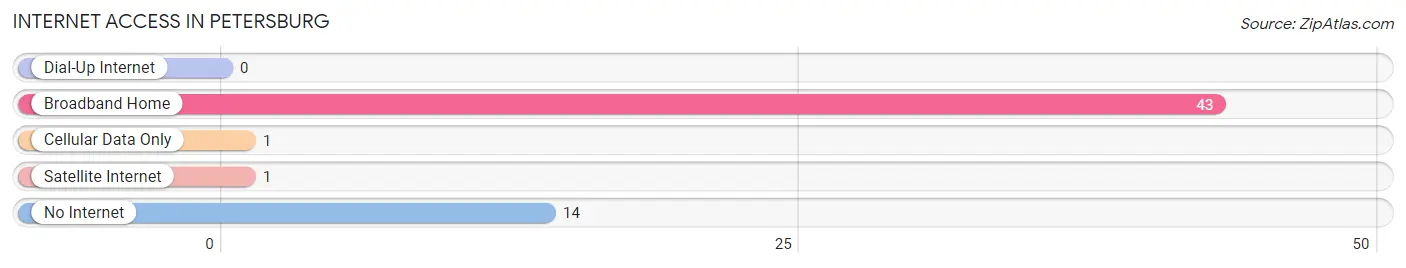
| Internet Type | # Households | % Households |
| Dial-Up Internet | 0 | 0.0% |
| Broadband Home | 43 | 74.1% |
| Cellular Data Only | 1 | 1.7% |
| Satellite Internet | 1 | 1.7% |
| No Internet | 14 | 24.1% |
| Total | 58 | 100.0% |
Petersburg Summary
Petersburg is a small city located in Walsh County, North Dakota, United States. It is situated on the banks of the Red River of the North, approximately 20 miles south of the Canadian border. The city was founded in 1882 and was named after Peter Peterson, a local settler. As of the 2010 census, the population of Petersburg was 545.
Geography
Petersburg is located at the intersection of U.S. Route 81 and North Dakota State Highway 18. It is situated on the banks of the Red River of the North, approximately 20 miles south of the Canadian border. The city is located in the Red River Valley, a flat, fertile region of the Great Plains. The city is surrounded by agricultural land, with the nearest major city being Grand Forks, located approximately 50 miles to the north.
Climate
Petersburg has a humid continental climate, with cold winters and hot summers. The average annual temperature is 45°F (7°C), with an average high of 68°F (20°C) in July and an average low of 22°F (-6°C) in January. The average annual precipitation is 22 inches (56 cm).
Demographics
As of the 2010 census, the population of Petersburg was 545, with a population density of 1,092 people per square mile (421/km2). The racial makeup of the city was 97.3% White, 0.2% African American, 0.2% Native American, 0.2% Asian, 0.4% from other races, and 1.7% from two or more races. Hispanic or Latino of any race were 1.3% of the population.
Economy
Petersburg’s economy is largely based on agriculture. The city is home to several grain elevators, as well as a number of small businesses. The city is also home to a number of manufacturing companies, including a furniture factory and a plastics factory.
The city is served by the Petersburg Municipal Airport, which offers general aviation services. The nearest commercial airport is located in Grand Forks, approximately 50 miles to the north.
History
Petersburg was founded in 1882 by Peter Peterson, a local settler. The city was incorporated in 1883 and was named after Peterson. The city grew rapidly in the late 19th and early 20th centuries, becoming a major center for grain production and shipping.
In the early 20th century, the city was home to a number of large businesses, including a flour mill, a creamery, and a brickyard. The city also had a number of hotels, restaurants, and other businesses.
In the late 20th century, the city’s economy shifted away from agriculture and towards manufacturing. The city is now home to a number of small businesses, as well as a furniture factory and a plastics factory.
Conclusion
Petersburg is a small city located in Walsh County, North Dakota, United States. It is situated on the banks of the Red River of the North, approximately 20 miles south of the Canadian border. The city was founded in 1882 and was named after Peter Peterson, a local settler. As of the 2010 census, the population of Petersburg was 545. The city has a humid continental climate, with cold winters and hot summers. The economy of the city is largely based on agriculture, with a number of small businesses and manufacturing companies. Petersburg has a rich history, and is an important part of the local community.
Common Questions
What is Per Capita Income in Petersburg?
Per Capita income in Petersburg is $33,340.
What is the Median Family Income in Petersburg?
Median Family Income in Petersburg is $88,750.
What is the Median Household income in Petersburg?
Median Household Income in Petersburg is $53,750.
What is Income or Wage Gap in Petersburg?
Income or Wage Gap in Petersburg is 58.7%.
Women in Petersburg earn 41.3 cents for every dollar earned by a man.
What is Inequality or Gini Index in Petersburg?
Inequality or Gini Index in Petersburg is 0.43.
What is the Total Population of Petersburg?
Total Population of Petersburg is 131.
What is the Total Male Population of Petersburg?
Total Male Population of Petersburg is 59.
What is the Total Female Population of Petersburg?
Total Female Population of Petersburg is 72.
What is the Ratio of Males per 100 Females in Petersburg?
There are 81.94 Males per 100 Females in Petersburg.
What is the Ratio of Females per 100 Males in Petersburg?
There are 122.03 Females per 100 Males in Petersburg.
What is the Median Population Age in Petersburg?
Median Population Age in Petersburg is 60.3 Years.
What is the Average Family Size in Petersburg
Average Family Size in Petersburg is 3.4 People.
What is the Average Household Size in Petersburg
Average Household Size in Petersburg is 2.3 People.
How Large is the Labor Force in Petersburg?
There are 50 People in the Labor Forcein in Petersburg.
What is the Percentage of People in the Labor Force in Petersburg?
49.5% of People are in the Labor Force in Petersburg.