Galesburg, ND Map & Demographics
Galesburg Map
Galesburg Overview
$58,708
PER CAPITA INCOME
$123,542
AVG FAMILY INCOME
$88,333
AVG HOUSEHOLD INCOME
27.8%
WAGE / INCOME GAP [ % ]
72.2¢/ $1
WAGE / INCOME GAP [ $ ]
0.32
INEQUALITY / GINI INDEX
63
TOTAL POPULATION
32
MALE POPULATION
31
FEMALE POPULATION
103.23
MALES / 100 FEMALES
96.88
FEMALES / 100 MALES
55.5
MEDIAN AGE
2.3
AVG FAMILY SIZE
1.9
AVG HOUSEHOLD SIZE
43
LABOR FORCE [ PEOPLE ]
79.6%
PERCENT IN LABOR FORCE
Galesburg Zip Codes
Galesburg Area Codes
Income in Galesburg
Income Overview in Galesburg
Per Capita Income in Galesburg is $58,708, while median incomes of families and households are $123,542 and $88,333 respectively.
| Characteristic | Number | Measure |
| Per Capita Income | 63 | $58,708 |
| Median Family Income | 21 | $123,542 |
| Mean Family Income | 21 | $140,724 |
| Median Household Income | 34 | $88,333 |
| Mean Household Income | 34 | $115,674 |
| Income Deficit | 21 | $0 |
| Wage / Income Gap (%) | 63 | 27.78% |
| Wage / Income Gap ($) | 63 | 72.22¢ per $1 |
| Gini / Inequality Index | 63 | 0.32 |
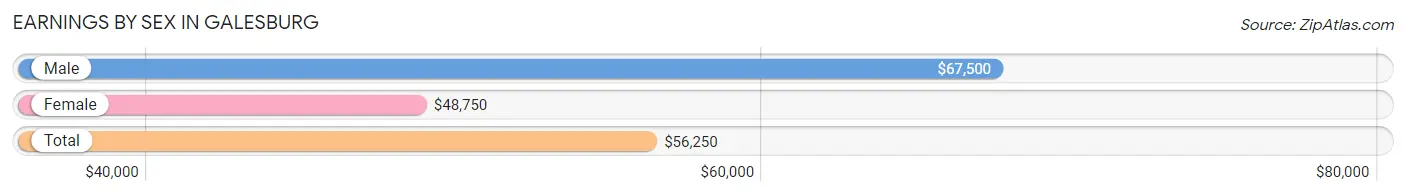
Earnings by Sex in Galesburg
Average Earnings in Galesburg are $56,250, $67,500 for men and $48,750 for women, a difference of 27.8%.
| Sex | Number | Average Earnings |
| Male | 26 (54.2%) | $67,500 |
| Female | 22 (45.8%) | $48,750 |
| Total | 48 (100.0%) | $56,250 |
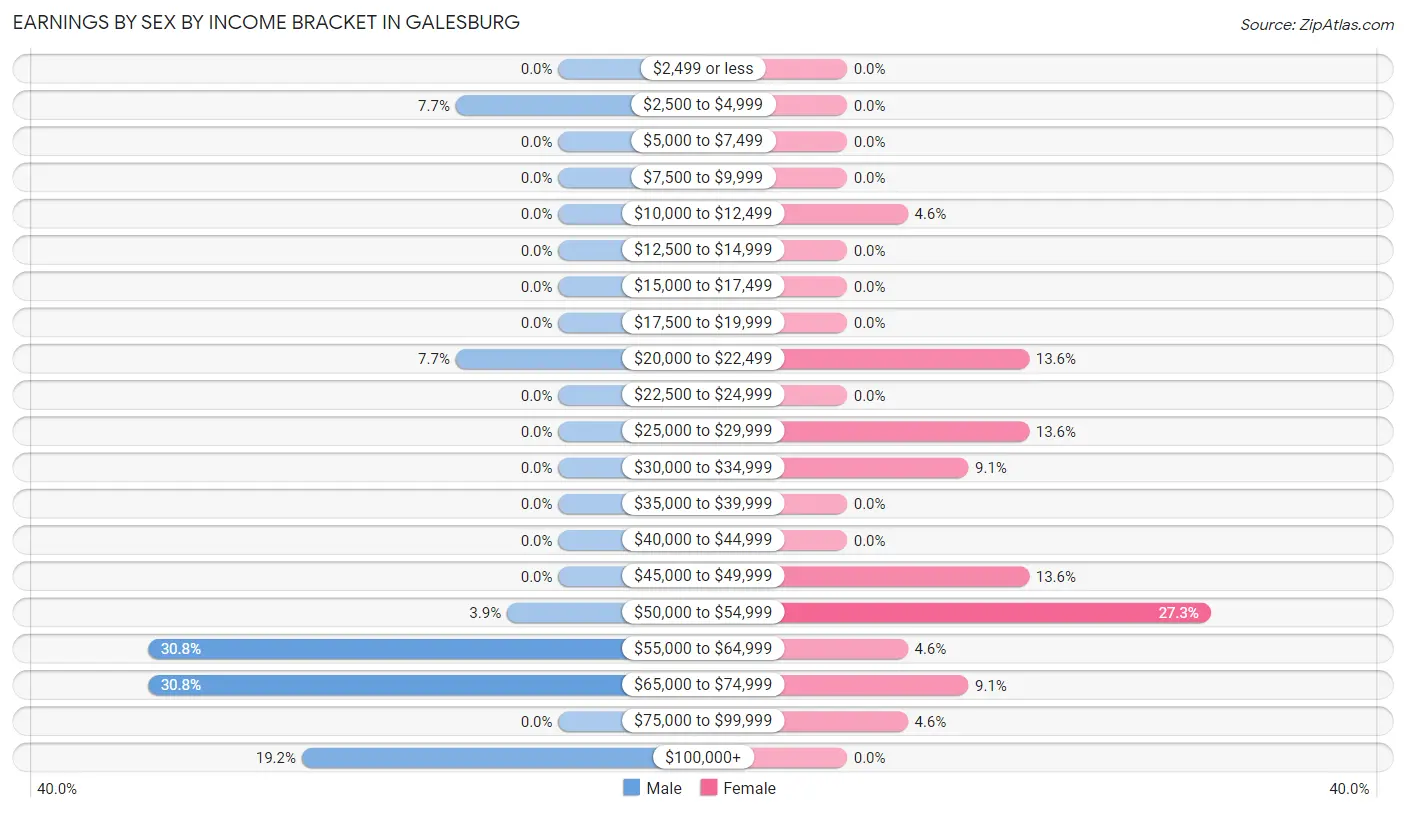
Earnings by Sex by Income Bracket in Galesburg
The most common earnings brackets in Galesburg are $55,000 to $64,999 for men (8 | 30.8%) and $50,000 to $54,999 for women (6 | 27.3%).
| Income | Male | Female |
| $2,499 or less | 0 (0.0%) | 0 (0.0%) |
| $2,500 to $4,999 | 2 (7.7%) | 0 (0.0%) |
| $5,000 to $7,499 | 0 (0.0%) | 0 (0.0%) |
| $7,500 to $9,999 | 0 (0.0%) | 0 (0.0%) |
| $10,000 to $12,499 | 0 (0.0%) | 1 (4.5%) |
| $12,500 to $14,999 | 0 (0.0%) | 0 (0.0%) |
| $15,000 to $17,499 | 0 (0.0%) | 0 (0.0%) |
| $17,500 to $19,999 | 0 (0.0%) | 0 (0.0%) |
| $20,000 to $22,499 | 2 (7.7%) | 3 (13.6%) |
| $22,500 to $24,999 | 0 (0.0%) | 0 (0.0%) |
| $25,000 to $29,999 | 0 (0.0%) | 3 (13.6%) |
| $30,000 to $34,999 | 0 (0.0%) | 2 (9.1%) |
| $35,000 to $39,999 | 0 (0.0%) | 0 (0.0%) |
| $40,000 to $44,999 | 0 (0.0%) | 0 (0.0%) |
| $45,000 to $49,999 | 0 (0.0%) | 3 (13.6%) |
| $50,000 to $54,999 | 1 (3.8%) | 6 (27.3%) |
| $55,000 to $64,999 | 8 (30.8%) | 1 (4.5%) |
| $65,000 to $74,999 | 8 (30.8%) | 2 (9.1%) |
| $75,000 to $99,999 | 0 (0.0%) | 1 (4.5%) |
| $100,000+ | 5 (19.2%) | 0 (0.0%) |
| Total | 26 (100.0%) | 22 (100.0%) |
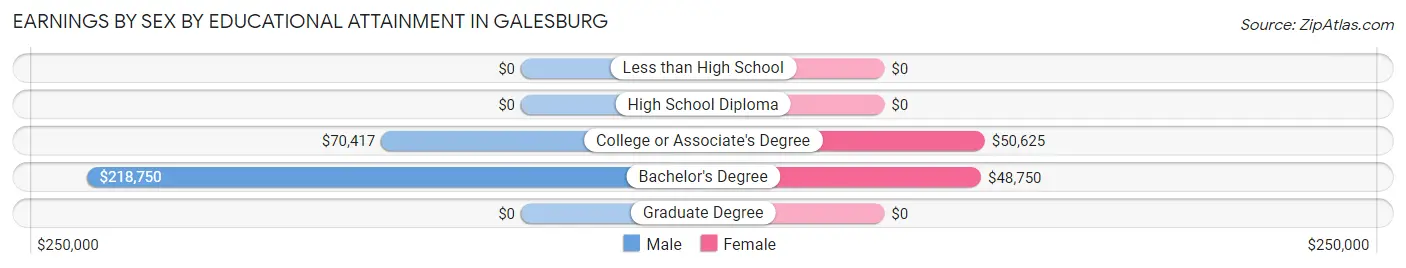
Earnings by Sex by Educational Attainment in Galesburg
Average earnings in Galesburg are $67,500 for men and $48,750 for women, a difference of 27.8%. Men with an educational attainment of bachelor's degree enjoy the highest average annual earnings of $218,750, while those with college or associate's degree education earn the least with $70,417. Women with an educational attainment of college or associate's degree earn the most with the average annual earnings of $50,625, while those with bachelor's degree education have the smallest earnings of $48,750.
| Educational Attainment | Male Income | Female Income |
| Less than High School | - | - |
| High School Diploma | - | - |
| College or Associate's Degree | $70,417 | $50,625 |
| Bachelor's Degree | $218,750 | $48,750 |
| Graduate Degree | - | - |
| Total | $67,500 | $48,750 |
Family Income in Galesburg
Family Income Brackets in Galesburg
According to the Galesburg family income data, there are 9 families falling into the $100,000 to $149,999 income range, which is the most common income bracket and makes up 42.9% of all families.
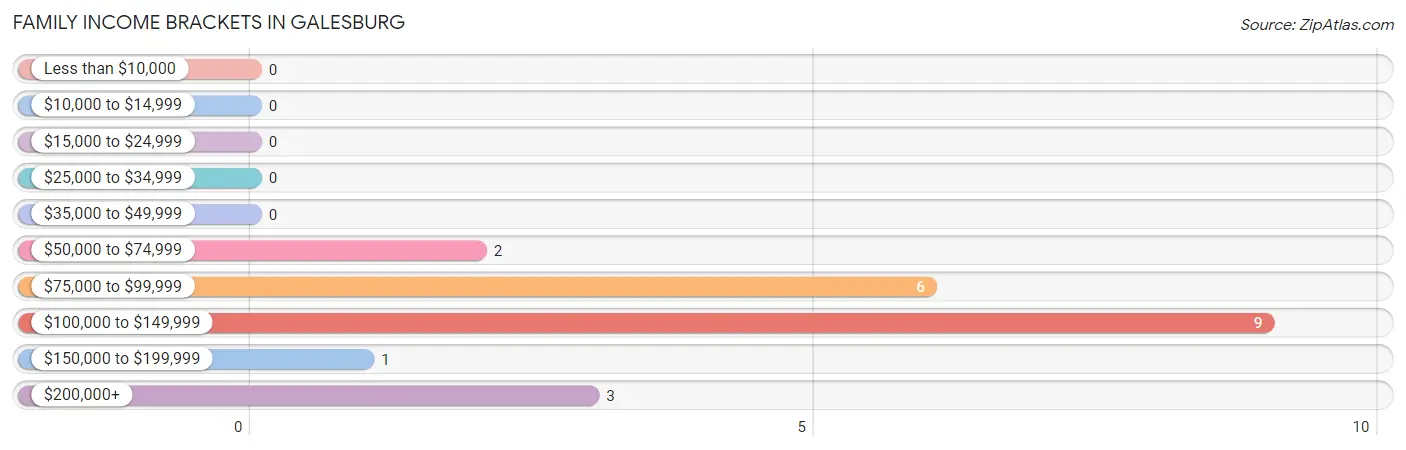
| Income Bracket | # Families | % Families |
| Less than $10,000 | 0 | 0.0% |
| $10,000 to $14,999 | 0 | 0.0% |
| $15,000 to $24,999 | 0 | 0.0% |
| $25,000 to $34,999 | 0 | 0.0% |
| $35,000 to $49,999 | 0 | 0.0% |
| $50,000 to $74,999 | 2 | 9.5% |
| $75,000 to $99,999 | 6 | 28.6% |
| $100,000 to $149,999 | 9 | 42.9% |
| $150,000 to $199,999 | 1 | 4.8% |
| $200,000+ | 3 | 14.3% |
Family Income by Famaliy Size in Galesburg
2-person families (14 | 66.7%) account for the highest median family income in Galesburg with $130,000 per family, while 2-person families (14 | 66.7%) have the highest median income of $65,000 per family member.
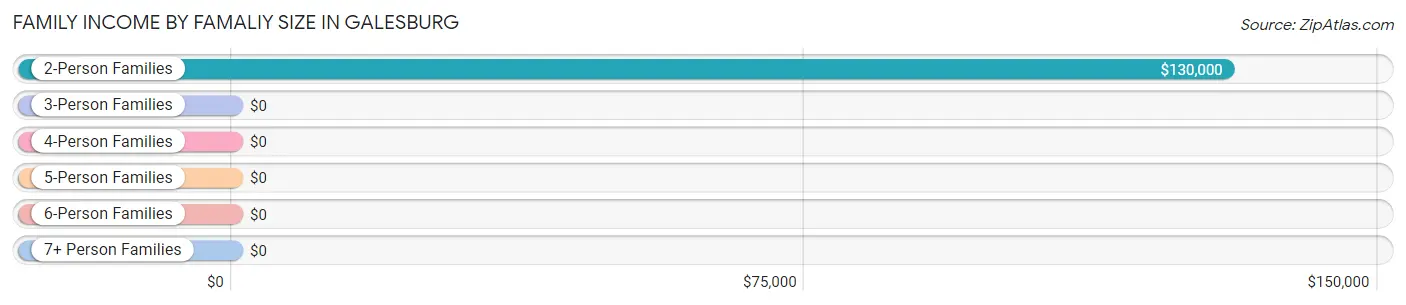
| Income Bracket | # Families | Median Income |
| 2-Person Families | 14 (66.7%) | $130,000 |
| 3-Person Families | 4 (19.1%) | $0 |
| 4-Person Families | 0 (0.0%) | $0 |
| 5-Person Families | 3 (14.3%) | $0 |
| 6-Person Families | 0 (0.0%) | $0 |
| 7+ Person Families | 0 (0.0%) | $0 |
| Total | 21 (100.0%) | $123,542 |
Family Income by Number of Earners in Galesburg
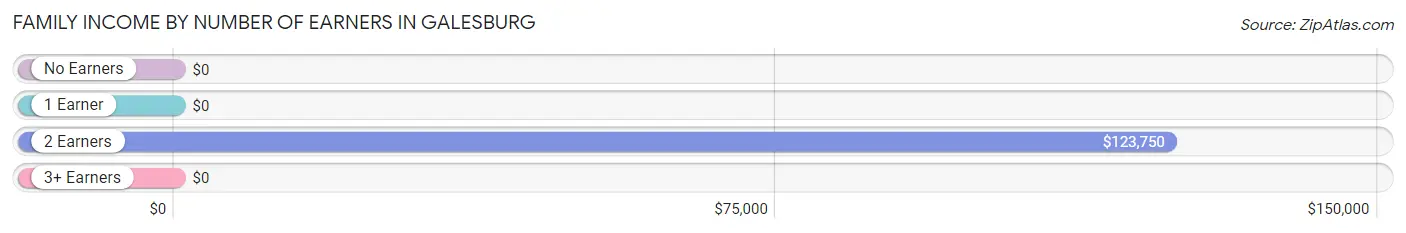
| Number of Earners | # Families | Median Income |
| No Earners | 0 (0.0%) | $0 |
| 1 Earner | 5 (23.8%) | $0 |
| 2 Earners | 16 (76.2%) | $123,750 |
| 3+ Earners | 0 (0.0%) | $0 |
| Total | 21 (100.0%) | $123,542 |
Household Income in Galesburg
Household Income Brackets in Galesburg
With 10 households falling in the category, the $100,000 to $149,999 income range is the most frequent in Galesburg, accounting for 29.4% of all households.
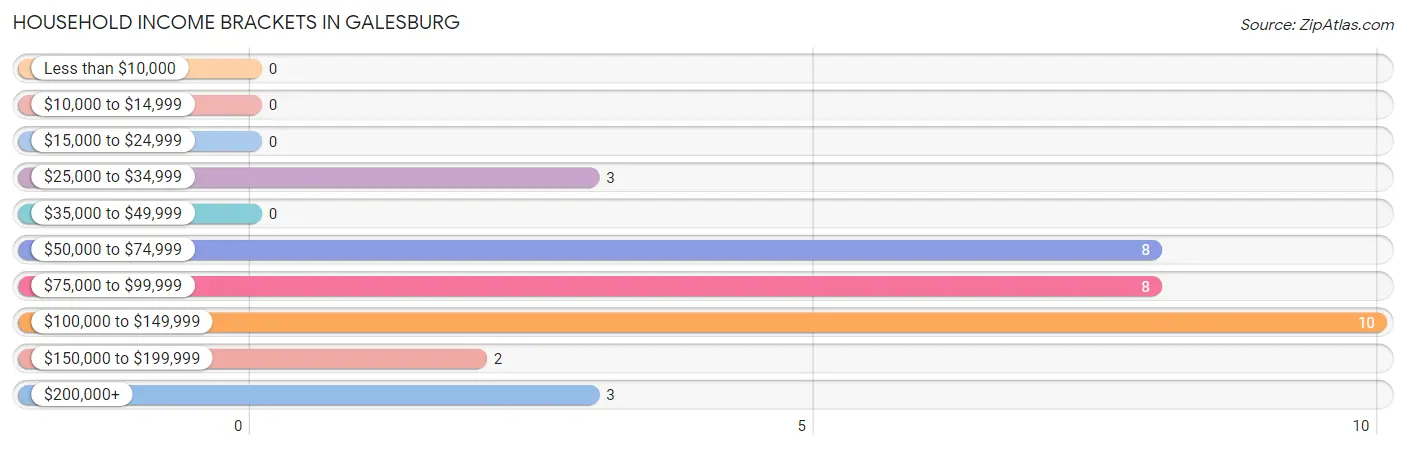
| Income Bracket | # Households | % Households |
| Less than $10,000 | 0 | 0.0% |
| $10,000 to $14,999 | 0 | 0.0% |
| $15,000 to $24,999 | 0 | 0.0% |
| $25,000 to $34,999 | 3 | 8.8% |
| $35,000 to $49,999 | 0 | 0.0% |
| $50,000 to $74,999 | 8 | 23.5% |
| $75,000 to $99,999 | 8 | 23.5% |
| $100,000 to $149,999 | 10 | 29.4% |
| $150,000 to $199,999 | 2 | 5.9% |
| $200,000+ | 3 | 8.8% |
Household Income by Householder Age in Galesburg
The median household income in Galesburg is $88,333, with the highest median household income of $123,438 found in the 25 to 44 years age bracket for the primary householder. A total of 11 households (32.4%) fall into this category.
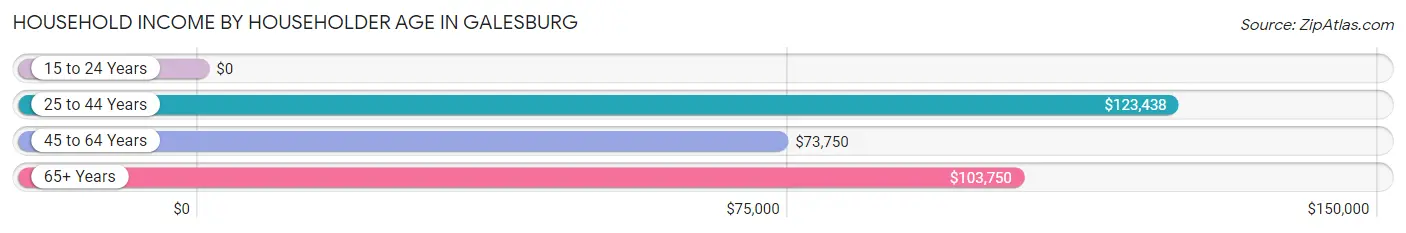
| Income Bracket | # Households | Median Income |
| 15 to 24 Years | 0 (0.0%) | $0 |
| 25 to 44 Years | 11 (32.4%) | $123,438 |
| 45 to 64 Years | 13 (38.2%) | $73,750 |
| 65+ Years | 10 (29.4%) | $103,750 |
| Total | 34 (100.0%) | $88,333 |
Poverty in Galesburg
Income Below Poverty by Sex and Age in Galesburg
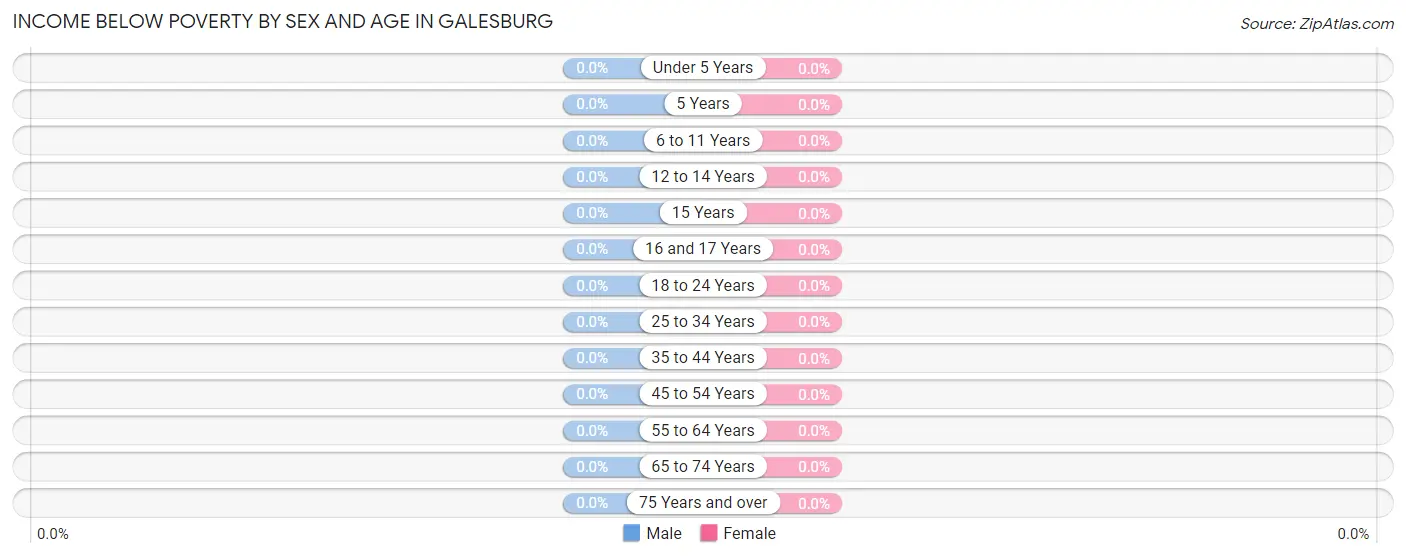
| Age Bracket | Male | Female |
| Under 5 Years | 0 (0.0%) | 0 (0.0%) |
| 5 Years | 0 (0.0%) | 0 (0.0%) |
| 6 to 11 Years | 0 (0.0%) | 0 (0.0%) |
| 12 to 14 Years | 0 (0.0%) | 0 (0.0%) |
| 15 Years | 0 (0.0%) | 0 (0.0%) |
| 16 and 17 Years | 0 (0.0%) | 0 (0.0%) |
| 18 to 24 Years | 0 (0.0%) | 0 (0.0%) |
| 25 to 34 Years | 0 (0.0%) | 0 (0.0%) |
| 35 to 44 Years | 0 (0.0%) | 0 (0.0%) |
| 45 to 54 Years | 0 (0.0%) | 0 (0.0%) |
| 55 to 64 Years | 0 (0.0%) | 0 (0.0%) |
| 65 to 74 Years | 0 (0.0%) | 0 (0.0%) |
| 75 Years and over | 0 (0.0%) | 0 (0.0%) |
| Total | 0 (0.0%) | 0 (0.0%) |
Income Above Poverty by Sex and Age in Galesburg
According to the poverty statistics in Galesburg, males aged 6 to 11 years and females aged 12 to 14 years are the age groups that are most secure financially, with 100.0% of males and 100.0% of females in these age groups living above the poverty line.
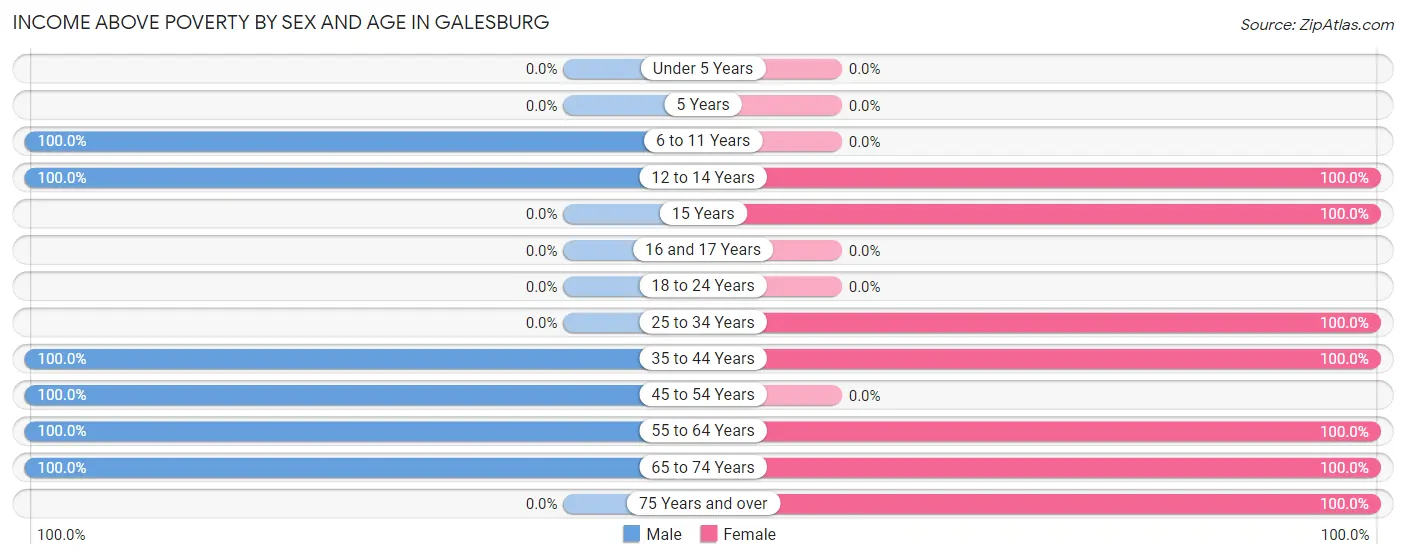
| Age Bracket | Male | Female |
| Under 5 Years | 0 (0.0%) | 0 (0.0%) |
| 5 Years | 0 (0.0%) | 0 (0.0%) |
| 6 to 11 Years | 2 (100.0%) | 0 (0.0%) |
| 12 to 14 Years | 2 (100.0%) | 2 (100.0%) |
| 15 Years | 0 (0.0%) | 3 (100.0%) |
| 16 and 17 Years | 0 (0.0%) | 0 (0.0%) |
| 18 to 24 Years | 0 (0.0%) | 0 (0.0%) |
| 25 to 34 Years | 0 (0.0%) | 5 (100.0%) |
| 35 to 44 Years | 4 (100.0%) | 6 (100.0%) |
| 45 to 54 Years | 7 (100.0%) | 0 (0.0%) |
| 55 to 64 Years | 9 (100.0%) | 8 (100.0%) |
| 65 to 74 Years | 8 (100.0%) | 6 (100.0%) |
| 75 Years and over | 0 (0.0%) | 1 (100.0%) |
| Total | 32 (100.0%) | 31 (100.0%) |
Income Below Poverty Among Married-Couple Families in Galesburg
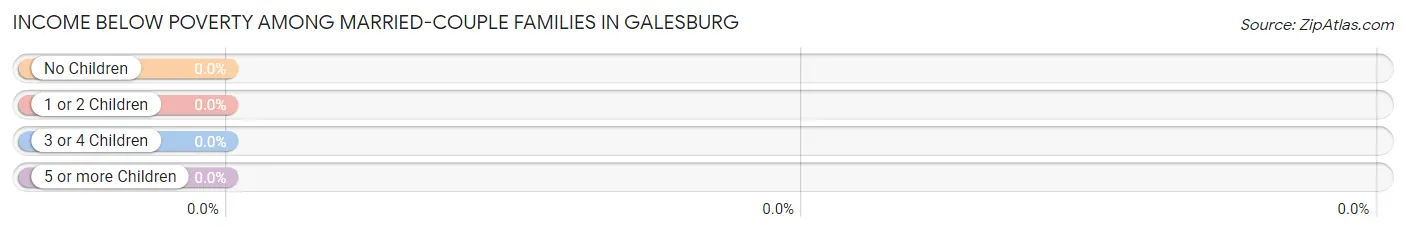
| Children | Above Poverty | Below Poverty |
| No Children | 14 (100.0%) | 0 (0.0%) |
| 1 or 2 Children | 4 (100.0%) | 0 (0.0%) |
| 3 or 4 Children | 3 (100.0%) | 0 (0.0%) |
| 5 or more Children | 0 (0.0%) | 0 (0.0%) |
| Total | 21 (100.0%) | 0 (0.0%) |
Income Below Poverty Among Single-Parent Households in Galesburg
| Children | Single Father | Single Mother |
| No Children | 0 (0.0%) | 0 (0.0%) |
| 1 or 2 Children | 0 (0.0%) | 0 (0.0%) |
| 3 or 4 Children | 0 (0.0%) | 0 (0.0%) |
| 5 or more Children | 0 (0.0%) | 0 (0.0%) |
| Total | 0 (0.0%) | 0 (0.0%) |
Income Below Poverty Among Married-Couple vs Single-Parent Households in Galesburg
| Children | Married-Couple Families | Single-Parent Households |
| No Children | 0 (0.0%) | 0 (0.0%) |
| 1 or 2 Children | 0 (0.0%) | 0 (0.0%) |
| 3 or 4 Children | 0 (0.0%) | 0 (0.0%) |
| 5 or more Children | 0 (0.0%) | 0 (0.0%) |
| Total | 0 (0.0%) | 0 (0.0%) |
Race in Galesburg
The most populous races in Galesburg are , and White / Caucasian (63 | 100.0%).
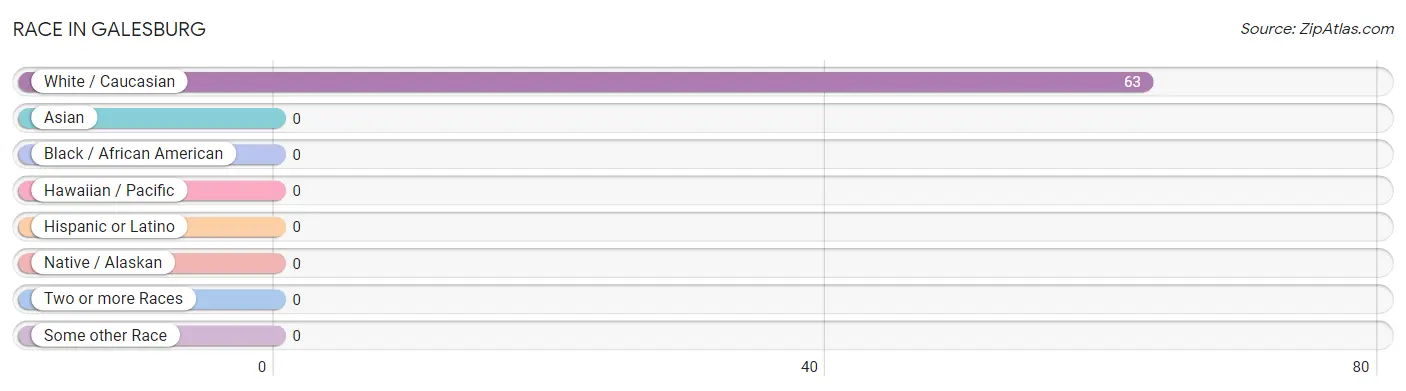
| Race | # Population | % Population |
| Asian | 0 | 0.0% |
| Black / African American | 0 | 0.0% |
| Hawaiian / Pacific | 0 | 0.0% |
| Hispanic or Latino | 0 | 0.0% |
| Native / Alaskan | 0 | 0.0% |
| White / Caucasian | 63 | 100.0% |
| Two or more Races | 0 | 0.0% |
| Some other Race | 0 | 0.0% |
| Total | 63 | 100.0% |
Ancestry in Galesburg
The most populous ancestries reported in Galesburg are German (22 | 34.9%), Norwegian (22 | 34.9%), English (3 | 4.8%), Irish (3 | 4.8%), and Swedish (3 | 4.8%), together accounting for 84.1% of all Galesburg residents.
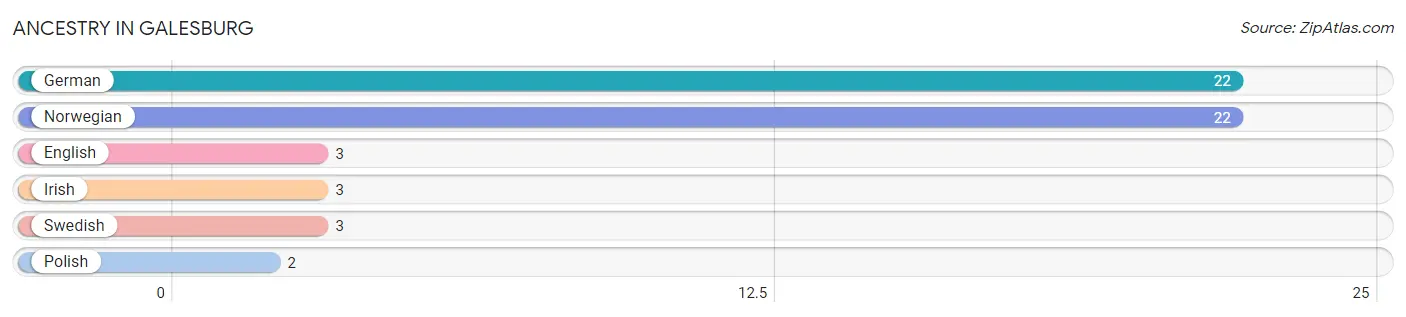
| Ancestry | # Population | % Population |
| English | 3 | 4.8% |
| German | 22 | 34.9% |
| Irish | 3 | 4.8% |
| Norwegian | 22 | 34.9% |
| Polish | 2 | 3.2% |
| Swedish | 3 | 4.8% | View All 6 Rows |
Immigrants in Galesburg
The most numerous immigrant groups reported in Galesburg came from , and Canada (2 | 3.2%), together accounting for 3.2% of all Galesburg residents.

| Immigration Origin | # Population | % Population |
| Canada | 2 | 3.2% | View All 1 Rows |
Sex and Age in Galesburg
Sex and Age in Galesburg
The most populous age groups in Galesburg are 45 to 49 Years (6 | 18.8%) for men and 55 to 59 Years (6 | 19.4%) for women.
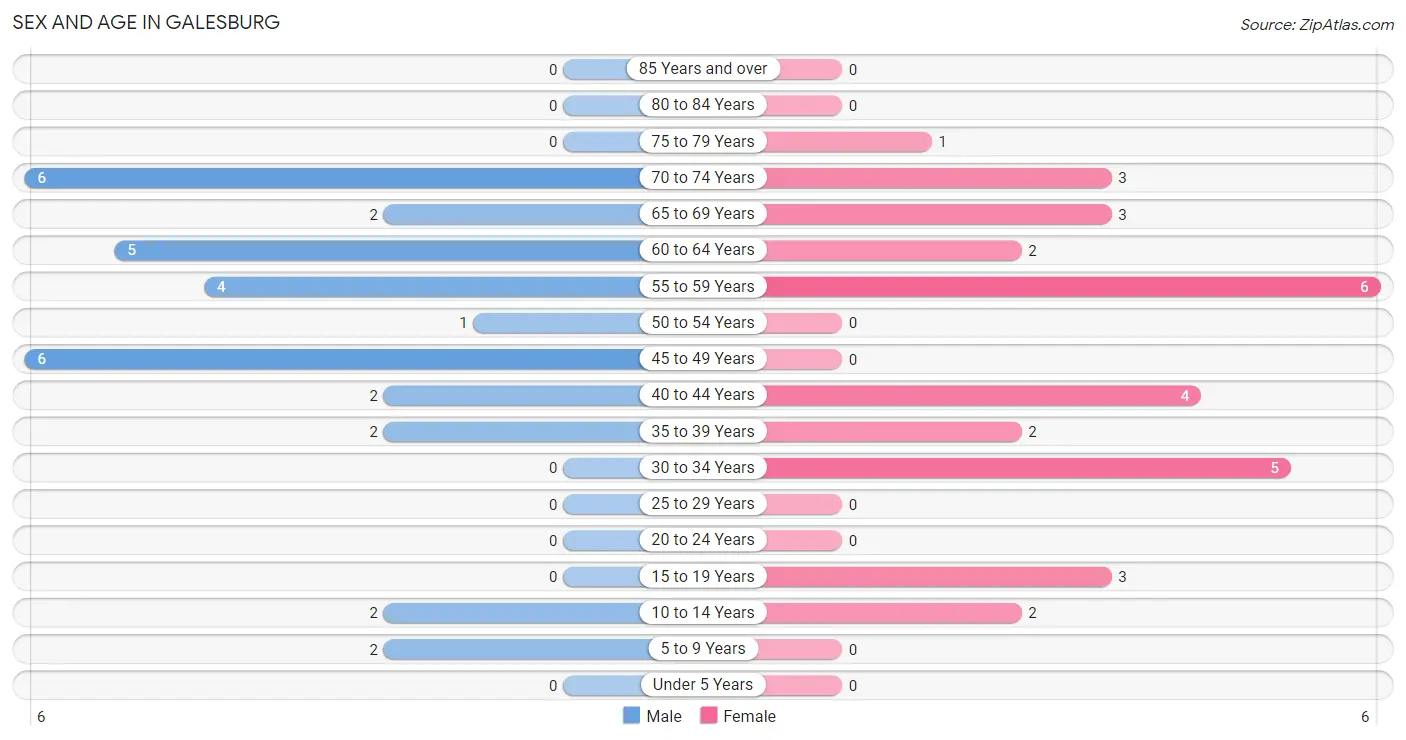
| Age Bracket | Male | Female |
| Under 5 Years | 0 (0.0%) | 0 (0.0%) |
| 5 to 9 Years | 2 (6.2%) | 0 (0.0%) |
| 10 to 14 Years | 2 (6.2%) | 2 (6.5%) |
| 15 to 19 Years | 0 (0.0%) | 3 (9.7%) |
| 20 to 24 Years | 0 (0.0%) | 0 (0.0%) |
| 25 to 29 Years | 0 (0.0%) | 0 (0.0%) |
| 30 to 34 Years | 0 (0.0%) | 5 (16.1%) |
| 35 to 39 Years | 2 (6.2%) | 2 (6.5%) |
| 40 to 44 Years | 2 (6.2%) | 4 (12.9%) |
| 45 to 49 Years | 6 (18.8%) | 0 (0.0%) |
| 50 to 54 Years | 1 (3.1%) | 0 (0.0%) |
| 55 to 59 Years | 4 (12.5%) | 6 (19.4%) |
| 60 to 64 Years | 5 (15.6%) | 2 (6.5%) |
| 65 to 69 Years | 2 (6.2%) | 3 (9.7%) |
| 70 to 74 Years | 6 (18.8%) | 3 (9.7%) |
| 75 to 79 Years | 0 (0.0%) | 1 (3.2%) |
| 80 to 84 Years | 0 (0.0%) | 0 (0.0%) |
| 85 Years and over | 0 (0.0%) | 0 (0.0%) |
| Total | 32 (100.0%) | 31 (100.0%) |
Families and Households in Galesburg
Median Family Size in Galesburg
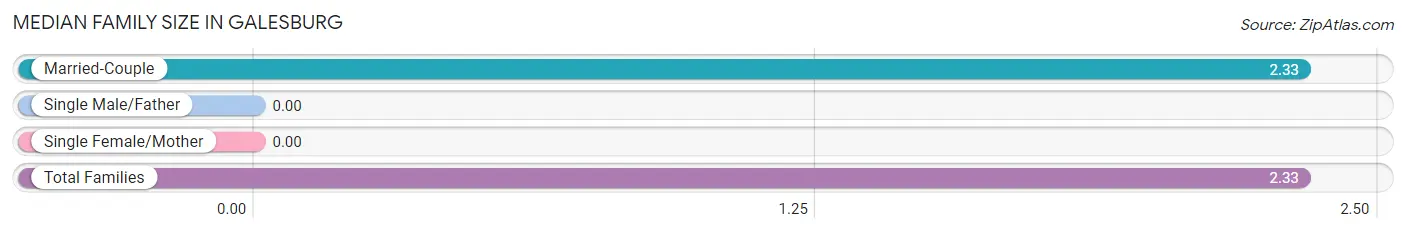
| Family Type | # Families | Family Size |
| Married-Couple | 21 (100.0%) | 2.33 |
| Single Male/Father | 0 (0.0%) | - |
| Single Female/Mother | 0 (0.0%) | - |
| Total Families | 21 (100.0%) | 2.33 |
Median Household Size in Galesburg
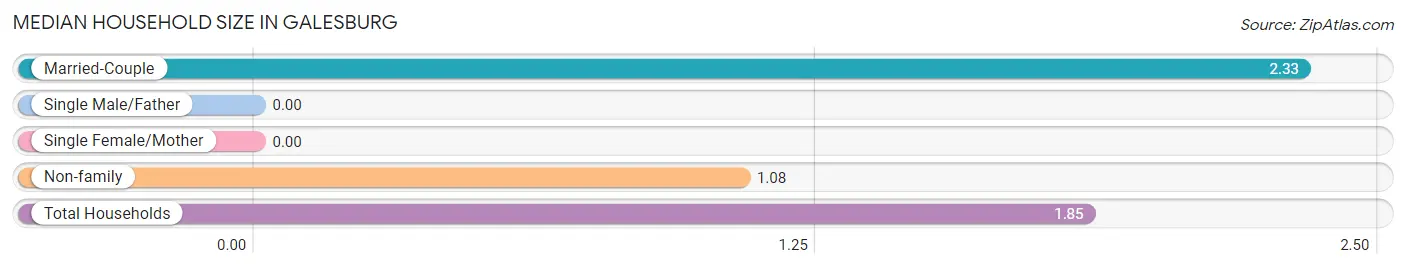
| Household Type | # Households | Household Size |
| Married-Couple | 21 (61.8%) | 2.33 |
| Single Male/Father | 0 (0.0%) | - |
| Single Female/Mother | 0 (0.0%) | - |
| Non-family | 13 (38.2%) | 1.08 |
| Total Households | 34 (100.0%) | 1.85 |
Household Size by Marriage Status in Galesburg
Out of a total of 34 households in Galesburg, 21 (61.8%) are family households, while 13 (38.2%) are nonfamily households. The most numerous type of family households are 2-person households, comprising 14, and the most common type of nonfamily households are 1-person households, comprising 12.
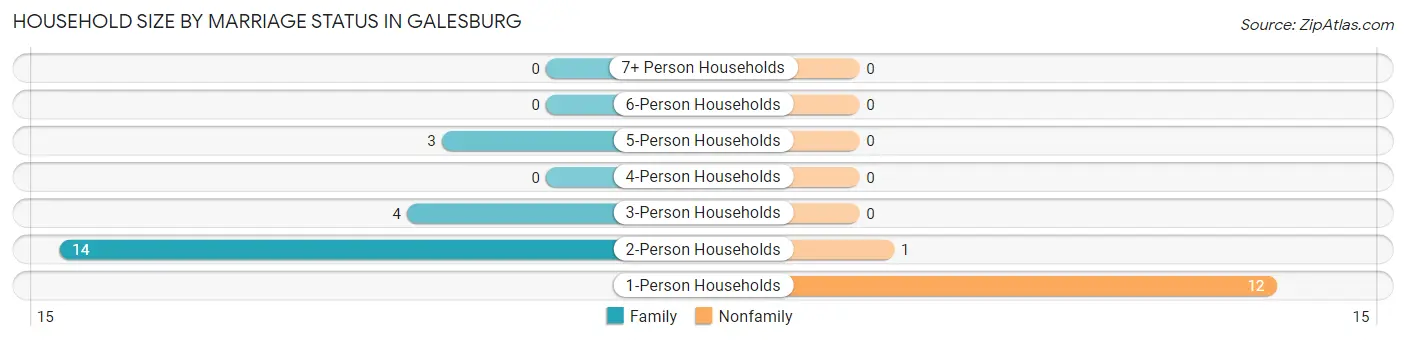
| Household Size | Family Households | Nonfamily Households |
| 1-Person Households | - | 12 (35.3%) |
| 2-Person Households | 14 (41.2%) | 1 (2.9%) |
| 3-Person Households | 4 (11.8%) | 0 (0.0%) |
| 4-Person Households | 0 (0.0%) | 0 (0.0%) |
| 5-Person Households | 3 (8.8%) | 0 (0.0%) |
| 6-Person Households | 0 (0.0%) | 0 (0.0%) |
| 7+ Person Households | 0 (0.0%) | 0 (0.0%) |
| Total | 21 (61.8%) | 13 (38.2%) |
Female Fertility in Galesburg
Fertility by Age in Galesburg
| Age Bracket | Women with Births | Births / 1,000 Women |
| 15 to 19 years | 0 (0.0%) | 0.0 |
| 20 to 34 years | 0 (0.0%) | 0.0 |
| 35 to 50 years | 0 (0.0%) | 0.0 |
| Total | 0 (0.0%) | 0.0 |
Fertility by Age by Marriage Status in Galesburg
| Age Bracket | Married | Unmarried |
| 15 to 19 years | 0 (0.0%) | 0 (0.0%) |
| 20 to 34 years | 0 (0.0%) | 0 (0.0%) |
| 35 to 50 years | 0 (0.0%) | 0 (0.0%) |
| Total | 0 (0.0%) | 0 (0.0%) |
Fertility by Education in Galesburg
| Educational Attainment | Women with Births | Births / 1,000 Women |
| Less than High School | 0 (0.0%) | 0.0 |
| High School Diploma | 0 (0.0%) | 0.0 |
| College or Associate's Degree | 0 (0.0%) | 0.0 |
| Bachelor's Degree | 0 (0.0%) | 0.0 |
| Graduate Degree | 0 (0.0%) | 0.0 |
| Total | 0 (0.0%) | 0.0 |
Fertility by Education by Marriage Status in Galesburg
| Educational Attainment | Married | Unmarried |
| Less than High School | 0 (0.0%) | 0 (0.0%) |
| High School Diploma | 0 (0.0%) | 0 (0.0%) |
| College or Associate's Degree | 0 (0.0%) | 0 (0.0%) |
| Bachelor's Degree | 0 (0.0%) | 0 (0.0%) |
| Graduate Degree | 0 (0.0%) | 0 (0.0%) |
| Total | 0 (0.0%) | 0 (0.0%) |
Employment Characteristics in Galesburg
Employment by Class of Employer in Galesburg
Among the 43 employed individuals in Galesburg, private company employees (30 | 69.8%), self-employed (not incorporated) (7 | 16.3%), and local government employees (4 | 9.3%) make up the most common classes of employment.
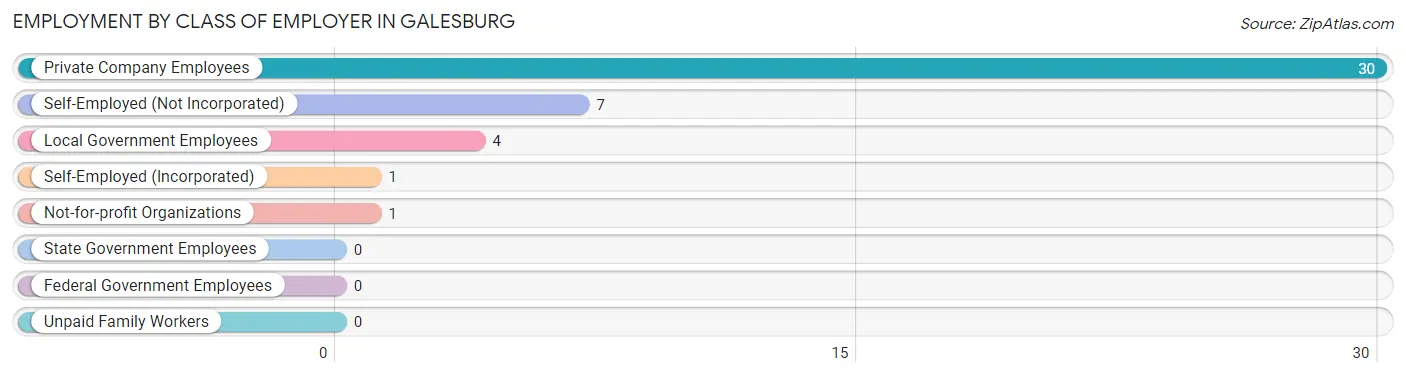
| Employer Class | # Employees | % Employees |
| Private Company Employees | 30 | 69.8% |
| Self-Employed (Incorporated) | 1 | 2.3% |
| Self-Employed (Not Incorporated) | 7 | 16.3% |
| Not-for-profit Organizations | 1 | 2.3% |
| Local Government Employees | 4 | 9.3% |
| State Government Employees | 0 | 0.0% |
| Federal Government Employees | 0 | 0.0% |
| Unpaid Family Workers | 0 | 0.0% |
| Total | 43 | 100.0% |
Employment Status by Age in Galesburg
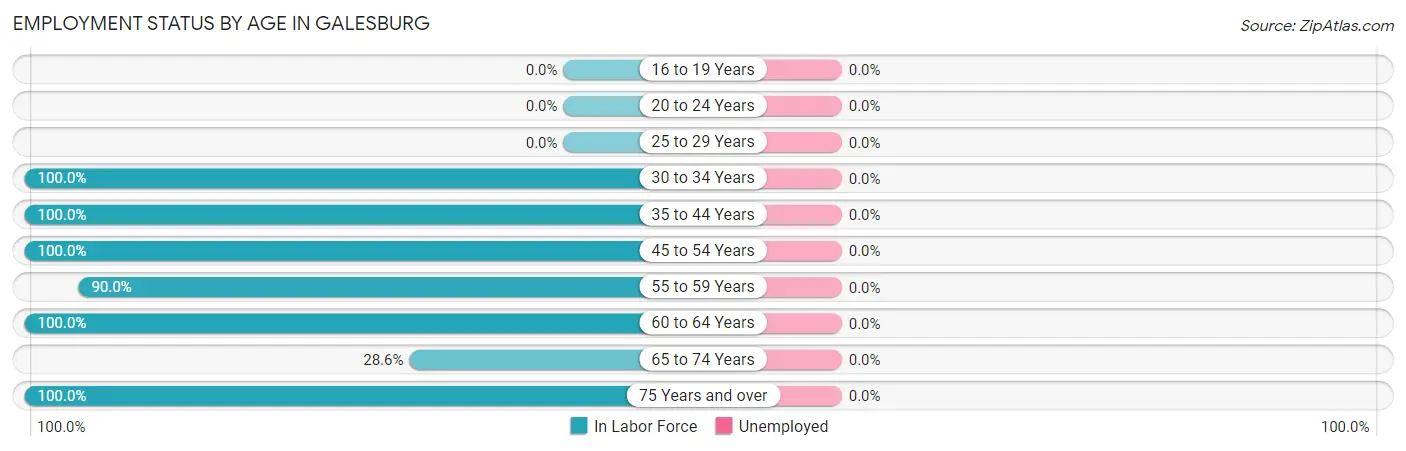
| Age Bracket | In Labor Force | Unemployed |
| 16 to 19 Years | 0 (0.0%) | 0 (0.0%) |
| 20 to 24 Years | 0 (0.0%) | 0 (0.0%) |
| 25 to 29 Years | 0 (0.0%) | 0 (0.0%) |
| 30 to 34 Years | 5 (100.0%) | 0 (0.0%) |
| 35 to 44 Years | 10 (100.0%) | 0 (0.0%) |
| 45 to 54 Years | 7 (100.0%) | 0 (0.0%) |
| 55 to 59 Years | 9 (90.0%) | 0 (0.0%) |
| 60 to 64 Years | 7 (100.0%) | 0 (0.0%) |
| 65 to 74 Years | 4 (28.6%) | 0 (0.0%) |
| 75 Years and over | 1 (100.0%) | 0 (0.0%) |
| Total | 43 (79.6%) | 0 (0.0%) |
Employment Status by Educational Attainment in Galesburg
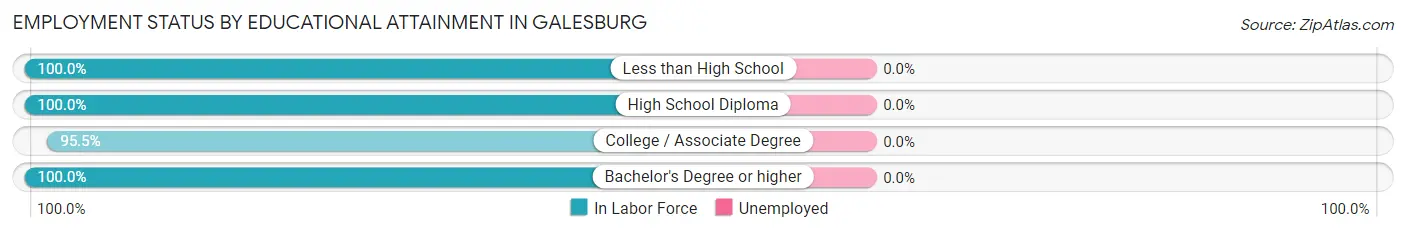
| Educational Attainment | In Labor Force | Unemployed |
| Less than High School | 5 (100.0%) | 0 (0.0%) |
| High School Diploma | 5 (100.0%) | 0 (0.0%) |
| College / Associate Degree | 21 (95.5%) | 0 (0.0%) |
| Bachelor's Degree or higher | 7 (100.0%) | 0 (0.0%) |
| Total | 38 (97.4%) | 0 (0.0%) |
Employment Occupations by Sex in Galesburg
Management, Business, Science and Arts Occupations
The most common Management, Business, Science and Arts occupations in Galesburg are Health Diagnosing & Treating (5 | 11.6%), Management (4 | 9.3%), Business & Financial (2 | 4.6%), Computers, Engineering & Science (2 | 4.6%), and Life, Physical & Social Science (2 | 4.6%).
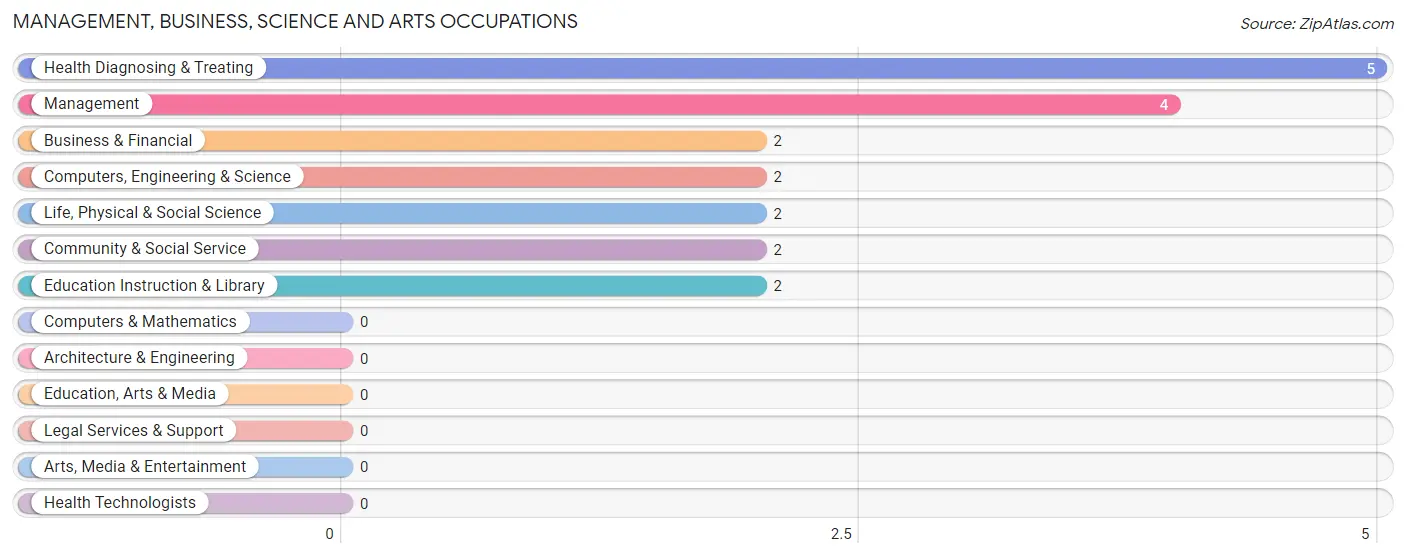
Management, Business, Science and Arts Occupations by Sex
Within the Management, Business, Science and Arts occupations in Galesburg, the most male-oriented occupations are Management (100.0%), Computers, Engineering & Science (100.0%), and Life, Physical & Social Science (100.0%), while the most female-oriented occupations are Business & Financial (100.0%), Community & Social Service (100.0%), and Education Instruction & Library (100.0%).
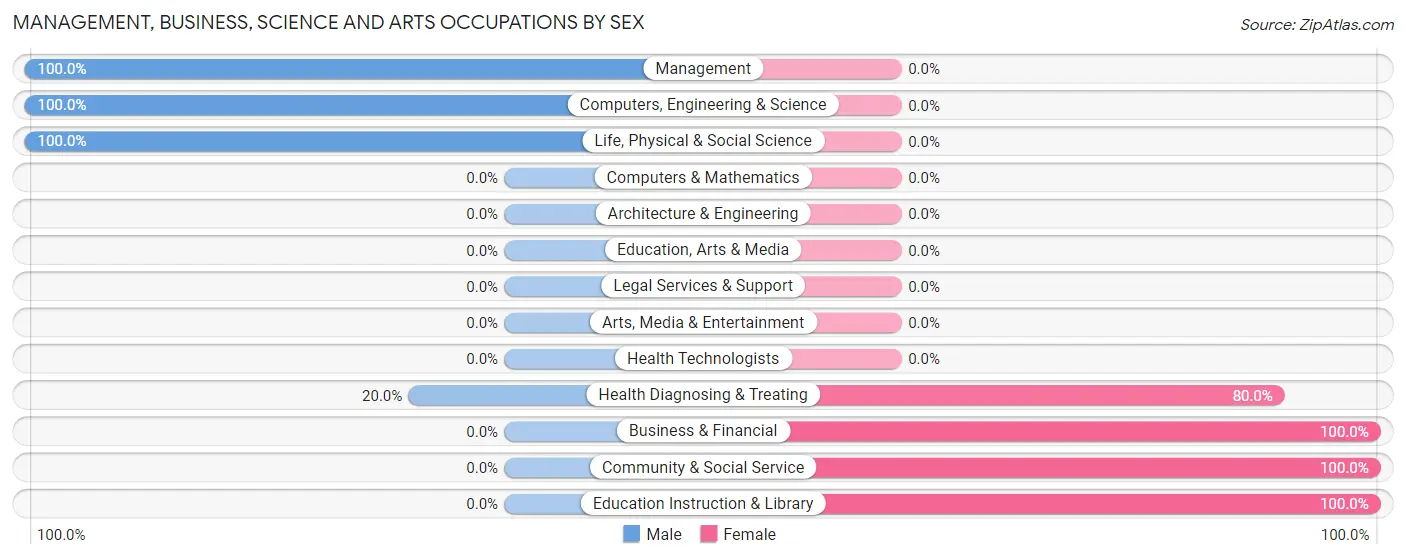
| Occupation | Male | Female |
| Management | 4 (100.0%) | 0 (0.0%) |
| Business & Financial | 0 (0.0%) | 2 (100.0%) |
| Computers, Engineering & Science | 2 (100.0%) | 0 (0.0%) |
| Computers & Mathematics | 0 (0.0%) | 0 (0.0%) |
| Architecture & Engineering | 0 (0.0%) | 0 (0.0%) |
| Life, Physical & Social Science | 2 (100.0%) | 0 (0.0%) |
| Community & Social Service | 0 (0.0%) | 2 (100.0%) |
| Education, Arts & Media | 0 (0.0%) | 0 (0.0%) |
| Legal Services & Support | 0 (0.0%) | 0 (0.0%) |
| Education Instruction & Library | 0 (0.0%) | 2 (100.0%) |
| Arts, Media & Entertainment | 0 (0.0%) | 0 (0.0%) |
| Health Diagnosing & Treating | 1 (20.0%) | 4 (80.0%) |
| Health Technologists | 0 (0.0%) | 0 (0.0%) |
| Total (Category) | 7 (46.7%) | 8 (53.3%) |
| Total (Overall) | 24 (55.8%) | 19 (44.2%) |
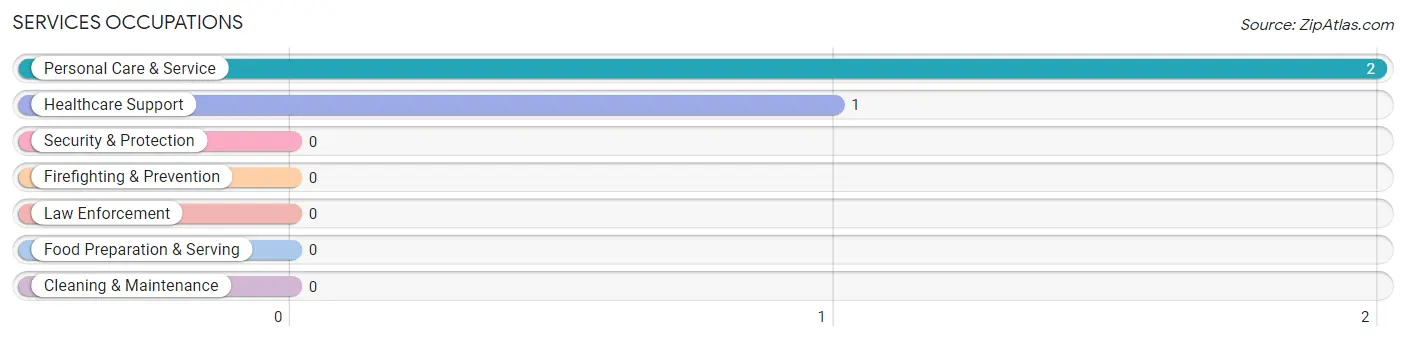
Services Occupations
The most common Services occupations in Galesburg are Personal Care & Service (2 | 4.6%), and Healthcare Support (1 | 2.3%).
Services Occupations by Sex
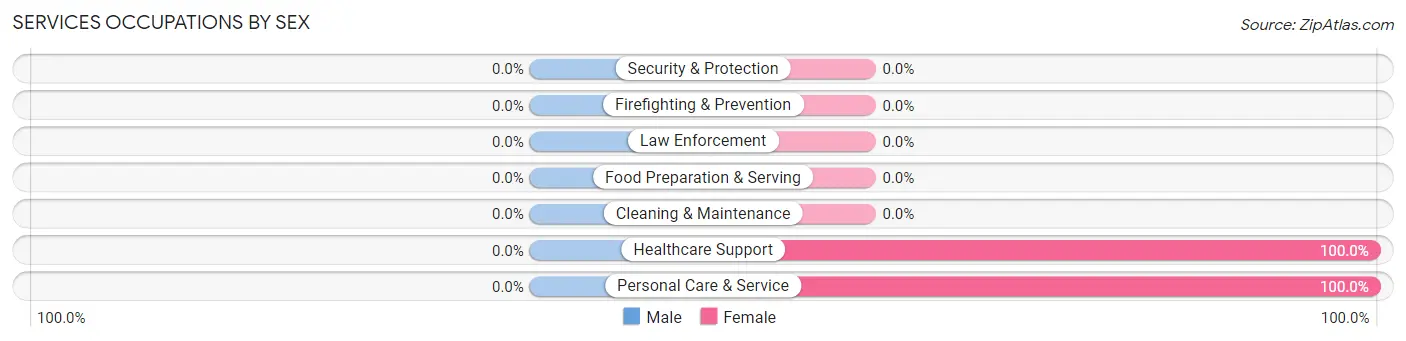
| Occupation | Male | Female |
| Healthcare Support | 0 (0.0%) | 1 (100.0%) |
| Security & Protection | 0 (0.0%) | 0 (0.0%) |
| Firefighting & Prevention | 0 (0.0%) | 0 (0.0%) |
| Law Enforcement | 0 (0.0%) | 0 (0.0%) |
| Food Preparation & Serving | 0 (0.0%) | 0 (0.0%) |
| Cleaning & Maintenance | 0 (0.0%) | 0 (0.0%) |
| Personal Care & Service | 0 (0.0%) | 2 (100.0%) |
| Total (Category) | 0 (0.0%) | 3 (100.0%) |
| Total (Overall) | 24 (55.8%) | 19 (44.2%) |
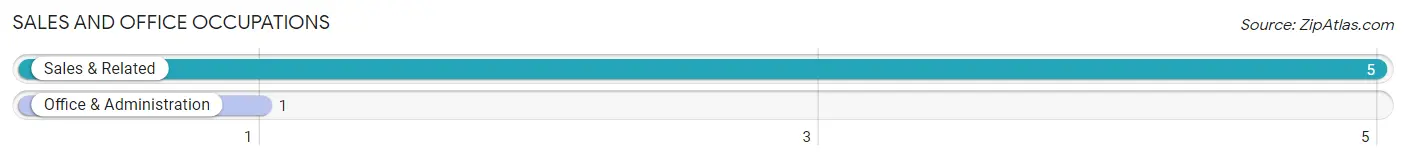
Sales and Office Occupations
The most common Sales and Office occupations in Galesburg are Sales & Related (5 | 11.6%), and Office & Administration (1 | 2.3%).
Sales and Office Occupations by Sex

| Occupation | Male | Female |
| Sales & Related | 1 (20.0%) | 4 (80.0%) |
| Office & Administration | 0 (0.0%) | 1 (100.0%) |
| Total (Category) | 1 (16.7%) | 5 (83.3%) |
| Total (Overall) | 24 (55.8%) | 19 (44.2%) |
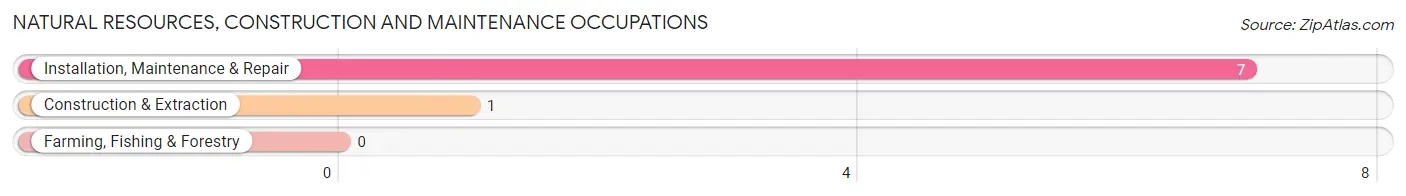
Natural Resources, Construction and Maintenance Occupations
The most common Natural Resources, Construction and Maintenance occupations in Galesburg are Installation, Maintenance & Repair (7 | 16.3%), and Construction & Extraction (1 | 2.3%).
Natural Resources, Construction and Maintenance Occupations by Sex
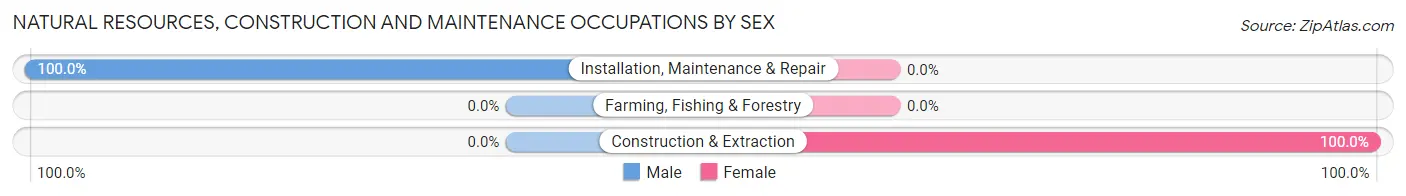
| Occupation | Male | Female |
| Farming, Fishing & Forestry | 0 (0.0%) | 0 (0.0%) |
| Construction & Extraction | 0 (0.0%) | 1 (100.0%) |
| Installation, Maintenance & Repair | 7 (100.0%) | 0 (0.0%) |
| Total (Category) | 7 (87.5%) | 1 (12.5%) |
| Total (Overall) | 24 (55.8%) | 19 (44.2%) |
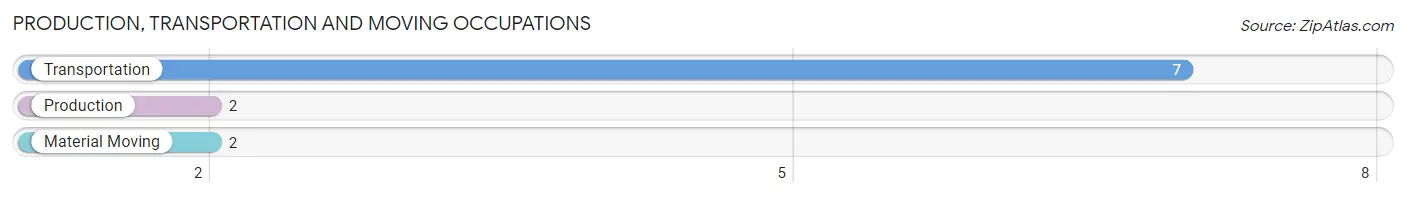
Production, Transportation and Moving Occupations
The most common Production, Transportation and Moving occupations in Galesburg are Transportation (7 | 16.3%), Production (2 | 4.6%), and Material Moving (2 | 4.6%).
Production, Transportation and Moving Occupations by Sex
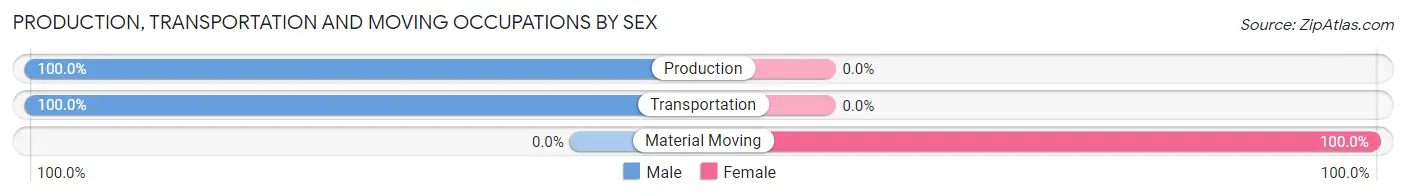
| Occupation | Male | Female |
| Production | 2 (100.0%) | 0 (0.0%) |
| Transportation | 7 (100.0%) | 0 (0.0%) |
| Material Moving | 0 (0.0%) | 2 (100.0%) |
| Total (Category) | 9 (81.8%) | 2 (18.2%) |
| Total (Overall) | 24 (55.8%) | 19 (44.2%) |
Employment Industries by Sex in Galesburg
Employment Industries in Galesburg
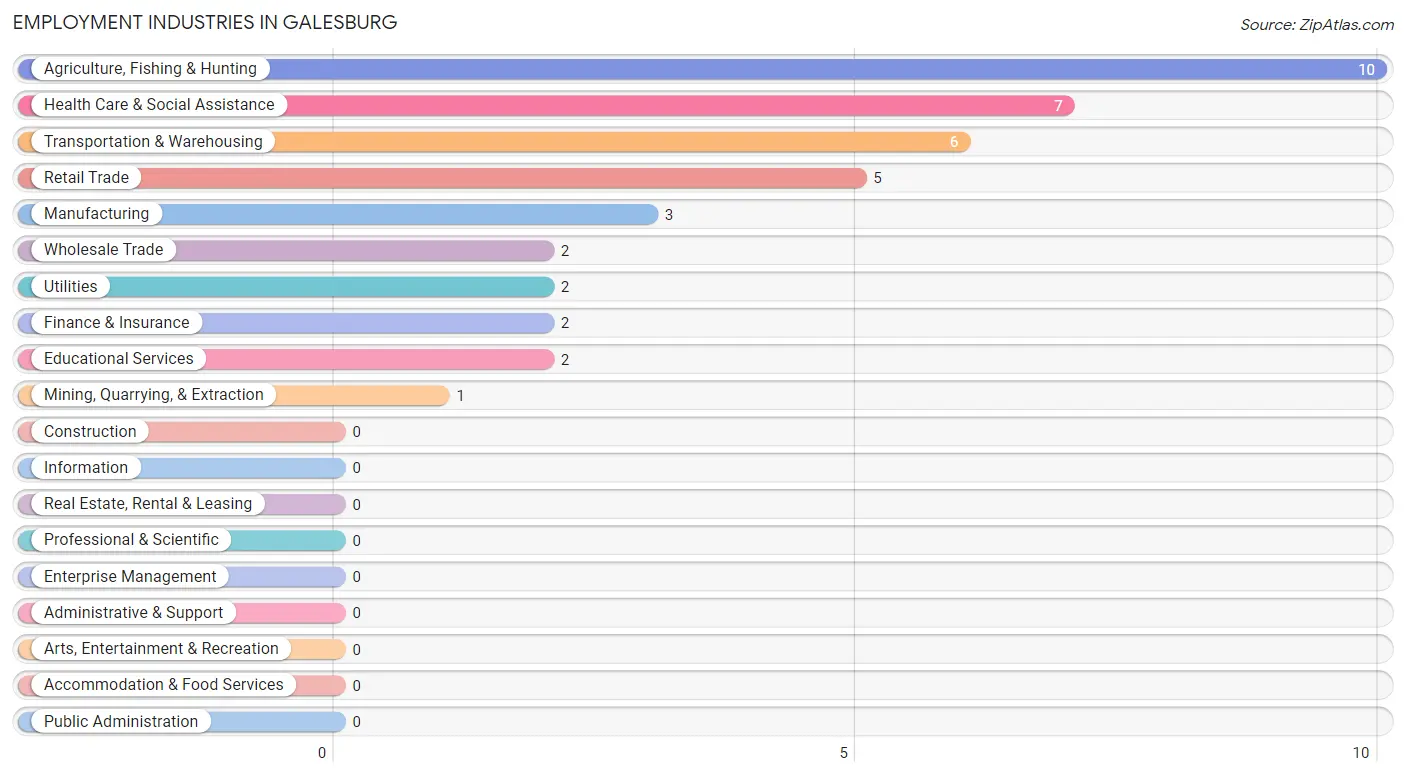
The major employment industries in Galesburg include Agriculture, Fishing & Hunting (10 | 23.3%), Health Care & Social Assistance (7 | 16.3%), Transportation & Warehousing (6 | 14.0%), Retail Trade (5 | 11.6%), and Manufacturing (3 | 7.0%).
Employment Industries by Sex in Galesburg
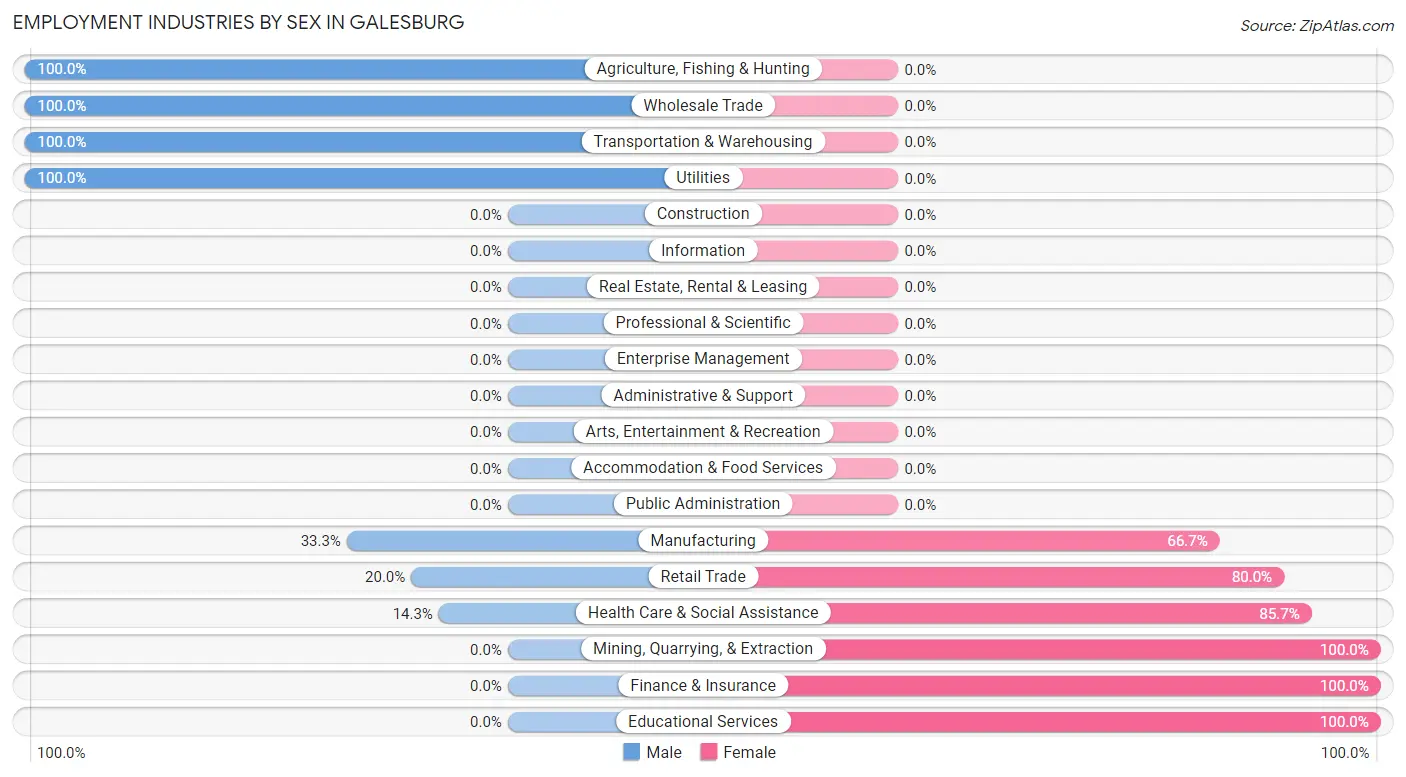
The Galesburg industries that see more men than women are Agriculture, Fishing & Hunting (100.0%), Wholesale Trade (100.0%), and Transportation & Warehousing (100.0%), whereas the industries that tend to have a higher number of women are Mining, Quarrying, & Extraction (100.0%), Finance & Insurance (100.0%), and Educational Services (100.0%).
| Industry | Male | Female |
| Agriculture, Fishing & Hunting | 10 (100.0%) | 0 (0.0%) |
| Mining, Quarrying, & Extraction | 0 (0.0%) | 1 (100.0%) |
| Construction | 0 (0.0%) | 0 (0.0%) |
| Manufacturing | 1 (33.3%) | 2 (66.7%) |
| Wholesale Trade | 2 (100.0%) | 0 (0.0%) |
| Retail Trade | 1 (20.0%) | 4 (80.0%) |
| Transportation & Warehousing | 6 (100.0%) | 0 (0.0%) |
| Utilities | 2 (100.0%) | 0 (0.0%) |
| Information | 0 (0.0%) | 0 (0.0%) |
| Finance & Insurance | 0 (0.0%) | 2 (100.0%) |
| Real Estate, Rental & Leasing | 0 (0.0%) | 0 (0.0%) |
| Professional & Scientific | 0 (0.0%) | 0 (0.0%) |
| Enterprise Management | 0 (0.0%) | 0 (0.0%) |
| Administrative & Support | 0 (0.0%) | 0 (0.0%) |
| Educational Services | 0 (0.0%) | 2 (100.0%) |
| Health Care & Social Assistance | 1 (14.3%) | 6 (85.7%) |
| Arts, Entertainment & Recreation | 0 (0.0%) | 0 (0.0%) |
| Accommodation & Food Services | 0 (0.0%) | 0 (0.0%) |
| Public Administration | 0 (0.0%) | 0 (0.0%) |
| Total | 24 (55.8%) | 19 (44.2%) |
Education in Galesburg
School Enrollment in Galesburg
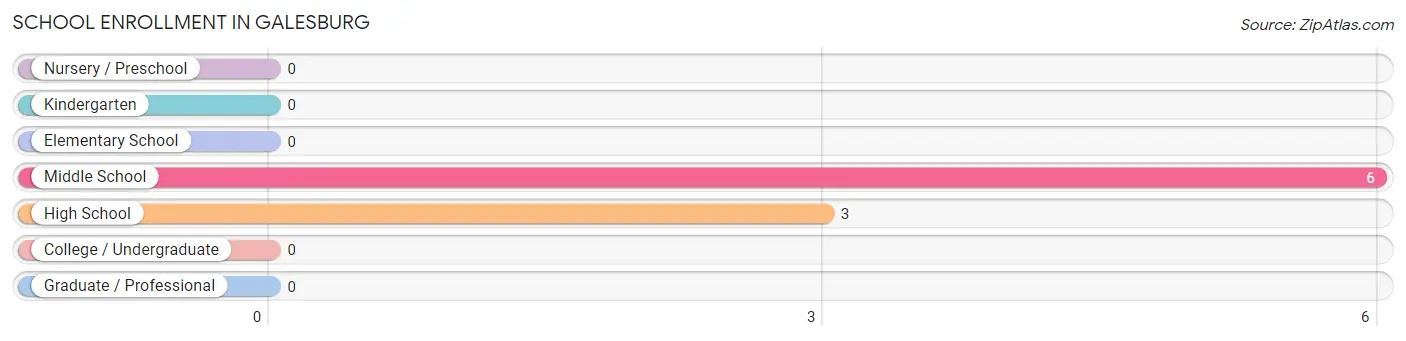
The most common levels of schooling among the 9 students in Galesburg are middle school (6 | 66.7%), and high school (3 | 33.3%).
| School Level | # Students | % Students |
| Nursery / Preschool | 0 | 0.0% |
| Kindergarten | 0 | 0.0% |
| Elementary School | 0 | 0.0% |
| Middle School | 6 | 66.7% |
| High School | 3 | 33.3% |
| College / Undergraduate | 0 | 0.0% |
| Graduate / Professional | 0 | 0.0% |
| Total | 9 | 100.0% |
School Enrollment by Age by Funding Source in Galesburg
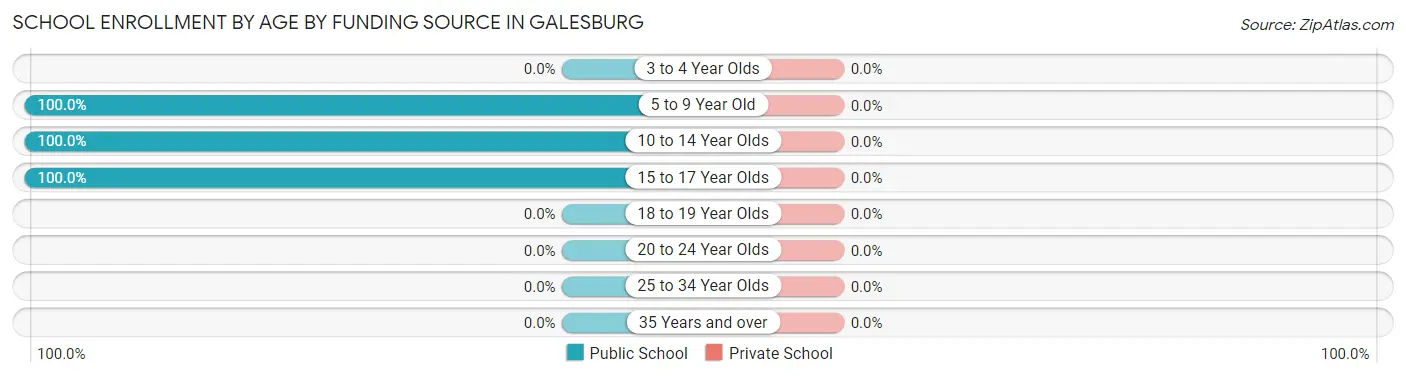
| Age Bracket | Public School | Private School |
| 3 to 4 Year Olds | 0 (0.0%) | 0 (0.0%) |
| 5 to 9 Year Old | 2 (100.0%) | 0 (0.0%) |
| 10 to 14 Year Olds | 4 (100.0%) | 0 (0.0%) |
| 15 to 17 Year Olds | 3 (100.0%) | 0 (0.0%) |
| 18 to 19 Year Olds | 0 (0.0%) | 0 (0.0%) |
| 20 to 24 Year Olds | 0 (0.0%) | 0 (0.0%) |
| 25 to 34 Year Olds | 0 (0.0%) | 0 (0.0%) |
| 35 Years and over | 0 (0.0%) | 0 (0.0%) |
| Total | 9 (100.0%) | 0 (0.0%) |
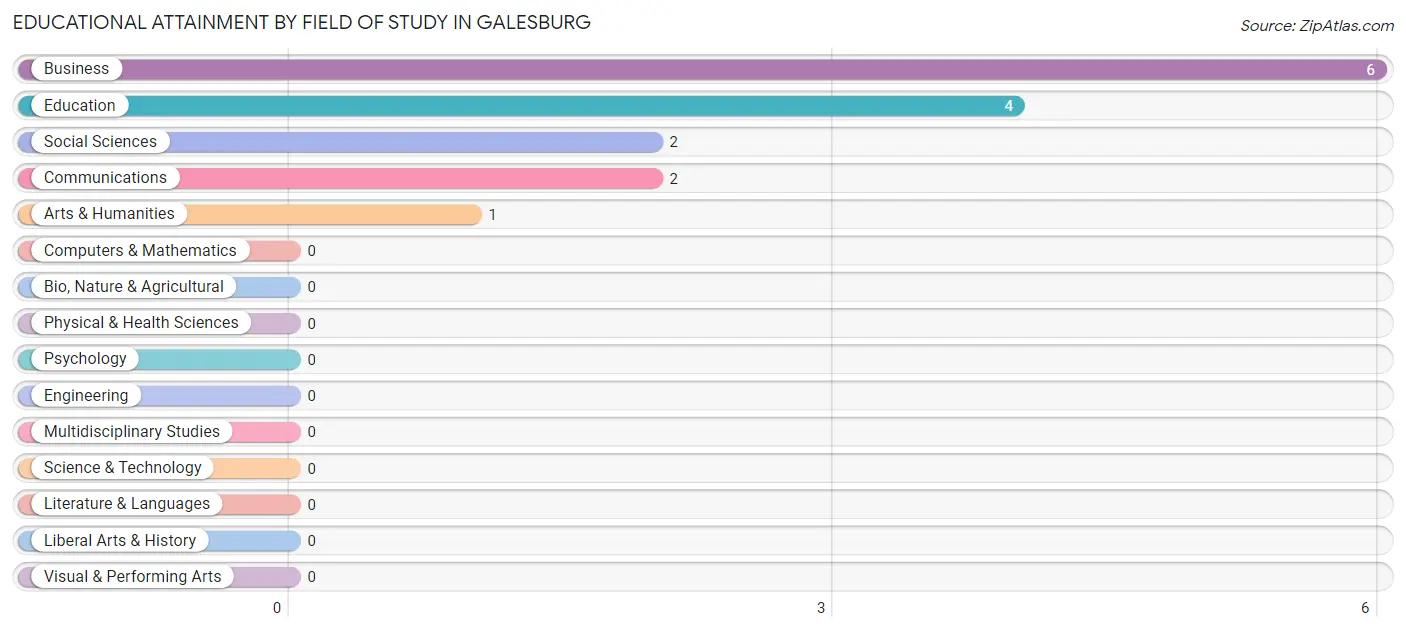
Educational Attainment by Field of Study in Galesburg
Business (6 | 40.0%), education (4 | 26.7%), social sciences (2 | 13.3%), communications (2 | 13.3%), and arts & humanities (1 | 6.7%) are the most common fields of study among 15 individuals in Galesburg who have obtained a bachelor's degree or higher.
| Field of Study | # Graduates | % Graduates |
| Computers & Mathematics | 0 | 0.0% |
| Bio, Nature & Agricultural | 0 | 0.0% |
| Physical & Health Sciences | 0 | 0.0% |
| Psychology | 0 | 0.0% |
| Social Sciences | 2 | 13.3% |
| Engineering | 0 | 0.0% |
| Multidisciplinary Studies | 0 | 0.0% |
| Science & Technology | 0 | 0.0% |
| Business | 6 | 40.0% |
| Education | 4 | 26.7% |
| Literature & Languages | 0 | 0.0% |
| Liberal Arts & History | 0 | 0.0% |
| Visual & Performing Arts | 0 | 0.0% |
| Communications | 2 | 13.3% |
| Arts & Humanities | 1 | 6.7% |
| Total | 15 | 100.0% |
Transportation & Commute in Galesburg
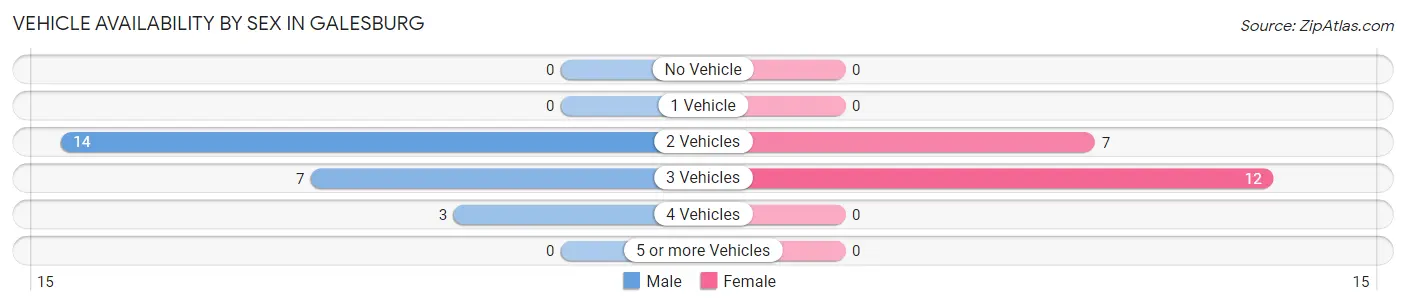
Vehicle Availability by Sex in Galesburg
The most prevalent vehicle ownership categories in Galesburg are males with 2 vehicles (14, accounting for 58.3%) and females with 2 vehicles (7, making up 73.7%).
| Vehicles Available | Male | Female |
| No Vehicle | 0 (0.0%) | 0 (0.0%) |
| 1 Vehicle | 0 (0.0%) | 0 (0.0%) |
| 2 Vehicles | 14 (58.3%) | 7 (36.8%) |
| 3 Vehicles | 7 (29.2%) | 12 (63.2%) |
| 4 Vehicles | 3 (12.5%) | 0 (0.0%) |
| 5 or more Vehicles | 0 (0.0%) | 0 (0.0%) |
| Total | 24 (100.0%) | 19 (100.0%) |
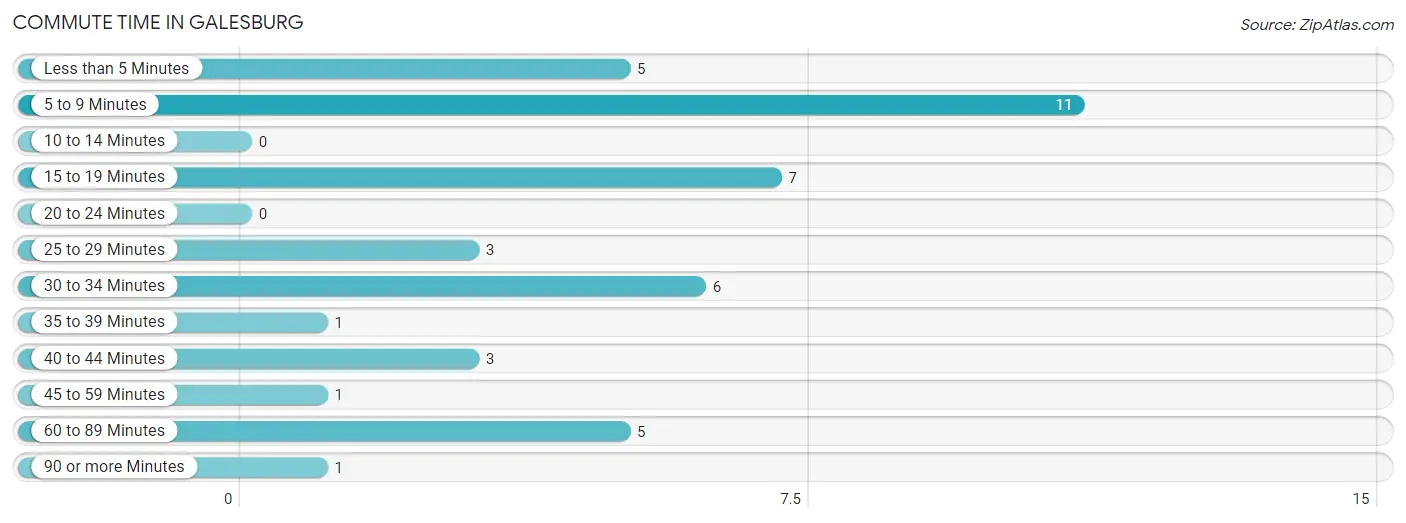
Commute Time in Galesburg
The most frequently occuring commute durations in Galesburg are 5 to 9 minutes (11 commuters, 25.6%), 15 to 19 minutes (7 commuters, 16.3%), and 30 to 34 minutes (6 commuters, 14.0%).
| Commute Time | # Commuters | % Commuters |
| Less than 5 Minutes | 5 | 11.6% |
| 5 to 9 Minutes | 11 | 25.6% |
| 10 to 14 Minutes | 0 | 0.0% |
| 15 to 19 Minutes | 7 | 16.3% |
| 20 to 24 Minutes | 0 | 0.0% |
| 25 to 29 Minutes | 3 | 7.0% |
| 30 to 34 Minutes | 6 | 14.0% |
| 35 to 39 Minutes | 1 | 2.3% |
| 40 to 44 Minutes | 3 | 7.0% |
| 45 to 59 Minutes | 1 | 2.3% |
| 60 to 89 Minutes | 5 | 11.6% |
| 90 or more Minutes | 1 | 2.3% |
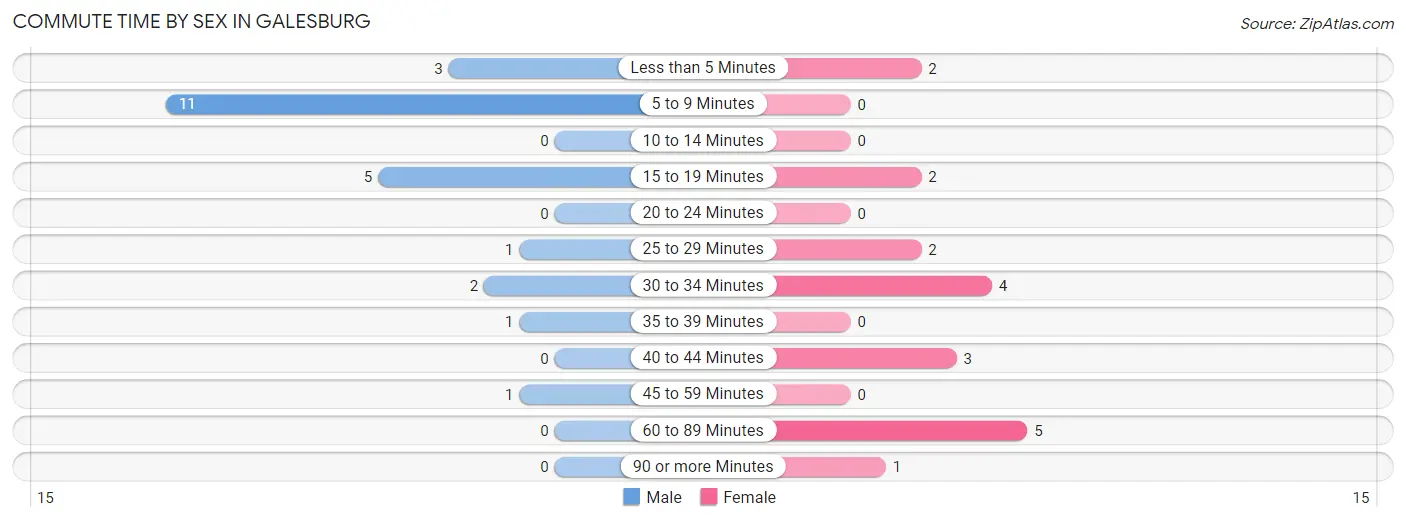
Commute Time by Sex in Galesburg
The most common commute times in Galesburg are 5 to 9 minutes (11 commuters, 45.8%) for males and 60 to 89 minutes (5 commuters, 26.3%) for females.
| Commute Time | Male | Female |
| Less than 5 Minutes | 3 (12.5%) | 2 (10.5%) |
| 5 to 9 Minutes | 11 (45.8%) | 0 (0.0%) |
| 10 to 14 Minutes | 0 (0.0%) | 0 (0.0%) |
| 15 to 19 Minutes | 5 (20.8%) | 2 (10.5%) |
| 20 to 24 Minutes | 0 (0.0%) | 0 (0.0%) |
| 25 to 29 Minutes | 1 (4.2%) | 2 (10.5%) |
| 30 to 34 Minutes | 2 (8.3%) | 4 (21.0%) |
| 35 to 39 Minutes | 1 (4.2%) | 0 (0.0%) |
| 40 to 44 Minutes | 0 (0.0%) | 3 (15.8%) |
| 45 to 59 Minutes | 1 (4.2%) | 0 (0.0%) |
| 60 to 89 Minutes | 0 (0.0%) | 5 (26.3%) |
| 90 or more Minutes | 0 (0.0%) | 1 (5.3%) |
Time of Departure to Work by Sex in Galesburg
The most frequent times of departure to work in Galesburg are 5:30 AM to 5:59 AM (10, 41.7%) for males and 5:30 AM to 5:59 AM (7, 36.8%) for females.
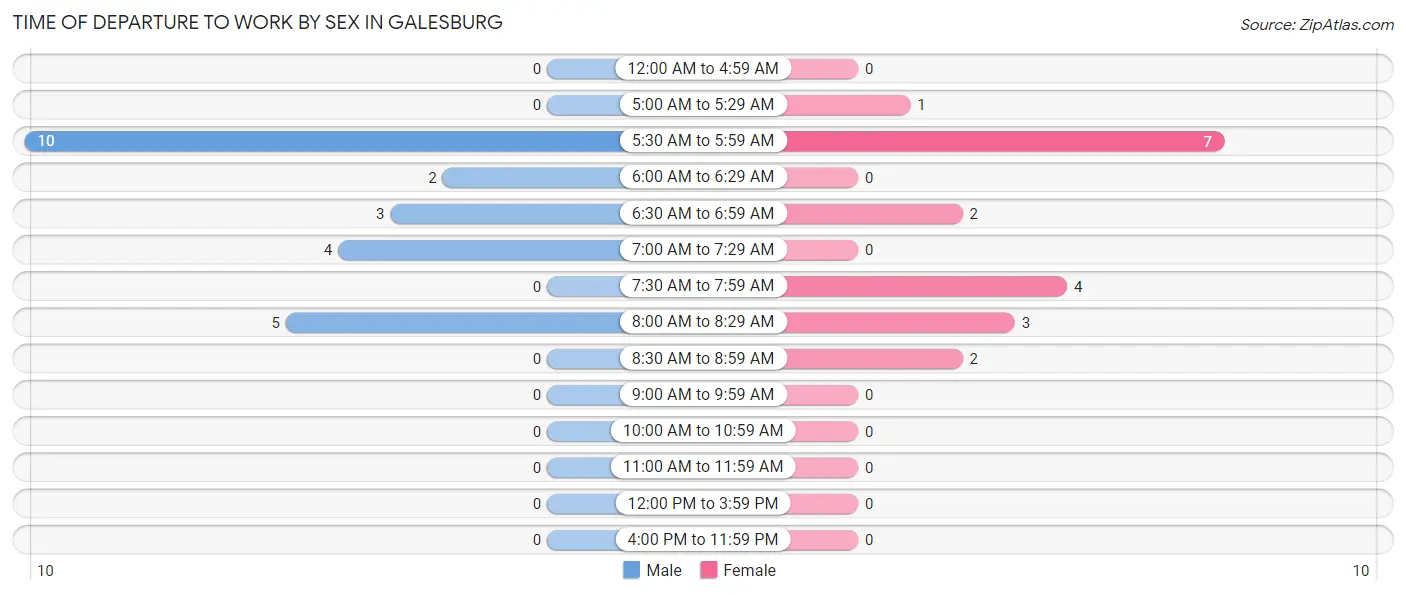
| Time of Departure | Male | Female |
| 12:00 AM to 4:59 AM | 0 (0.0%) | 0 (0.0%) |
| 5:00 AM to 5:29 AM | 0 (0.0%) | 1 (5.3%) |
| 5:30 AM to 5:59 AM | 10 (41.7%) | 7 (36.8%) |
| 6:00 AM to 6:29 AM | 2 (8.3%) | 0 (0.0%) |
| 6:30 AM to 6:59 AM | 3 (12.5%) | 2 (10.5%) |
| 7:00 AM to 7:29 AM | 4 (16.7%) | 0 (0.0%) |
| 7:30 AM to 7:59 AM | 0 (0.0%) | 4 (21.0%) |
| 8:00 AM to 8:29 AM | 5 (20.8%) | 3 (15.8%) |
| 8:30 AM to 8:59 AM | 0 (0.0%) | 2 (10.5%) |
| 9:00 AM to 9:59 AM | 0 (0.0%) | 0 (0.0%) |
| 10:00 AM to 10:59 AM | 0 (0.0%) | 0 (0.0%) |
| 11:00 AM to 11:59 AM | 0 (0.0%) | 0 (0.0%) |
| 12:00 PM to 3:59 PM | 0 (0.0%) | 0 (0.0%) |
| 4:00 PM to 11:59 PM | 0 (0.0%) | 0 (0.0%) |
| Total | 24 (100.0%) | 19 (100.0%) |
Housing Occupancy in Galesburg
Occupancy by Ownership in Galesburg
Of the total 34 dwellings in Galesburg, owner-occupied units account for 30 (88.2%), while renter-occupied units make up 4 (11.8%).
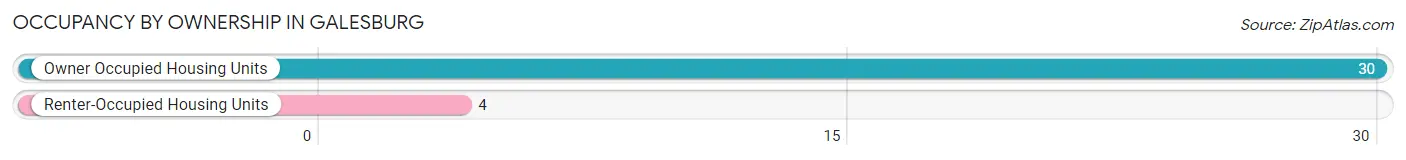
| Occupancy | # Housing Units | % Housing Units |
| Owner Occupied Housing Units | 30 | 88.2% |
| Renter-Occupied Housing Units | 4 | 11.8% |
| Total Occupied Housing Units | 34 | 100.0% |
Occupancy by Household Size in Galesburg
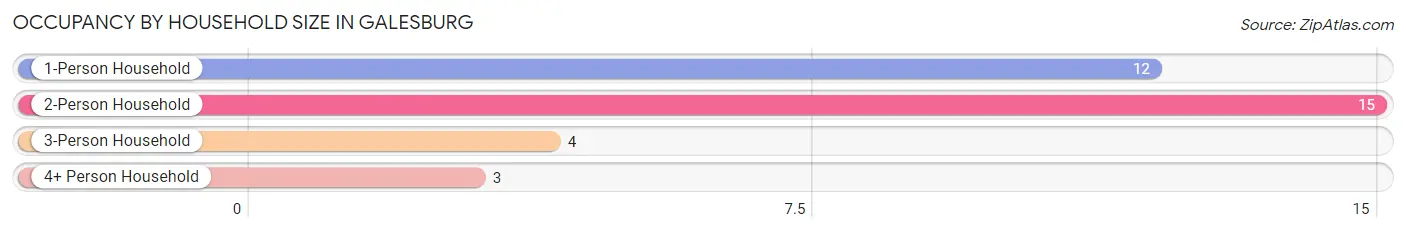
| Household Size | # Housing Units | % Housing Units |
| 1-Person Household | 12 | 35.3% |
| 2-Person Household | 15 | 44.1% |
| 3-Person Household | 4 | 11.8% |
| 4+ Person Household | 3 | 8.8% |
| Total Housing Units | 34 | 100.0% |
Occupancy by Ownership by Household Size in Galesburg
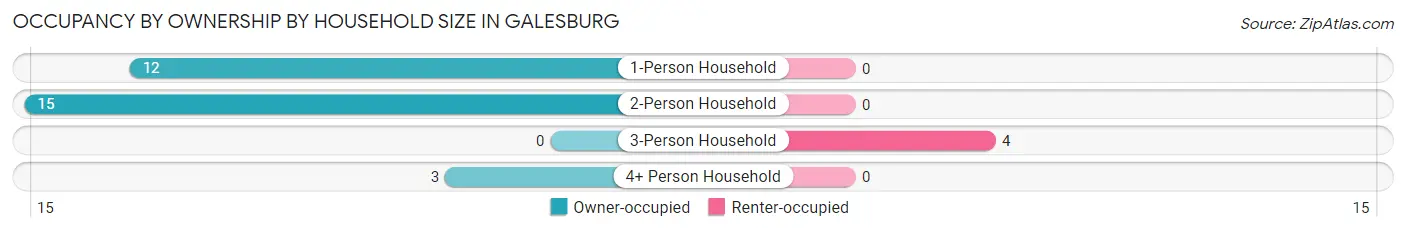
| Household Size | Owner-occupied | Renter-occupied |
| 1-Person Household | 12 (100.0%) | 0 (0.0%) |
| 2-Person Household | 15 (100.0%) | 0 (0.0%) |
| 3-Person Household | 0 (0.0%) | 4 (100.0%) |
| 4+ Person Household | 3 (100.0%) | 0 (0.0%) |
| Total Housing Units | 30 (88.2%) | 4 (11.8%) |
Occupancy by Educational Attainment in Galesburg
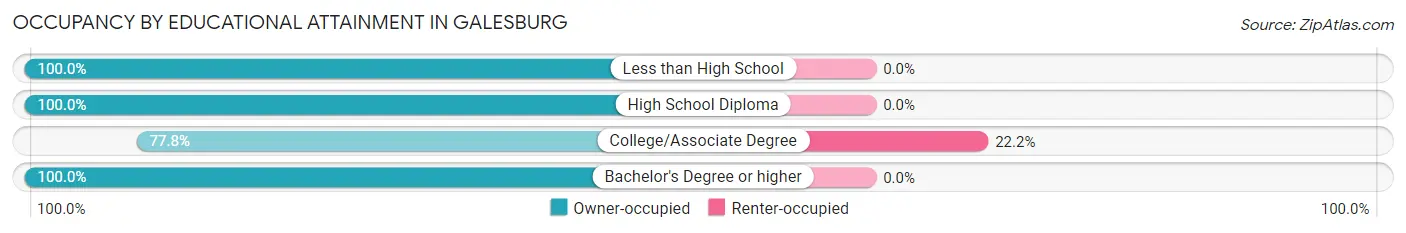
| Household Size | Owner-occupied | Renter-occupied |
| Less than High School | 4 (100.0%) | 0 (0.0%) |
| High School Diploma | 5 (100.0%) | 0 (0.0%) |
| College/Associate Degree | 14 (77.8%) | 4 (22.2%) |
| Bachelor's Degree or higher | 7 (100.0%) | 0 (0.0%) |
Occupancy by Age of Householder in Galesburg
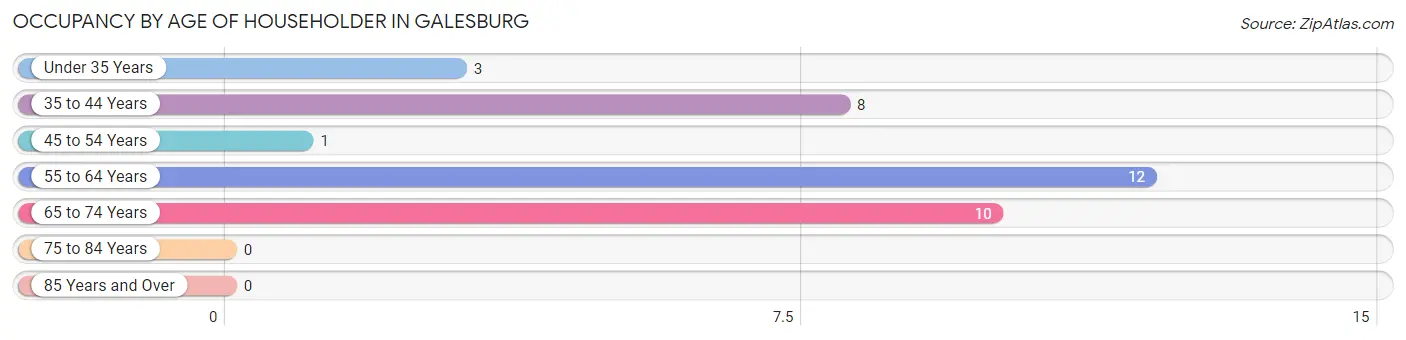
| Age Bracket | # Households | % Households |
| Under 35 Years | 3 | 8.8% |
| 35 to 44 Years | 8 | 23.5% |
| 45 to 54 Years | 1 | 2.9% |
| 55 to 64 Years | 12 | 35.3% |
| 65 to 74 Years | 10 | 29.4% |
| 75 to 84 Years | 0 | 0.0% |
| 85 Years and Over | 0 | 0.0% |
| Total | 34 | 100.0% |
Housing Finances in Galesburg
Median Income by Occupancy in Galesburg
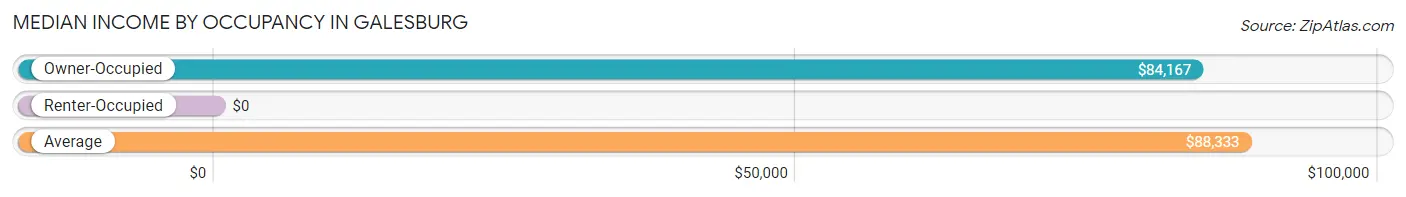
| Occupancy Type | # Households | Median Income |
| Owner-Occupied | 30 (88.2%) | $84,167 |
| Renter-Occupied | 4 (11.8%) | $0 |
| Average | 34 (100.0%) | $88,333 |
Occupancy by Householder Income Bracket in Galesburg
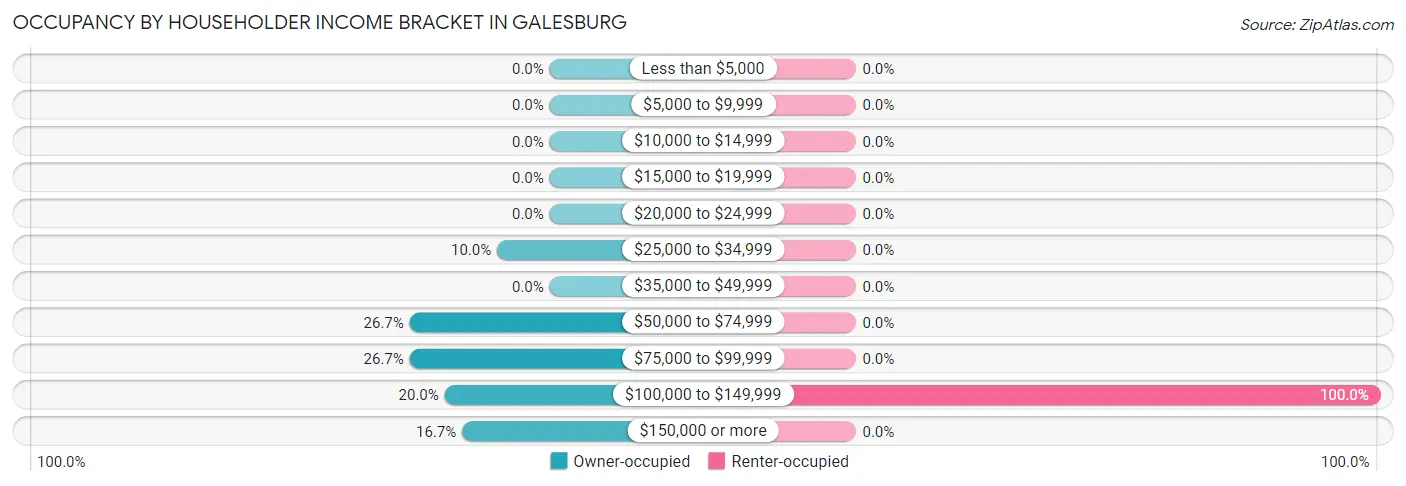
| Income Bracket | Owner-occupied | Renter-occupied |
| Less than $5,000 | 0 (0.0%) | 0 (0.0%) |
| $5,000 to $9,999 | 0 (0.0%) | 0 (0.0%) |
| $10,000 to $14,999 | 0 (0.0%) | 0 (0.0%) |
| $15,000 to $19,999 | 0 (0.0%) | 0 (0.0%) |
| $20,000 to $24,999 | 0 (0.0%) | 0 (0.0%) |
| $25,000 to $34,999 | 3 (10.0%) | 0 (0.0%) |
| $35,000 to $49,999 | 0 (0.0%) | 0 (0.0%) |
| $50,000 to $74,999 | 8 (26.7%) | 0 (0.0%) |
| $75,000 to $99,999 | 8 (26.7%) | 0 (0.0%) |
| $100,000 to $149,999 | 6 (20.0%) | 4 (100.0%) |
| $150,000 or more | 5 (16.7%) | 0 (0.0%) |
| Total | 30 (100.0%) | 4 (100.0%) |
Monthly Housing Cost Tiers in Galesburg
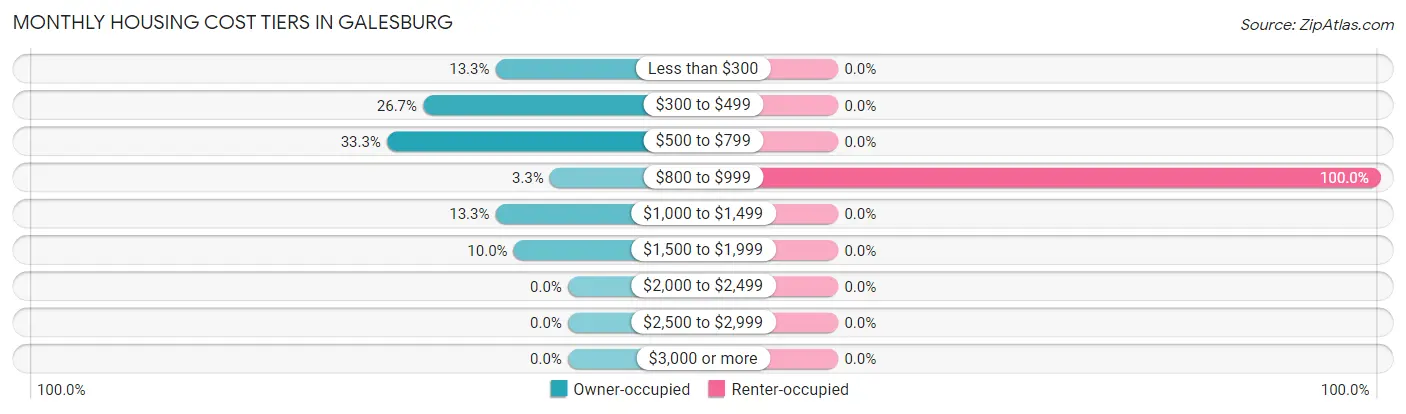
| Monthly Cost | Owner-occupied | Renter-occupied |
| Less than $300 | 4 (13.3%) | 0 (0.0%) |
| $300 to $499 | 8 (26.7%) | 0 (0.0%) |
| $500 to $799 | 10 (33.3%) | 0 (0.0%) |
| $800 to $999 | 1 (3.3%) | 4 (100.0%) |
| $1,000 to $1,499 | 4 (13.3%) | 0 (0.0%) |
| $1,500 to $1,999 | 3 (10.0%) | 0 (0.0%) |
| $2,000 to $2,499 | 0 (0.0%) | 0 (0.0%) |
| $2,500 to $2,999 | 0 (0.0%) | 0 (0.0%) |
| $3,000 or more | 0 (0.0%) | 0 (0.0%) |
| Total | 30 (100.0%) | 4 (100.0%) |
Physical Housing Characteristics in Galesburg
Housing Structures in Galesburg
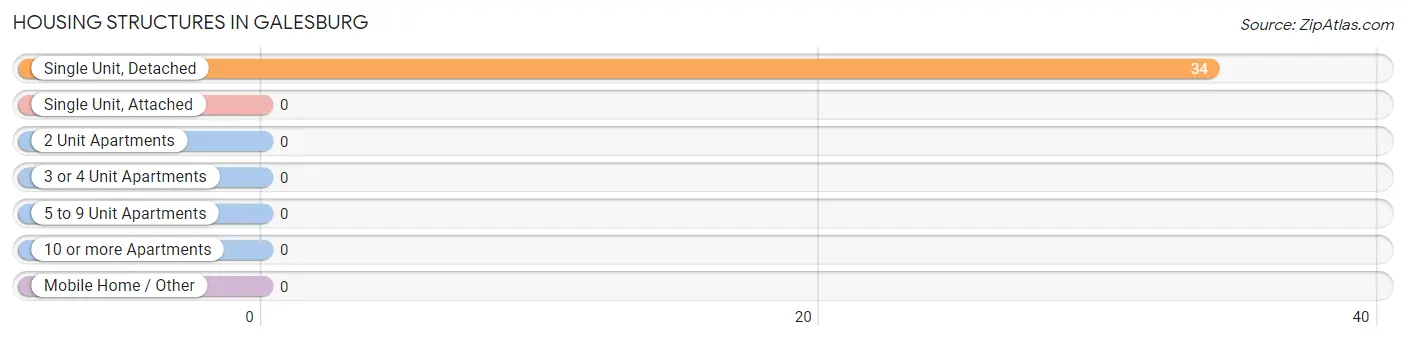
| Structure Type | # Housing Units | % Housing Units |
| Single Unit, Detached | 34 | 100.0% |
| Single Unit, Attached | 0 | 0.0% |
| 2 Unit Apartments | 0 | 0.0% |
| 3 or 4 Unit Apartments | 0 | 0.0% |
| 5 to 9 Unit Apartments | 0 | 0.0% |
| 10 or more Apartments | 0 | 0.0% |
| Mobile Home / Other | 0 | 0.0% |
| Total | 34 | 100.0% |
Housing Structures by Occupancy in Galesburg
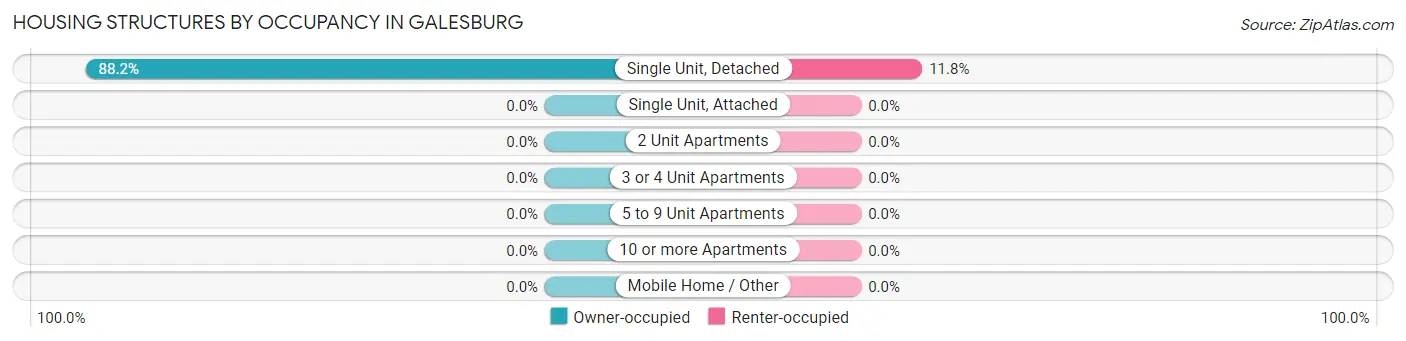
| Structure Type | Owner-occupied | Renter-occupied |
| Single Unit, Detached | 30 (88.2%) | 4 (11.8%) |
| Single Unit, Attached | 0 (0.0%) | 0 (0.0%) |
| 2 Unit Apartments | 0 (0.0%) | 0 (0.0%) |
| 3 or 4 Unit Apartments | 0 (0.0%) | 0 (0.0%) |
| 5 to 9 Unit Apartments | 0 (0.0%) | 0 (0.0%) |
| 10 or more Apartments | 0 (0.0%) | 0 (0.0%) |
| Mobile Home / Other | 0 (0.0%) | 0 (0.0%) |
| Total | 30 (88.2%) | 4 (11.8%) |
Housing Structures by Number of Rooms in Galesburg
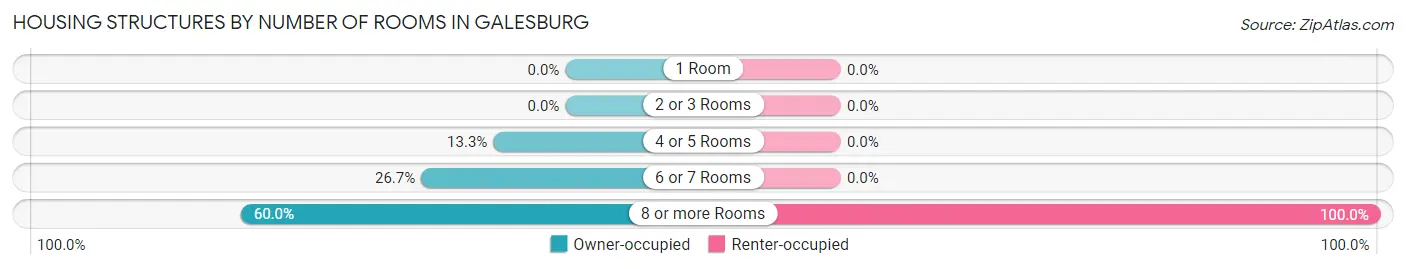
| Number of Rooms | Owner-occupied | Renter-occupied |
| 1 Room | 0 (0.0%) | 0 (0.0%) |
| 2 or 3 Rooms | 0 (0.0%) | 0 (0.0%) |
| 4 or 5 Rooms | 4 (13.3%) | 0 (0.0%) |
| 6 or 7 Rooms | 8 (26.7%) | 0 (0.0%) |
| 8 or more Rooms | 18 (60.0%) | 4 (100.0%) |
| Total | 30 (100.0%) | 4 (100.0%) |
Housing Structure by Heating Type in Galesburg
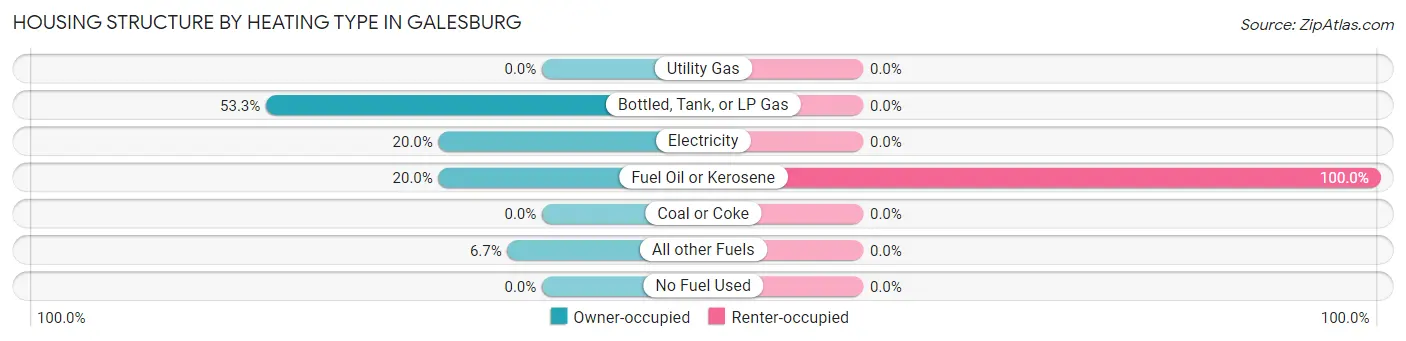
| Heating Type | Owner-occupied | Renter-occupied |
| Utility Gas | 0 (0.0%) | 0 (0.0%) |
| Bottled, Tank, or LP Gas | 16 (53.3%) | 0 (0.0%) |
| Electricity | 6 (20.0%) | 0 (0.0%) |
| Fuel Oil or Kerosene | 6 (20.0%) | 4 (100.0%) |
| Coal or Coke | 0 (0.0%) | 0 (0.0%) |
| All other Fuels | 2 (6.7%) | 0 (0.0%) |
| No Fuel Used | 0 (0.0%) | 0 (0.0%) |
| Total | 30 (100.0%) | 4 (100.0%) |
Household Vehicle Usage in Galesburg
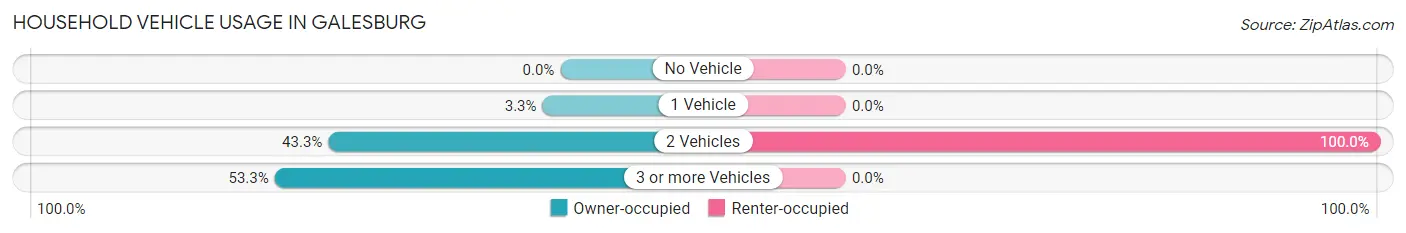
| Vehicles per Household | Owner-occupied | Renter-occupied |
| No Vehicle | 0 (0.0%) | 0 (0.0%) |
| 1 Vehicle | 1 (3.3%) | 0 (0.0%) |
| 2 Vehicles | 13 (43.3%) | 4 (100.0%) |
| 3 or more Vehicles | 16 (53.3%) | 0 (0.0%) |
| Total | 30 (100.0%) | 4 (100.0%) |
Real Estate & Mortgages in Galesburg
Real Estate and Mortgage Overview in Galesburg
| Characteristic | Without Mortgage | With Mortgage |
| Housing Units | 24 | 6 |
| Median Property Value | $80,000 | $162,500 |
| Median Household Income | $83,333 | $1 |
| Monthly Housing Costs | $500 | $0 |
| Real Estate Taxes | - | - |
Property Value by Mortgage Status in Galesburg
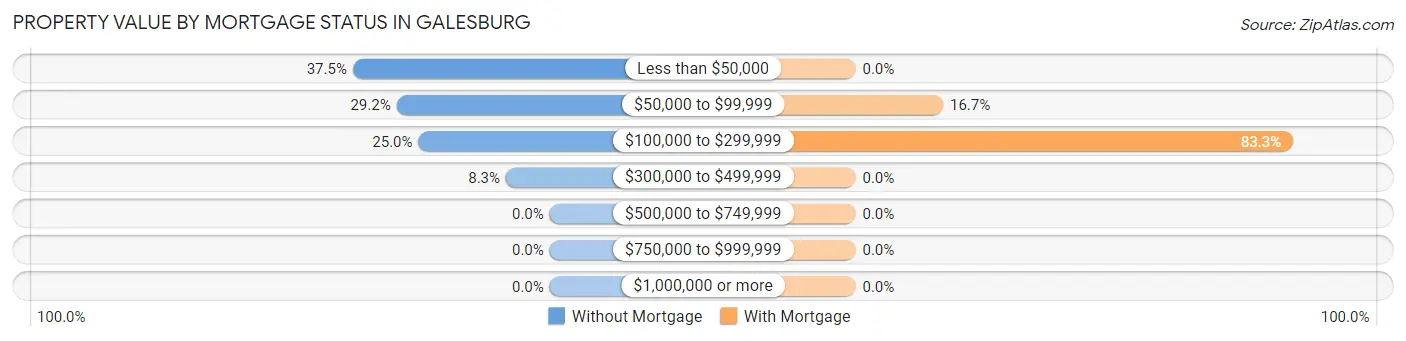
| Property Value | Without Mortgage | With Mortgage |
| Less than $50,000 | 9 (37.5%) | 0 (0.0%) |
| $50,000 to $99,999 | 7 (29.2%) | 1 (16.7%) |
| $100,000 to $299,999 | 6 (25.0%) | 5 (83.3%) |
| $300,000 to $499,999 | 2 (8.3%) | 0 (0.0%) |
| $500,000 to $749,999 | 0 (0.0%) | 0 (0.0%) |
| $750,000 to $999,999 | 0 (0.0%) | 0 (0.0%) |
| $1,000,000 or more | 0 (0.0%) | 0 (0.0%) |
| Total | 24 (100.0%) | 6 (100.0%) |
Household Income by Mortgage Status in Galesburg
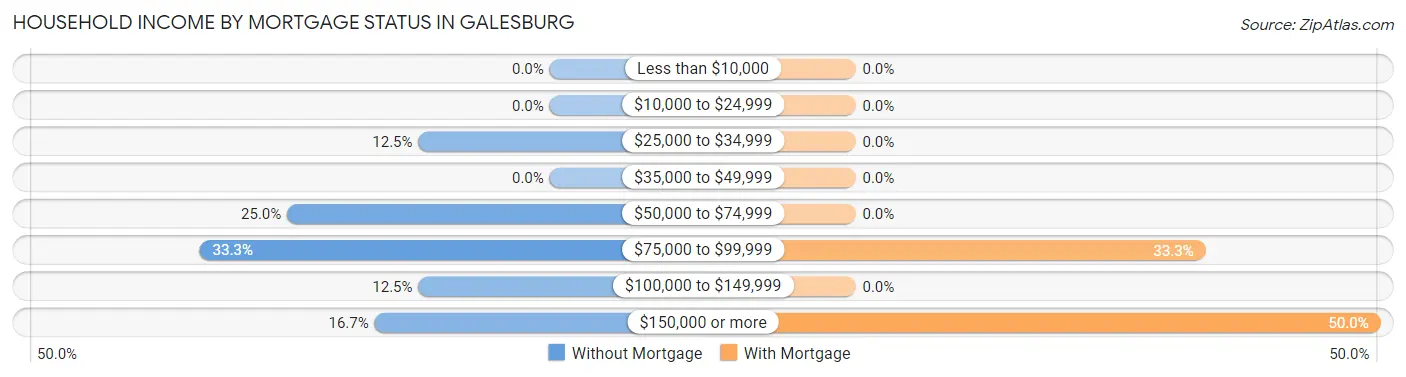
| Household Income | Without Mortgage | With Mortgage |
| Less than $10,000 | 0 (0.0%) | 0 (0.0%) |
| $10,000 to $24,999 | 0 (0.0%) | 0 (0.0%) |
| $25,000 to $34,999 | 3 (12.5%) | 0 (0.0%) |
| $35,000 to $49,999 | 0 (0.0%) | 0 (0.0%) |
| $50,000 to $74,999 | 6 (25.0%) | 0 (0.0%) |
| $75,000 to $99,999 | 8 (33.3%) | 2 (33.3%) |
| $100,000 to $149,999 | 3 (12.5%) | 0 (0.0%) |
| $150,000 or more | 4 (16.7%) | 3 (50.0%) |
| Total | 24 (100.0%) | 6 (100.0%) |
Property Value to Household Income Ratio in Galesburg
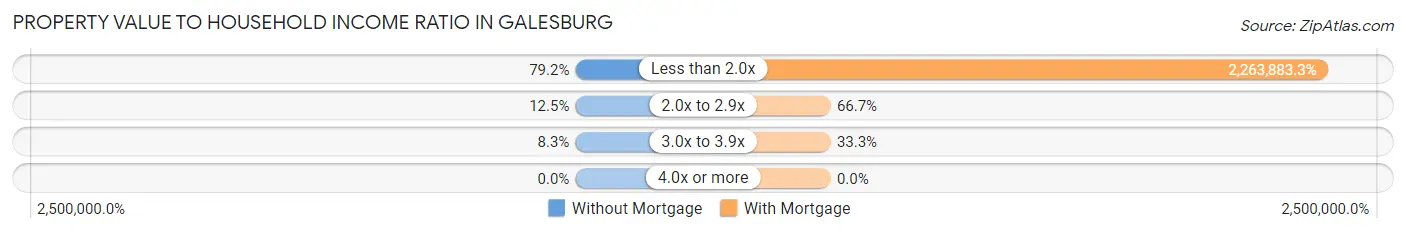
| Value-to-Income Ratio | Without Mortgage | With Mortgage |
| Less than 2.0x | 19 (79.2%) | 135,833 (2,263,883.3%) |
| 2.0x to 2.9x | 3 (12.5%) | 4 (66.7%) |
| 3.0x to 3.9x | 2 (8.3%) | 2 (33.3%) |
| 4.0x or more | 0 (0.0%) | 0 (0.0%) |
| Total | 24 (100.0%) | 6 (100.0%) |
Real Estate Taxes by Mortgage Status in Galesburg
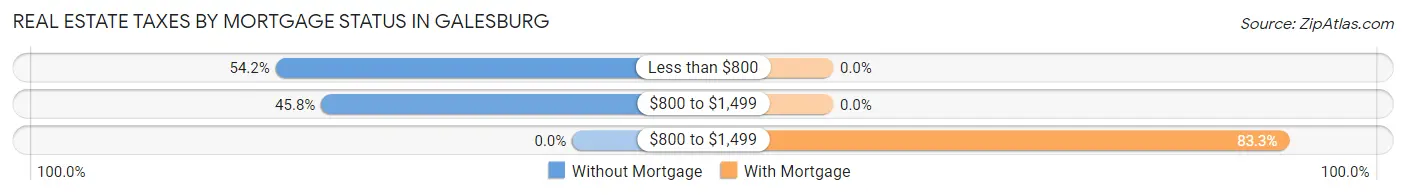
| Property Taxes | Without Mortgage | With Mortgage |
| Less than $800 | 13 (54.2%) | 0 (0.0%) |
| $800 to $1,499 | 11 (45.8%) | 0 (0.0%) |
| $800 to $1,499 | 0 (0.0%) | 5 (83.3%) |
| Total | 24 (100.0%) | 6 (100.0%) |
Health & Disability in Galesburg
Health Insurance Coverage by Age in Galesburg
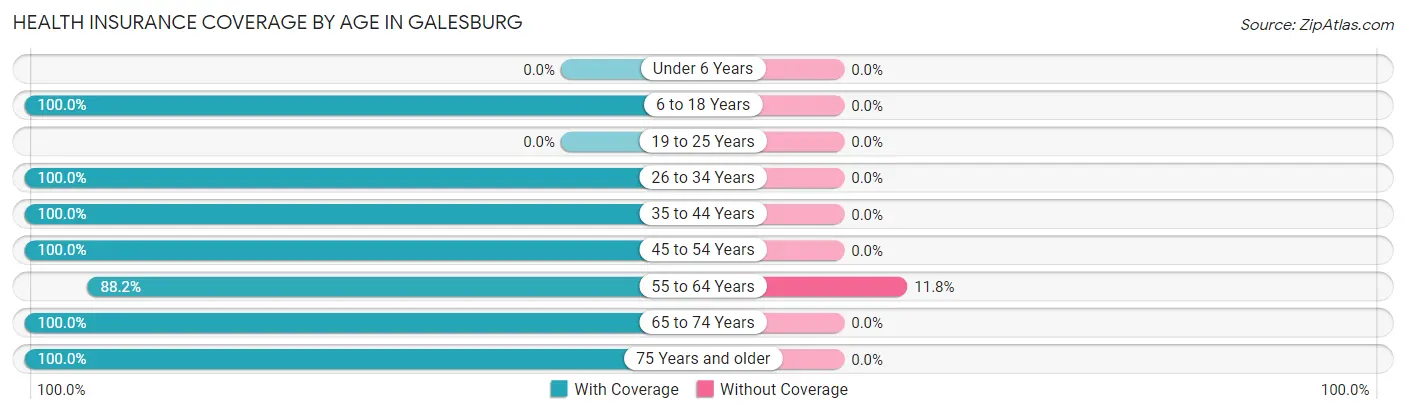
| Age Bracket | With Coverage | Without Coverage |
| Under 6 Years | 0 (0.0%) | 0 (0.0%) |
| 6 to 18 Years | 9 (100.0%) | 0 (0.0%) |
| 19 to 25 Years | 0 (0.0%) | 0 (0.0%) |
| 26 to 34 Years | 5 (100.0%) | 0 (0.0%) |
| 35 to 44 Years | 10 (100.0%) | 0 (0.0%) |
| 45 to 54 Years | 7 (100.0%) | 0 (0.0%) |
| 55 to 64 Years | 15 (88.2%) | 2 (11.8%) |
| 65 to 74 Years | 14 (100.0%) | 0 (0.0%) |
| 75 Years and older | 1 (100.0%) | 0 (0.0%) |
| Total | 61 (96.8%) | 2 (3.2%) |
Health Insurance Coverage by Citizenship Status in Galesburg
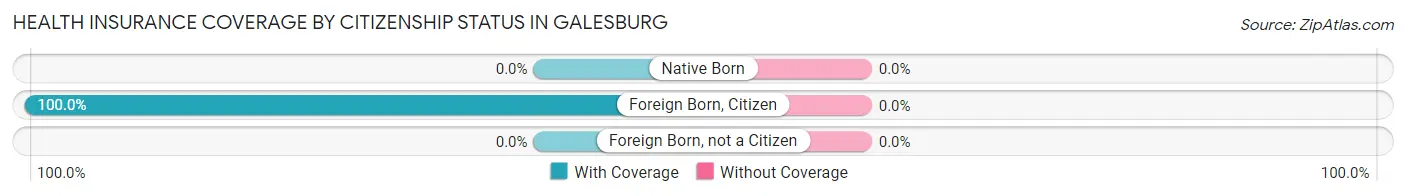
| Citizenship Status | With Coverage | Without Coverage |
| Native Born | 0 (0.0%) | 0 (0.0%) |
| Foreign Born, Citizen | 9 (100.0%) | 0 (0.0%) |
| Foreign Born, not a Citizen | 0 (0.0%) | 0 (0.0%) |
Health Insurance Coverage by Household Income in Galesburg
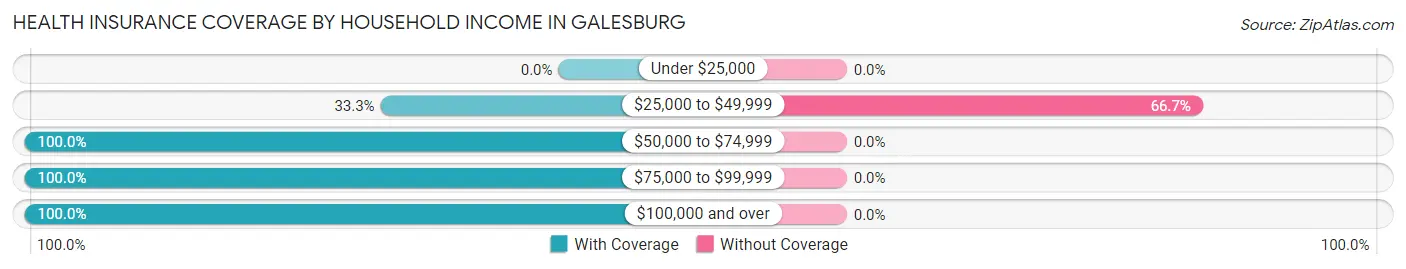
| Household Income | With Coverage | Without Coverage |
| Under $25,000 | 0 (0.0%) | 0 (0.0%) |
| $25,000 to $49,999 | 1 (33.3%) | 2 (66.7%) |
| $50,000 to $74,999 | 10 (100.0%) | 0 (0.0%) |
| $75,000 to $99,999 | 18 (100.0%) | 0 (0.0%) |
| $100,000 and over | 32 (100.0%) | 0 (0.0%) |
Public vs Private Health Insurance Coverage by Age in Galesburg
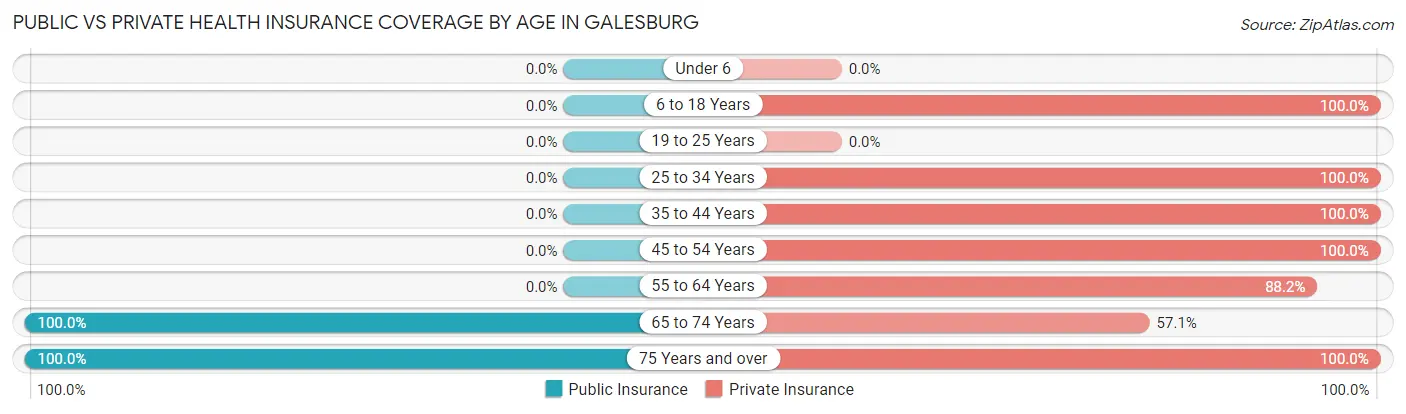
| Age Bracket | Public Insurance | Private Insurance |
| Under 6 | 0 (0.0%) | 0 (0.0%) |
| 6 to 18 Years | 0 (0.0%) | 9 (100.0%) |
| 19 to 25 Years | 0 (0.0%) | 0 (0.0%) |
| 25 to 34 Years | 0 (0.0%) | 5 (100.0%) |
| 35 to 44 Years | 0 (0.0%) | 10 (100.0%) |
| 45 to 54 Years | 0 (0.0%) | 7 (100.0%) |
| 55 to 64 Years | 0 (0.0%) | 15 (88.2%) |
| 65 to 74 Years | 14 (100.0%) | 8 (57.1%) |
| 75 Years and over | 1 (100.0%) | 1 (100.0%) |
| Total | 15 (23.8%) | 55 (87.3%) |
Disability Status by Sex by Age in Galesburg
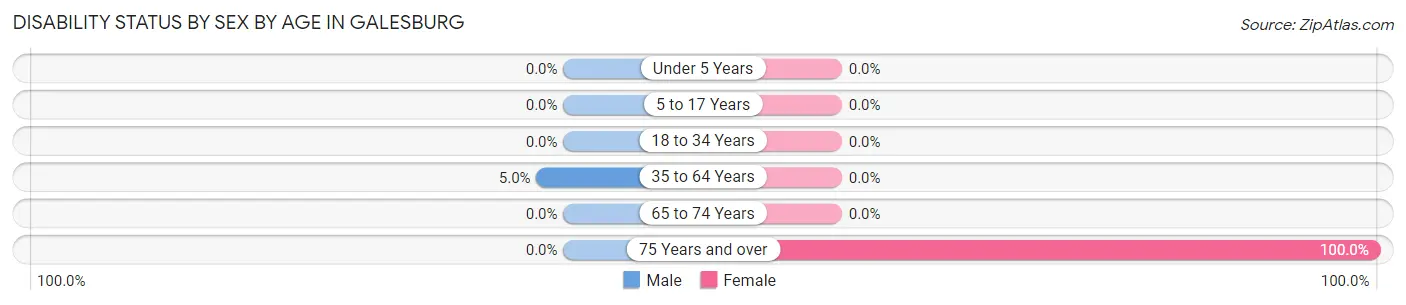
| Age Bracket | Male | Female |
| Under 5 Years | 0 (0.0%) | 0 (0.0%) |
| 5 to 17 Years | 0 (0.0%) | 0 (0.0%) |
| 18 to 34 Years | 0 (0.0%) | 0 (0.0%) |
| 35 to 64 Years | 1 (5.0%) | 0 (0.0%) |
| 65 to 74 Years | 0 (0.0%) | 0 (0.0%) |
| 75 Years and over | 0 (0.0%) | 1 (100.0%) |
Disability Class by Sex by Age in Galesburg
Disability Class: Hearing Difficulty
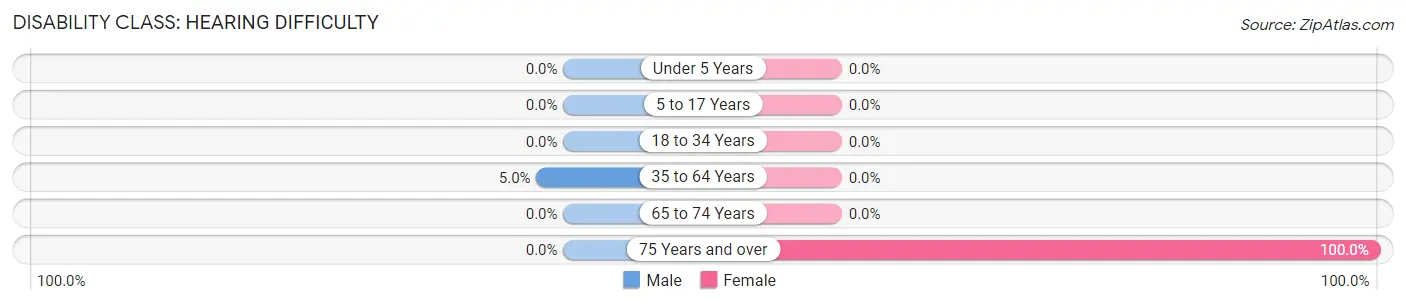
| Age Bracket | Male | Female |
| Under 5 Years | 0 (0.0%) | 0 (0.0%) |
| 5 to 17 Years | 0 (0.0%) | 0 (0.0%) |
| 18 to 34 Years | 0 (0.0%) | 0 (0.0%) |
| 35 to 64 Years | 1 (5.0%) | 0 (0.0%) |
| 65 to 74 Years | 0 (0.0%) | 0 (0.0%) |
| 75 Years and over | 0 (0.0%) | 1 (100.0%) |
Disability Class: Vision Difficulty
| Age Bracket | Male | Female |
| Under 5 Years | 0 (0.0%) | 0 (0.0%) |
| 5 to 17 Years | 0 (0.0%) | 0 (0.0%) |
| 18 to 34 Years | 0 (0.0%) | 0 (0.0%) |
| 35 to 64 Years | 0 (0.0%) | 0 (0.0%) |
| 65 to 74 Years | 0 (0.0%) | 0 (0.0%) |
| 75 Years and over | 0 (0.0%) | 0 (0.0%) |
Disability Class: Cognitive Difficulty

| Age Bracket | Male | Female |
| 5 to 17 Years | 0 (0.0%) | 0 (0.0%) |
| 18 to 34 Years | 0 (0.0%) | 0 (0.0%) |
| 35 to 64 Years | 0 (0.0%) | 0 (0.0%) |
| 65 to 74 Years | 0 (0.0%) | 0 (0.0%) |
| 75 Years and over | 0 (0.0%) | 0 (0.0%) |
Disability Class: Ambulatory Difficulty
| Age Bracket | Male | Female |
| 5 to 17 Years | 0 (0.0%) | 0 (0.0%) |
| 18 to 34 Years | 0 (0.0%) | 0 (0.0%) |
| 35 to 64 Years | 0 (0.0%) | 0 (0.0%) |
| 65 to 74 Years | 0 (0.0%) | 0 (0.0%) |
| 75 Years and over | 0 (0.0%) | 0 (0.0%) |
Disability Class: Self-Care Difficulty
| Age Bracket | Male | Female |
| 5 to 17 Years | 0 (0.0%) | 0 (0.0%) |
| 18 to 34 Years | 0 (0.0%) | 0 (0.0%) |
| 35 to 64 Years | 0 (0.0%) | 0 (0.0%) |
| 65 to 74 Years | 0 (0.0%) | 0 (0.0%) |
| 75 Years and over | 0 (0.0%) | 0 (0.0%) |
Technology Access in Galesburg
Computing Device Access in Galesburg
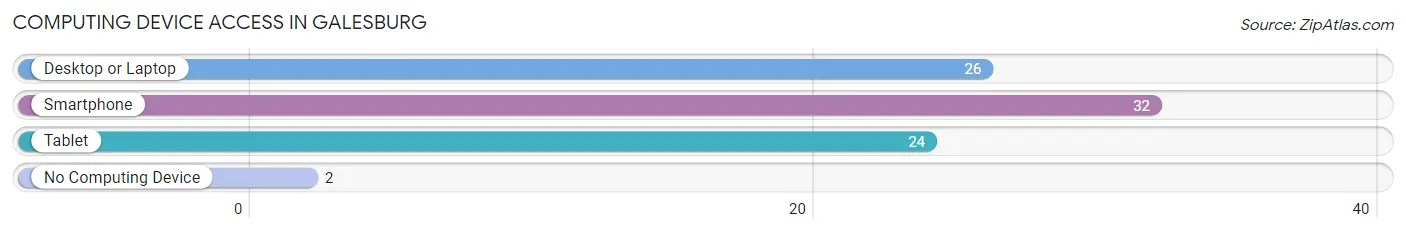
| Device Type | # Households | % Households |
| Desktop or Laptop | 26 | 76.5% |
| Smartphone | 32 | 94.1% |
| Tablet | 24 | 70.6% |
| No Computing Device | 2 | 5.9% |
| Total | 34 | 100.0% |
Internet Access in Galesburg
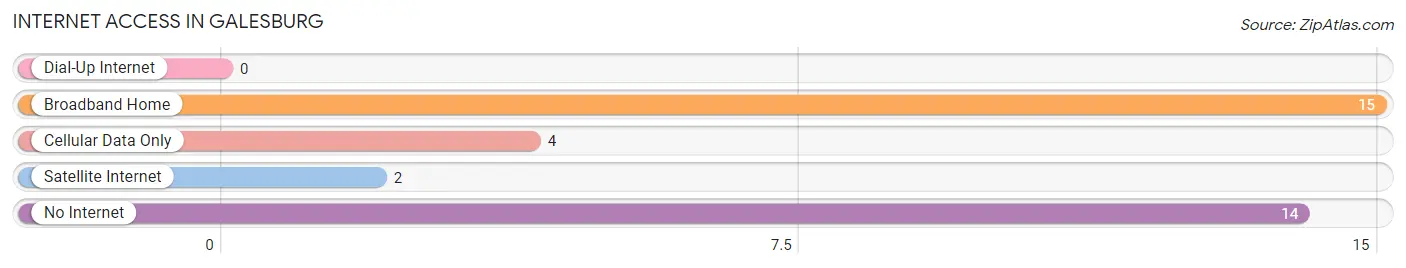
| Internet Type | # Households | % Households |
| Dial-Up Internet | 0 | 0.0% |
| Broadband Home | 15 | 44.1% |
| Cellular Data Only | 4 | 11.8% |
| Satellite Internet | 2 | 5.9% |
| No Internet | 14 | 41.2% |
| Total | 34 | 100.0% |
Galesburg Summary
Galesburg is a small city located in the state of North Dakota, United States. It is located in the southeastern corner of the state, in the Red River Valley. The city is situated on the banks of the Red River, and is part of the Grand Forks metropolitan area. The population of Galesburg was estimated to be 1,845 in 2019.
History
Galesburg was founded in 1881 by a group of settlers from Sweden. The settlers named the town after their hometown of Galesburg, Illinois. The town was originally a farming community, and the settlers grew wheat, oats, and barley. The town was incorporated in 1883, and the first mayor was John A. Johnson.
In the early 1900s, Galesburg began to grow and develop. The town was connected to the Great Northern Railway in 1906, and the railroad brought new businesses and industries to the area. The town also became a center for the lumber industry, and several sawmills were built in the area.
In the 1950s, Galesburg began to experience a population decline. The railroad closed in the 1960s, and many of the businesses and industries in the area closed as well. The population of Galesburg continued to decline until the 1990s, when the town began to experience a resurgence.
Geography
Galesburg is located in the southeastern corner of North Dakota, in the Red River Valley. The city is situated on the banks of the Red River, and is part of the Grand Forks metropolitan area. The city is located about 25 miles south of Grand Forks, and about 50 miles north of Fargo.
The terrain around Galesburg is mostly flat, with some rolling hills. The city is located in a region of the state known as the Red River Valley, which is known for its fertile soil and abundant agricultural production.
Economy
Galesburg’s economy is largely based on agriculture. The city is located in a region of the state known for its fertile soil and abundant agricultural production. The city is home to several large farms, and the surrounding area is known for its production of wheat, oats, barley, and other grains.
The city is also home to several small businesses, including restaurants, retail stores, and service providers. The city is also home to a number of manufacturing companies, including a furniture factory and a plastics factory.
Demographics
Galesburg has a population of 1,845, according to the 2019 census. The population is predominantly white, with about 95% of the population identifying as white. The median age of the population is 44.7 years, and the median household income is $45,845.
The city is home to a number of religious organizations, including Lutheran, Catholic, and Methodist churches. The city is also home to a number of cultural organizations, including the Galesburg Historical Society and the Galesburg Arts Council.
Conclusion
Galesburg is a small city located in the southeastern corner of North Dakota. The city was founded in 1881 by a group of settlers from Sweden, and it has since become a center for agriculture and small businesses. The city has a population of 1,845, and the median age of the population is 44.7 years. The city is home to a number of religious and cultural organizations, and it is part of the Grand Forks metropolitan area.
Common Questions
What is Per Capita Income in Galesburg?
Per Capita income in Galesburg is $58,708.
What is the Median Family Income in Galesburg?
Median Family Income in Galesburg is $123,542.
What is the Median Household income in Galesburg?
Median Household Income in Galesburg is $88,333.
What is Income or Wage Gap in Galesburg?
Income or Wage Gap in Galesburg is 27.8%.
Women in Galesburg earn 72.2 cents for every dollar earned by a man.
What is Inequality or Gini Index in Galesburg?
Inequality or Gini Index in Galesburg is 0.32.
What is the Total Population of Galesburg?
Total Population of Galesburg is 63.
What is the Total Male Population of Galesburg?
Total Male Population of Galesburg is 32.
What is the Total Female Population of Galesburg?
Total Female Population of Galesburg is 31.
What is the Ratio of Males per 100 Females in Galesburg?
There are 103.23 Males per 100 Females in Galesburg.
What is the Ratio of Females per 100 Males in Galesburg?
There are 96.88 Females per 100 Males in Galesburg.
What is the Median Population Age in Galesburg?
Median Population Age in Galesburg is 55.5 Years.
What is the Average Family Size in Galesburg
Average Family Size in Galesburg is 2.3 People.
What is the Average Household Size in Galesburg
Average Household Size in Galesburg is 1.9 People.
How Large is the Labor Force in Galesburg?
There are 43 People in the Labor Forcein in Galesburg.
What is the Percentage of People in the Labor Force in Galesburg?
79.6% of People are in the Labor Force in Galesburg.