Westhope, ND Map & Demographics
Westhope Map
Westhope Overview
$44,185
PER CAPITA INCOME
$89,375
AVG FAMILY INCOME
$66,667
AVG HOUSEHOLD INCOME
18.4%
WAGE / INCOME GAP [ % ]
81.6¢/ $1
WAGE / INCOME GAP [ $ ]
0.43
INEQUALITY / GINI INDEX
360
TOTAL POPULATION
165
MALE POPULATION
195
FEMALE POPULATION
84.62
MALES / 100 FEMALES
118.18
FEMALES / 100 MALES
54.9
MEDIAN AGE
3.5
AVG FAMILY SIZE
2.6
AVG HOUSEHOLD SIZE
187
LABOR FORCE [ PEOPLE ]
59.0%
PERCENT IN LABOR FORCE
Westhope Zip Codes
Westhope Area Codes
Income in Westhope
Income Overview in Westhope
Per Capita Income in Westhope is $44,185, while median incomes of families and households are $89,375 and $66,667 respectively.
| Characteristic | Number | Measure |
| Per Capita Income | 360 | $44,185 |
| Median Family Income | 81 | $89,375 |
| Mean Family Income | 81 | $122,340 |
| Median Household Income | 128 | $66,667 |
| Mean Household Income | 128 | $101,252 |
| Income Deficit | 81 | $0 |
| Wage / Income Gap (%) | 360 | 18.45% |
| Wage / Income Gap ($) | 360 | 81.55¢ per $1 |
| Gini / Inequality Index | 360 | 0.43 |
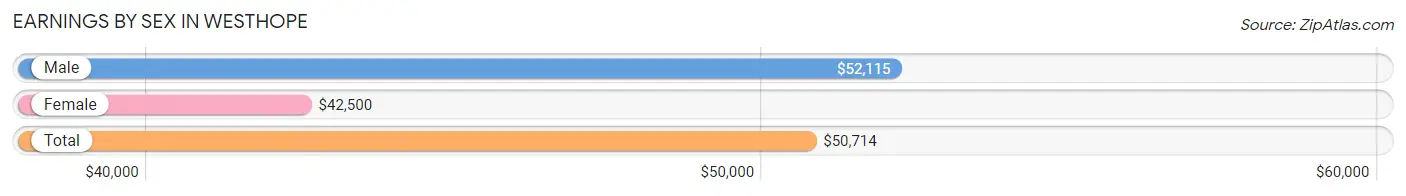
Earnings by Sex in Westhope
Average Earnings in Westhope are $50,714, $52,115 for men and $42,500 for women, a difference of 18.4%.
| Sex | Number | Average Earnings |
| Male | 92 (44.7%) | $52,115 |
| Female | 114 (55.3%) | $42,500 |
| Total | 206 (100.0%) | $50,714 |
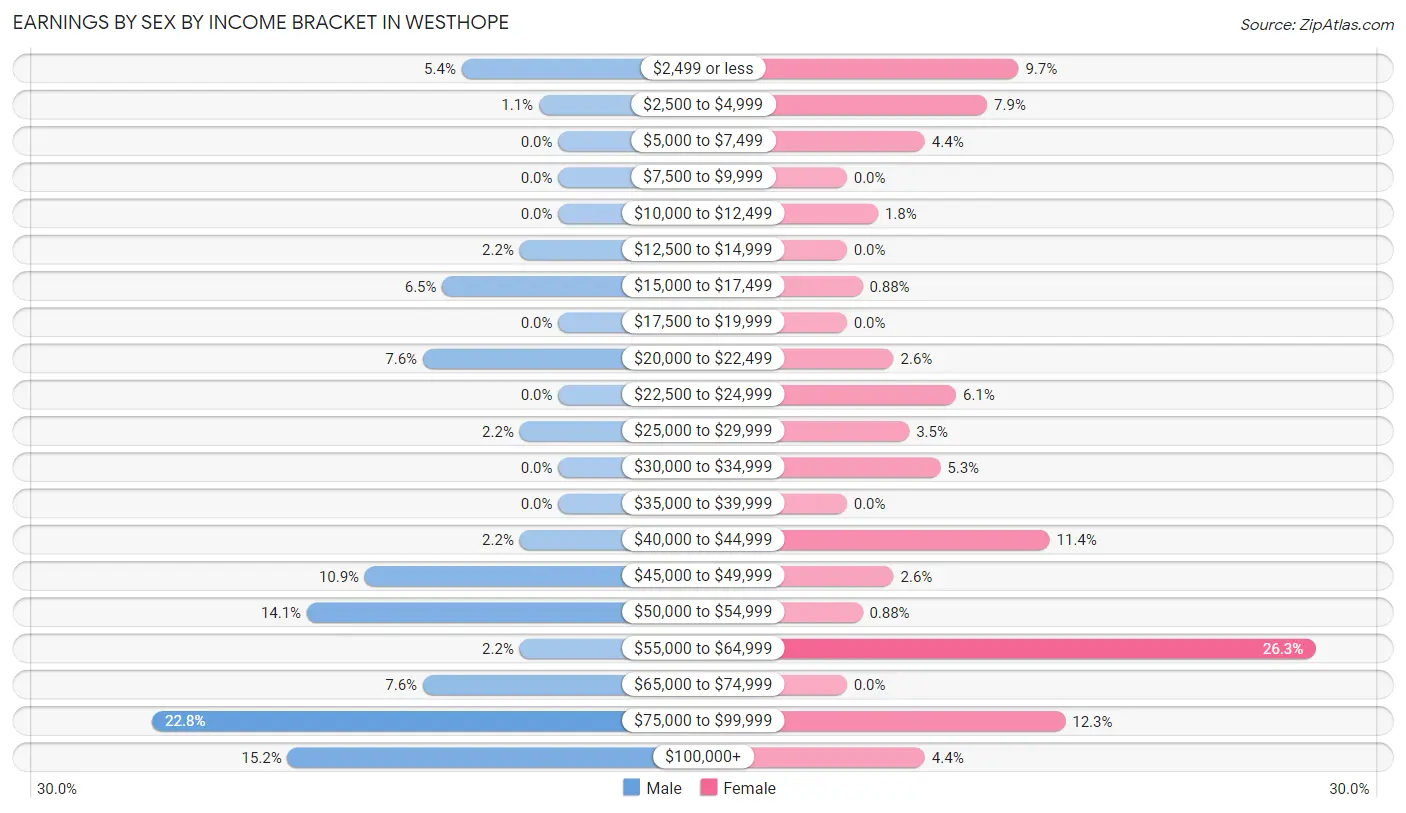
Earnings by Sex by Income Bracket in Westhope
The most common earnings brackets in Westhope are $75,000 to $99,999 for men (21 | 22.8%) and $55,000 to $64,999 for women (30 | 26.3%).
| Income | Male | Female |
| $2,499 or less | 5 (5.4%) | 11 (9.7%) |
| $2,500 to $4,999 | 1 (1.1%) | 9 (7.9%) |
| $5,000 to $7,499 | 0 (0.0%) | 5 (4.4%) |
| $7,500 to $9,999 | 0 (0.0%) | 0 (0.0%) |
| $10,000 to $12,499 | 0 (0.0%) | 2 (1.8%) |
| $12,500 to $14,999 | 2 (2.2%) | 0 (0.0%) |
| $15,000 to $17,499 | 6 (6.5%) | 1 (0.9%) |
| $17,500 to $19,999 | 0 (0.0%) | 0 (0.0%) |
| $20,000 to $22,499 | 7 (7.6%) | 3 (2.6%) |
| $22,500 to $24,999 | 0 (0.0%) | 7 (6.1%) |
| $25,000 to $29,999 | 2 (2.2%) | 4 (3.5%) |
| $30,000 to $34,999 | 0 (0.0%) | 6 (5.3%) |
| $35,000 to $39,999 | 0 (0.0%) | 0 (0.0%) |
| $40,000 to $44,999 | 2 (2.2%) | 13 (11.4%) |
| $45,000 to $49,999 | 10 (10.9%) | 3 (2.6%) |
| $50,000 to $54,999 | 13 (14.1%) | 1 (0.9%) |
| $55,000 to $64,999 | 2 (2.2%) | 30 (26.3%) |
| $65,000 to $74,999 | 7 (7.6%) | 0 (0.0%) |
| $75,000 to $99,999 | 21 (22.8%) | 14 (12.3%) |
| $100,000+ | 14 (15.2%) | 5 (4.4%) |
| Total | 92 (100.0%) | 114 (100.0%) |
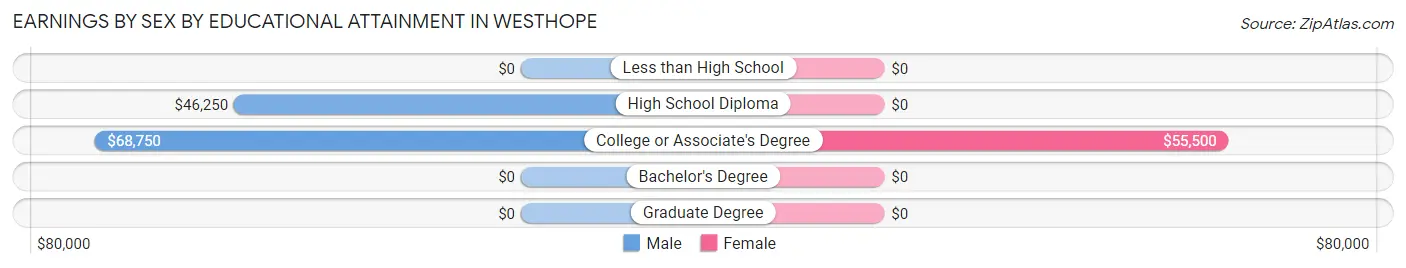
Earnings by Sex by Educational Attainment in Westhope
Average earnings in Westhope are $56,250 for men and $48,750 for women, a difference of 13.3%. Men with an educational attainment of college or associate's degree enjoy the highest average annual earnings of $68,750, while those with high school diploma education earn the least with $46,250. Women with an educational attainment of college or associate's degree earn the most with the average annual earnings of $55,500, while those with college or associate's degree education have the smallest earnings of $55,500.
| Educational Attainment | Male Income | Female Income |
| Less than High School | - | - |
| High School Diploma | $46,250 | $0 |
| College or Associate's Degree | $68,750 | $55,500 |
| Bachelor's Degree | - | - |
| Graduate Degree | - | - |
| Total | $56,250 | $48,750 |
Family Income in Westhope
Family Income Brackets in Westhope
According to the Westhope family income data, there are 17 families falling into the $35,000 to $49,999 income range, which is the most common income bracket and makes up 21.0% of all families.
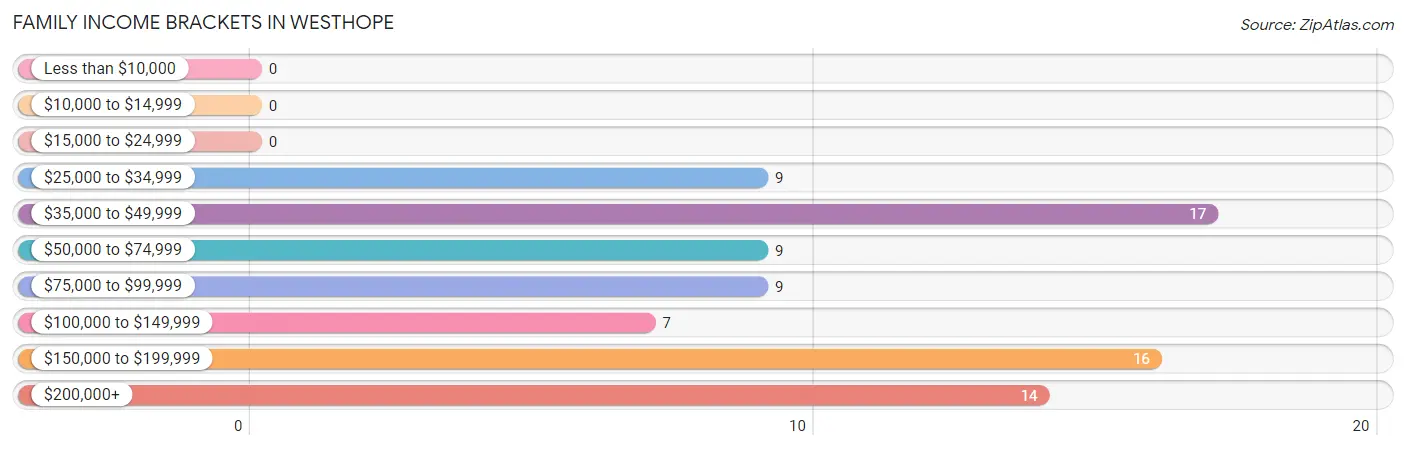
| Income Bracket | # Families | % Families |
| Less than $10,000 | 0 | 0.0% |
| $10,000 to $14,999 | 0 | 0.0% |
| $15,000 to $24,999 | 0 | 0.0% |
| $25,000 to $34,999 | 9 | 11.1% |
| $35,000 to $49,999 | 17 | 21.0% |
| $50,000 to $74,999 | 9 | 11.1% |
| $75,000 to $99,999 | 9 | 11.1% |
| $100,000 to $149,999 | 7 | 8.6% |
| $150,000 to $199,999 | 16 | 19.8% |
| $200,000+ | 14 | 17.3% |
Family Income by Famaliy Size in Westhope
5-person families (10 | 12.3%) account for the highest median family income in Westhope with $217,500 per family, while 5-person families (10 | 12.3%) have the highest median income of $43,500 per family member.
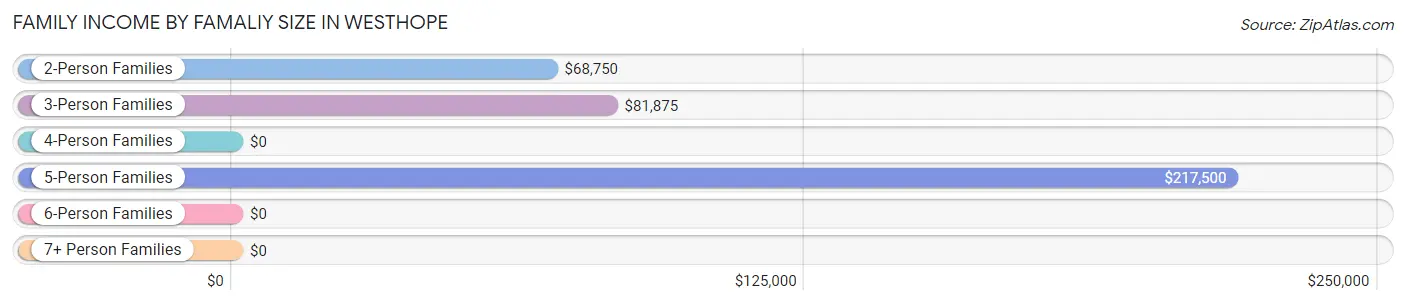
| Income Bracket | # Families | Median Income |
| 2-Person Families | 58 (71.6%) | $68,750 |
| 3-Person Families | 13 (16.1%) | $81,875 |
| 4-Person Families | 0 (0.0%) | $0 |
| 5-Person Families | 10 (12.3%) | $217,500 |
| 6-Person Families | 0 (0.0%) | $0 |
| 7+ Person Families | 0 (0.0%) | $0 |
| Total | 81 (100.0%) | $89,375 |
Family Income by Number of Earners in Westhope
The median family income in Westhope is $89,375, with families comprising 3+ earners (15) having the highest median family income of $184,750, while families with 1 earner (16) have the lowest median family income of $50,000, accounting for 18.5% and 19.8% of families, respectively.
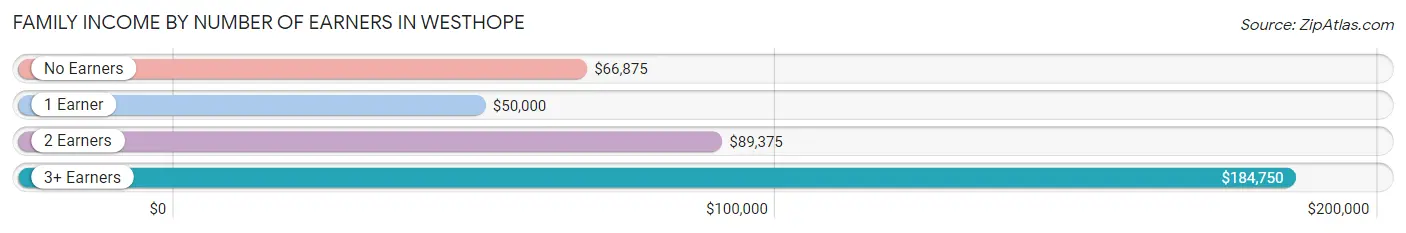
| Number of Earners | # Families | Median Income |
| No Earners | 15 (18.5%) | $66,875 |
| 1 Earner | 16 (19.8%) | $50,000 |
| 2 Earners | 35 (43.2%) | $89,375 |
| 3+ Earners | 15 (18.5%) | $184,750 |
| Total | 81 (100.0%) | $89,375 |
Household Income in Westhope
Household Income Brackets in Westhope
With 23 households falling in the category, the $50,000 to $74,999 income range is the most frequent in Westhope, accounting for 18.0% of all households.
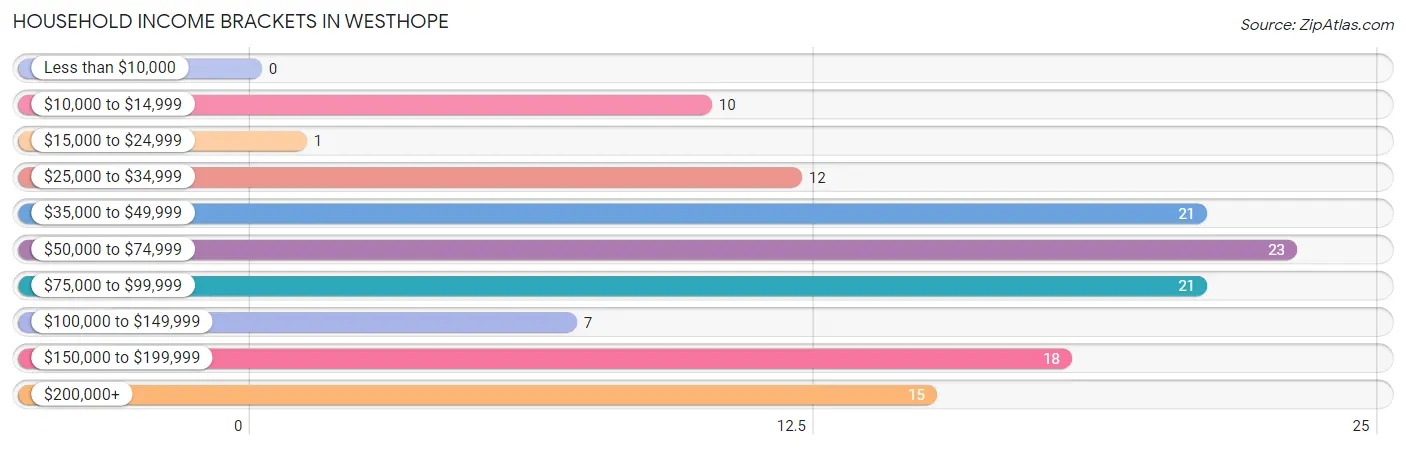
| Income Bracket | # Households | % Households |
| Less than $10,000 | 0 | 0.0% |
| $10,000 to $14,999 | 10 | 7.8% |
| $15,000 to $24,999 | 1 | 0.8% |
| $25,000 to $34,999 | 12 | 9.4% |
| $35,000 to $49,999 | 21 | 16.4% |
| $50,000 to $74,999 | 23 | 18.0% |
| $75,000 to $99,999 | 21 | 16.4% |
| $100,000 to $149,999 | 7 | 5.5% |
| $150,000 to $199,999 | 18 | 14.1% |
| $200,000+ | 15 | 11.7% |
Household Income by Householder Age in Westhope
The median household income in Westhope is $66,667, with the highest median household income of $113,750 found in the 45 to 64 years age bracket for the primary householder. A total of 42 households (32.8%) fall into this category. Meanwhile, the 15 to 24 years age bracket for the primary householder has the lowest median household income of $0, with 5 households (3.9%) in this group.
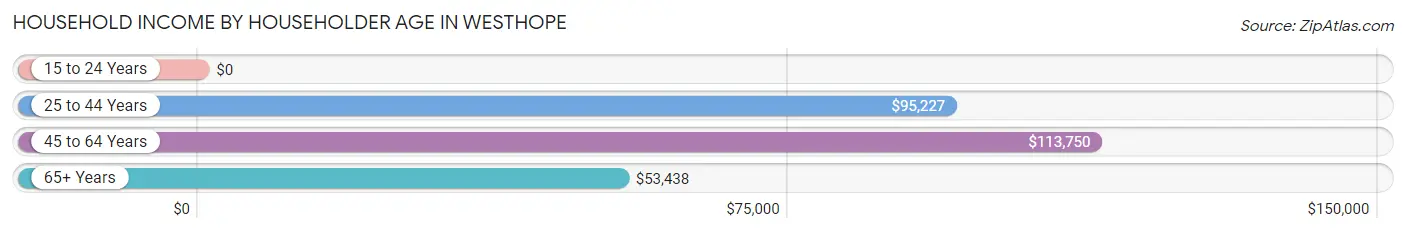
| Income Bracket | # Households | Median Income |
| 15 to 24 Years | 5 (3.9%) | $0 |
| 25 to 44 Years | 40 (31.2%) | $95,227 |
| 45 to 64 Years | 42 (32.8%) | $113,750 |
| 65+ Years | 41 (32.0%) | $53,438 |
| Total | 128 (100.0%) | $66,667 |
Poverty in Westhope
Income Below Poverty by Sex and Age in Westhope
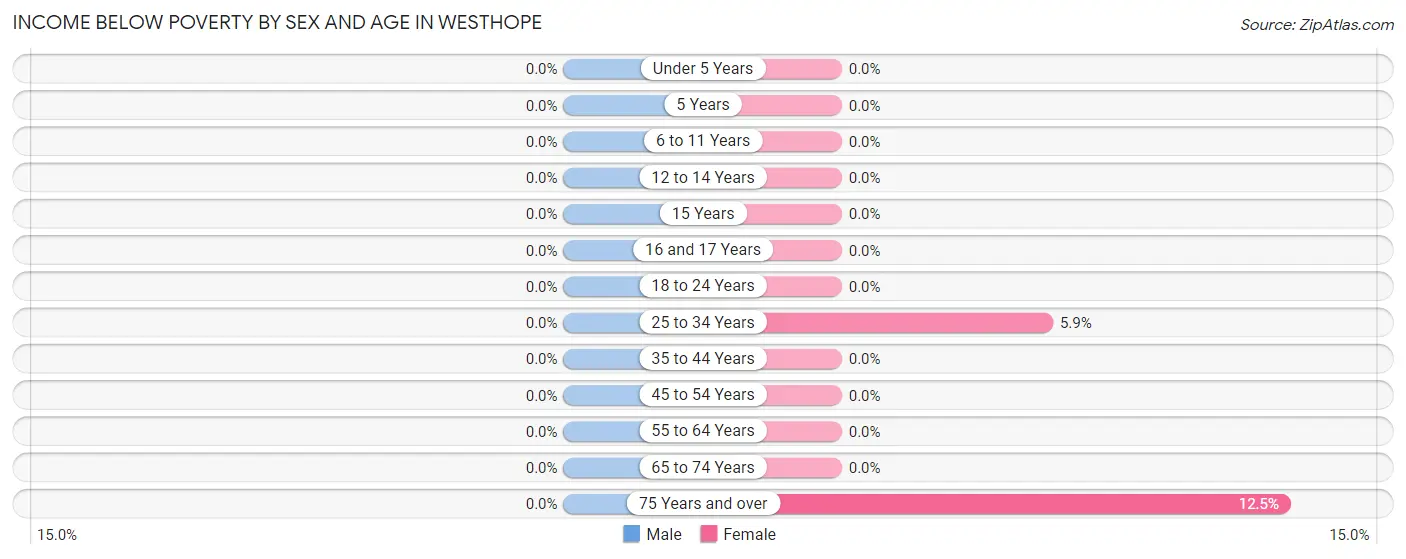
| Age Bracket | Male | Female |
| Under 5 Years | 0 (0.0%) | 0 (0.0%) |
| 5 Years | 0 (0.0%) | 0 (0.0%) |
| 6 to 11 Years | 0 (0.0%) | 0 (0.0%) |
| 12 to 14 Years | 0 (0.0%) | 0 (0.0%) |
| 15 Years | 0 (0.0%) | 0 (0.0%) |
| 16 and 17 Years | 0 (0.0%) | 0 (0.0%) |
| 18 to 24 Years | 0 (0.0%) | 0 (0.0%) |
| 25 to 34 Years | 0 (0.0%) | 1 (5.9%) |
| 35 to 44 Years | 0 (0.0%) | 0 (0.0%) |
| 45 to 54 Years | 0 (0.0%) | 0 (0.0%) |
| 55 to 64 Years | 0 (0.0%) | 0 (0.0%) |
| 65 to 74 Years | 0 (0.0%) | 0 (0.0%) |
| 75 Years and over | 0 (0.0%) | 3 (12.5%) |
| Total | 0 (0.0%) | 4 (2.1%) |
Income Above Poverty by Sex and Age in Westhope
According to the poverty statistics in Westhope, males aged under 5 years and females aged 6 to 11 years are the age groups that are most secure financially, with 100.0% of males and 100.0% of females in these age groups living above the poverty line.
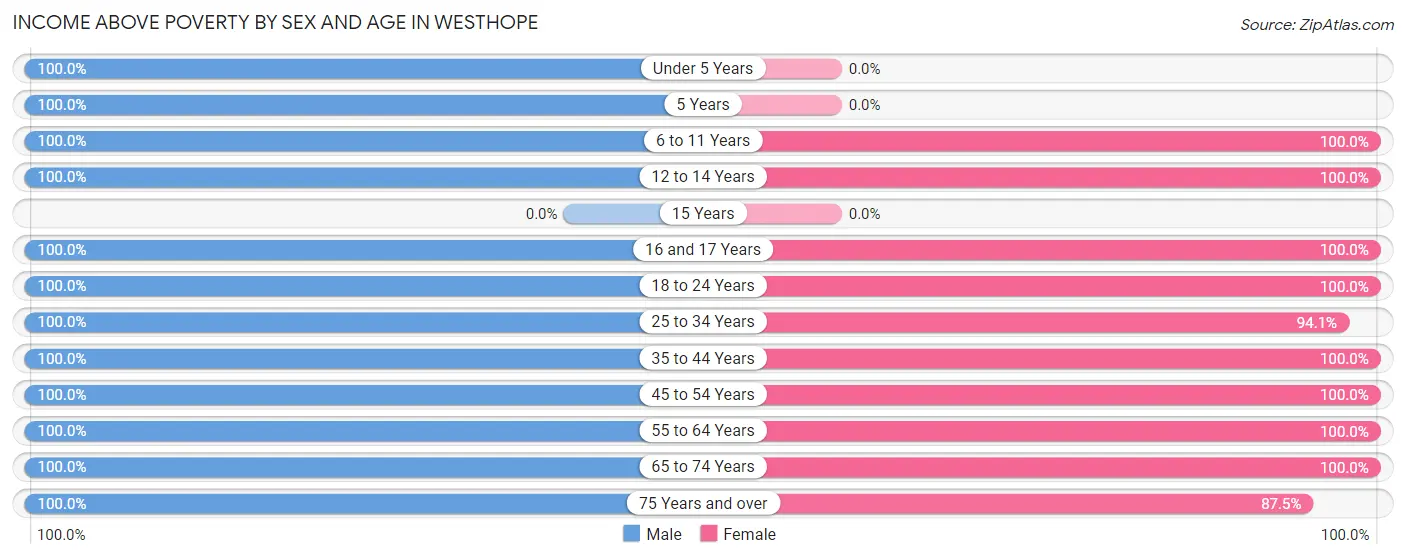
| Age Bracket | Male | Female |
| Under 5 Years | 10 (100.0%) | 0 (0.0%) |
| 5 Years | 1 (100.0%) | 0 (0.0%) |
| 6 to 11 Years | 18 (100.0%) | 5 (100.0%) |
| 12 to 14 Years | 7 (100.0%) | 2 (100.0%) |
| 15 Years | 0 (0.0%) | 0 (0.0%) |
| 16 and 17 Years | 1 (100.0%) | 10 (100.0%) |
| 18 to 24 Years | 5 (100.0%) | 4 (100.0%) |
| 25 to 34 Years | 15 (100.0%) | 16 (94.1%) |
| 35 to 44 Years | 8 (100.0%) | 20 (100.0%) |
| 45 to 54 Years | 40 (100.0%) | 18 (100.0%) |
| 55 to 64 Years | 20 (100.0%) | 70 (100.0%) |
| 65 to 74 Years | 17 (100.0%) | 19 (100.0%) |
| 75 Years and over | 5 (100.0%) | 21 (87.5%) |
| Total | 147 (100.0%) | 185 (97.9%) |
Income Below Poverty Among Married-Couple Families in Westhope
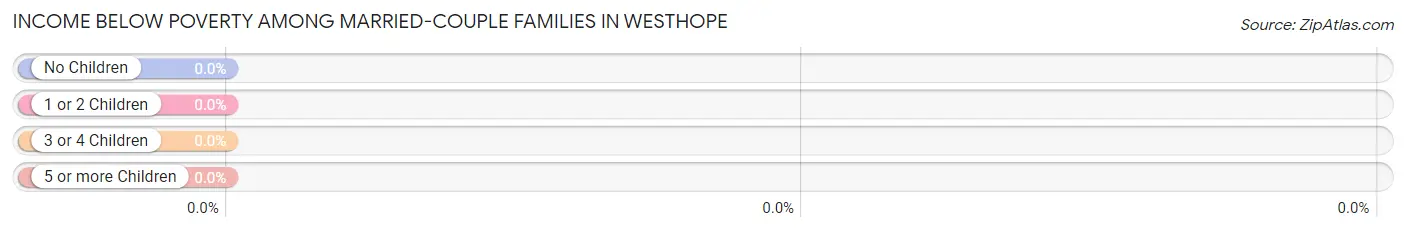
| Children | Above Poverty | Below Poverty |
| No Children | 58 (100.0%) | 0 (0.0%) |
| 1 or 2 Children | 8 (100.0%) | 0 (0.0%) |
| 3 or 4 Children | 5 (100.0%) | 0 (0.0%) |
| 5 or more Children | 0 (0.0%) | 0 (0.0%) |
| Total | 71 (100.0%) | 0 (0.0%) |
Income Below Poverty Among Single-Parent Households in Westhope
| Children | Single Father | Single Mother |
| No Children | 0 (0.0%) | 0 (0.0%) |
| 1 or 2 Children | 0 (0.0%) | 0 (0.0%) |
| 3 or 4 Children | 0 (0.0%) | 0 (0.0%) |
| 5 or more Children | 0 (0.0%) | 0 (0.0%) |
| Total | 0 (0.0%) | 0 (0.0%) |
Income Below Poverty Among Married-Couple vs Single-Parent Households in Westhope
| Children | Married-Couple Families | Single-Parent Households |
| No Children | 0 (0.0%) | 0 (0.0%) |
| 1 or 2 Children | 0 (0.0%) | 0 (0.0%) |
| 3 or 4 Children | 0 (0.0%) | 0 (0.0%) |
| 5 or more Children | 0 (0.0%) | 0 (0.0%) |
| Total | 0 (0.0%) | 0 (0.0%) |
Race in Westhope
The most populous races in Westhope are White / Caucasian (335 | 93.1%), Hispanic or Latino (52 | 14.4%), and Two or more Races (22 | 6.1%).
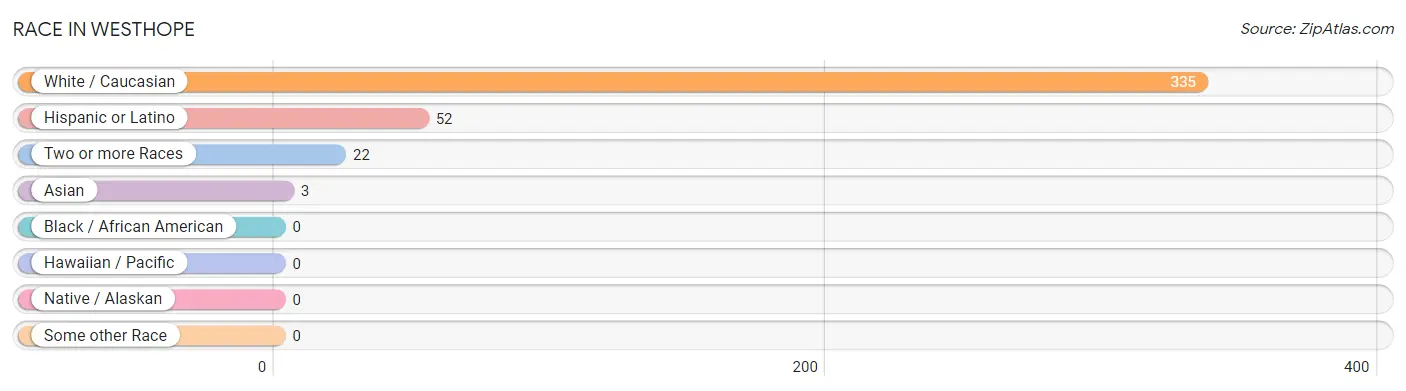
| Race | # Population | % Population |
| Asian | 3 | 0.8% |
| Black / African American | 0 | 0.0% |
| Hawaiian / Pacific | 0 | 0.0% |
| Hispanic or Latino | 52 | 14.4% |
| Native / Alaskan | 0 | 0.0% |
| White / Caucasian | 335 | 93.1% |
| Two or more Races | 22 | 6.1% |
| Some other Race | 0 | 0.0% |
| Total | 360 | 100.0% |
Ancestry in Westhope
The most populous ancestries reported in Westhope are Norwegian (159 | 44.2%), German (64 | 17.8%), Swedish (64 | 17.8%), Mexican (47 | 13.1%), and American (23 | 6.4%), together accounting for 99.2% of all Westhope residents.
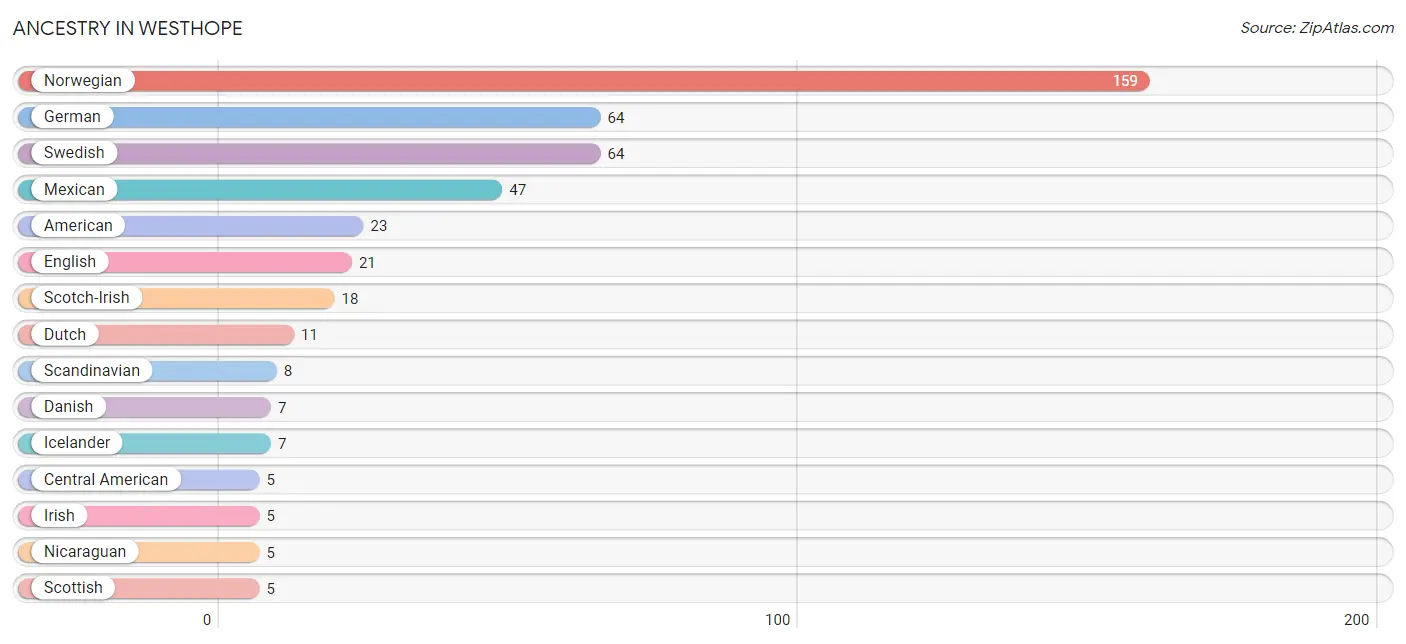
| Ancestry | # Population | % Population |
| Afghan | 3 | 0.8% |
| American | 23 | 6.4% |
| Central American | 5 | 1.4% |
| Cherokee | 1 | 0.3% |
| Danish | 7 | 1.9% |
| Dutch | 11 | 3.1% |
| English | 21 | 5.8% |
| Finnish | 3 | 0.8% |
| French | 1 | 0.3% |
| German | 64 | 17.8% |
| Icelander | 7 | 1.9% |
| Irish | 5 | 1.4% |
| Italian | 1 | 0.3% |
| Korean | 1 | 0.3% |
| Mexican | 47 | 13.1% |
| Nicaraguan | 5 | 1.4% |
| Norwegian | 159 | 44.2% |
| Polish | 4 | 1.1% |
| Scandinavian | 8 | 2.2% |
| Scotch-Irish | 18 | 5.0% |
| Scottish | 5 | 1.4% |
| Swedish | 64 | 17.8% |
| Swiss | 2 | 0.6% |
| Welsh | 3 | 0.8% | View All 24 Rows |
Immigrants in Westhope
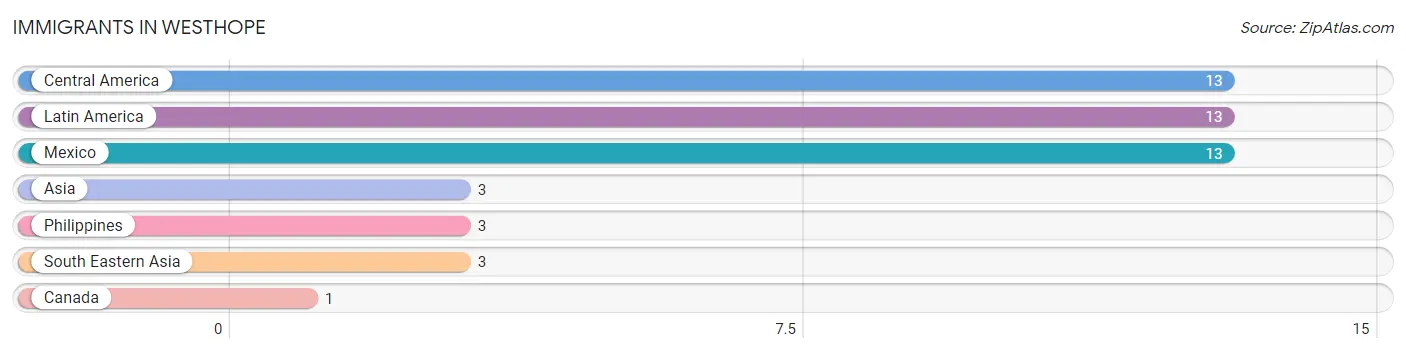
The most numerous immigrant groups reported in Westhope came from Central America (13 | 3.6%), Latin America (13 | 3.6%), Mexico (13 | 3.6%), Asia (3 | 0.8%), and Philippines (3 | 0.8%), together accounting for 12.5% of all Westhope residents.
| Immigration Origin | # Population | % Population |
| Asia | 3 | 0.8% |
| Canada | 1 | 0.3% |
| Central America | 13 | 3.6% |
| Latin America | 13 | 3.6% |
| Mexico | 13 | 3.6% |
| Philippines | 3 | 0.8% |
| South Eastern Asia | 3 | 0.8% | View All 7 Rows |
Sex and Age in Westhope
Sex and Age in Westhope
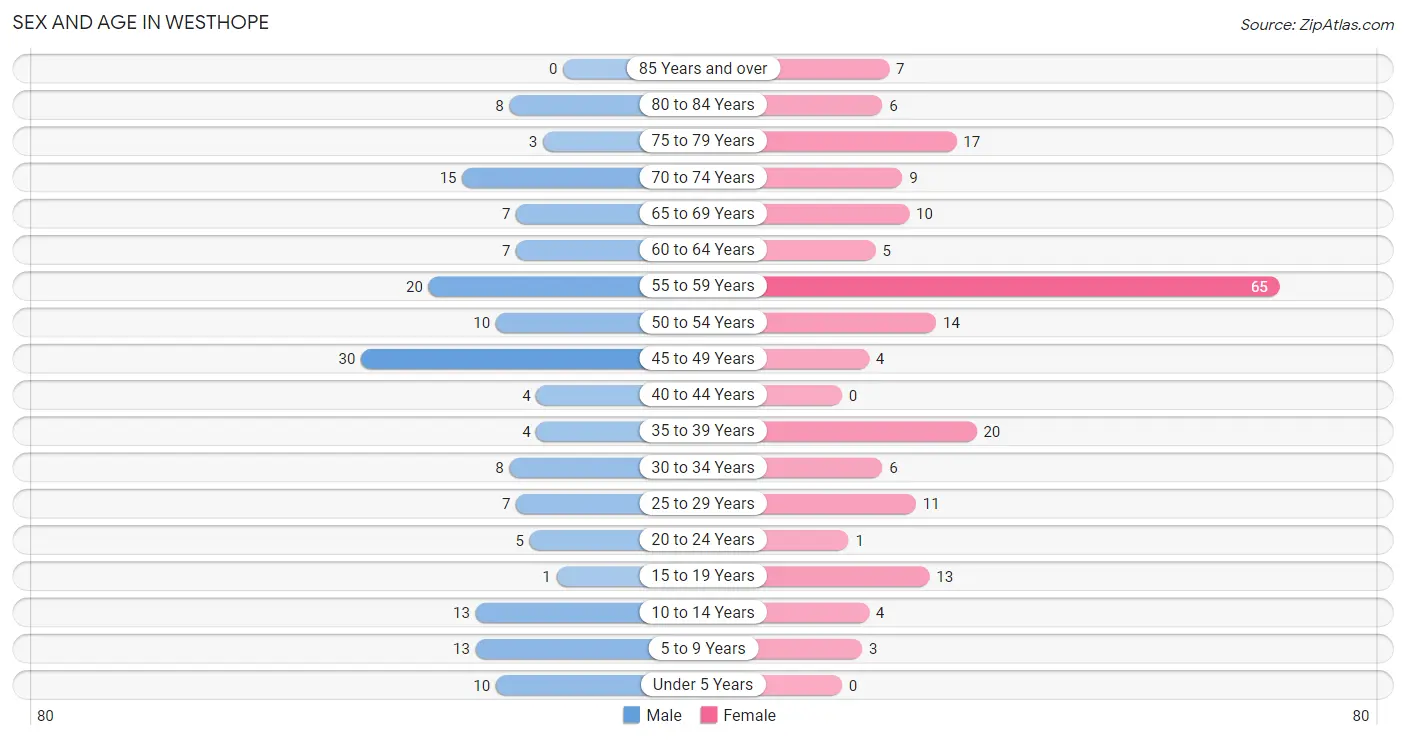
The most populous age groups in Westhope are 45 to 49 Years (30 | 18.2%) for men and 55 to 59 Years (65 | 33.3%) for women.
| Age Bracket | Male | Female |
| Under 5 Years | 10 (6.1%) | 0 (0.0%) |
| 5 to 9 Years | 13 (7.9%) | 3 (1.5%) |
| 10 to 14 Years | 13 (7.9%) | 4 (2.1%) |
| 15 to 19 Years | 1 (0.6%) | 13 (6.7%) |
| 20 to 24 Years | 5 (3.0%) | 1 (0.5%) |
| 25 to 29 Years | 7 (4.2%) | 11 (5.6%) |
| 30 to 34 Years | 8 (4.9%) | 6 (3.1%) |
| 35 to 39 Years | 4 (2.4%) | 20 (10.3%) |
| 40 to 44 Years | 4 (2.4%) | 0 (0.0%) |
| 45 to 49 Years | 30 (18.2%) | 4 (2.1%) |
| 50 to 54 Years | 10 (6.1%) | 14 (7.2%) |
| 55 to 59 Years | 20 (12.1%) | 65 (33.3%) |
| 60 to 64 Years | 7 (4.2%) | 5 (2.6%) |
| 65 to 69 Years | 7 (4.2%) | 10 (5.1%) |
| 70 to 74 Years | 15 (9.1%) | 9 (4.6%) |
| 75 to 79 Years | 3 (1.8%) | 17 (8.7%) |
| 80 to 84 Years | 8 (4.9%) | 6 (3.1%) |
| 85 Years and over | 0 (0.0%) | 7 (3.6%) |
| Total | 165 (100.0%) | 195 (100.0%) |
Families and Households in Westhope
Median Family Size in Westhope
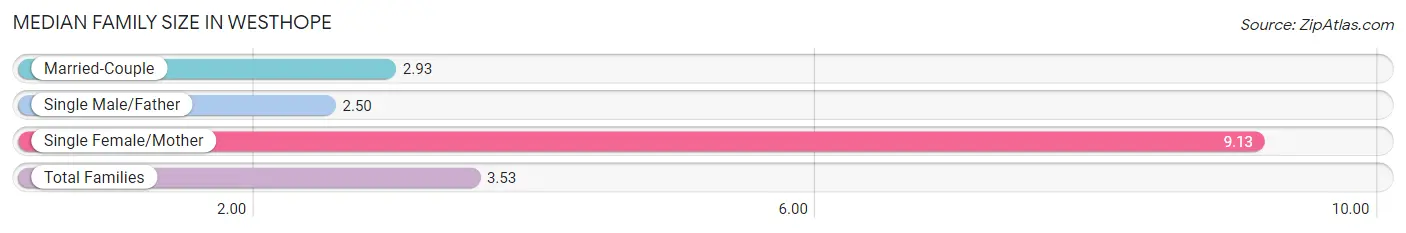
The median family size in Westhope is 3.53 persons per family, with single female/mother families (8 | 9.9%) accounting for the largest median family size of 9.13 persons per family. On the other hand, single male/father families (2 | 2.5%) represent the smallest median family size with 2.50 persons per family.
| Family Type | # Families | Family Size |
| Married-Couple | 71 (87.6%) | 2.93 |
| Single Male/Father | 2 (2.5%) | 2.50 |
| Single Female/Mother | 8 (9.9%) | 9.13 |
| Total Families | 81 (100.0%) | 3.53 |
Median Household Size in Westhope
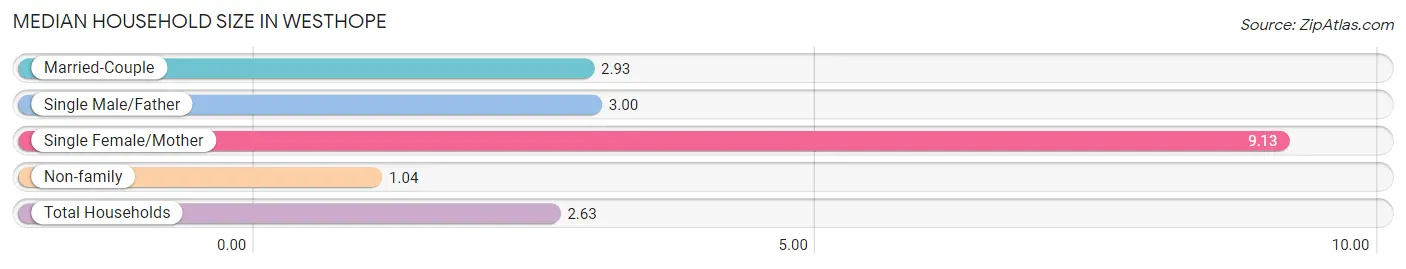
The median household size in Westhope is 2.63 persons per household, with single female/mother households (8 | 6.2%) accounting for the largest median household size of 9.13 persons per household. non-family households (47 | 36.7%) represent the smallest median household size with 1.04 persons per household.
| Household Type | # Households | Household Size |
| Married-Couple | 71 (55.5%) | 2.93 |
| Single Male/Father | 2 (1.6%) | 3.00 |
| Single Female/Mother | 8 (6.2%) | 9.13 |
| Non-family | 47 (36.7%) | 1.04 |
| Total Households | 128 (100.0%) | 2.63 |
Household Size by Marriage Status in Westhope
Out of a total of 128 households in Westhope, 81 (63.3%) are family households, while 47 (36.7%) are nonfamily households. The most numerous type of family households are 2-person households, comprising 58, and the most common type of nonfamily households are 1-person households, comprising 46.
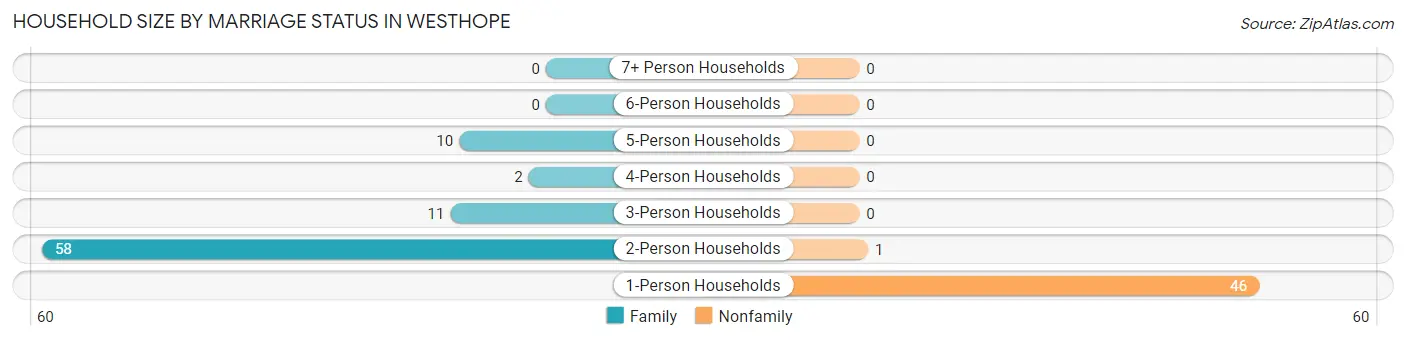
| Household Size | Family Households | Nonfamily Households |
| 1-Person Households | - | 46 (35.9%) |
| 2-Person Households | 58 (45.3%) | 1 (0.8%) |
| 3-Person Households | 11 (8.6%) | 0 (0.0%) |
| 4-Person Households | 2 (1.6%) | 0 (0.0%) |
| 5-Person Households | 10 (7.8%) | 0 (0.0%) |
| 6-Person Households | 0 (0.0%) | 0 (0.0%) |
| 7+ Person Households | 0 (0.0%) | 0 (0.0%) |
| Total | 81 (63.3%) | 47 (36.7%) |
Female Fertility in Westhope
Fertility by Age in Westhope
| Age Bracket | Women with Births | Births / 1,000 Women |
| 15 to 19 years | 0 (0.0%) | 0.0 |
| 20 to 34 years | 0 (0.0%) | 0.0 |
| 35 to 50 years | 0 (0.0%) | 0.0 |
| Total | 0 (0.0%) | 0.0 |
Fertility by Age by Marriage Status in Westhope
| Age Bracket | Married | Unmarried |
| 15 to 19 years | 0 (0.0%) | 0 (0.0%) |
| 20 to 34 years | 0 (0.0%) | 0 (0.0%) |
| 35 to 50 years | 0 (0.0%) | 0 (0.0%) |
| Total | 0 (0.0%) | 0 (0.0%) |
Fertility by Education in Westhope
| Educational Attainment | Women with Births | Births / 1,000 Women |
| Less than High School | 0 (0.0%) | 0.0 |
| High School Diploma | 0 (0.0%) | 0.0 |
| College or Associate's Degree | 0 (0.0%) | 0.0 |
| Bachelor's Degree | 0 (0.0%) | 0.0 |
| Graduate Degree | 0 (0.0%) | 0.0 |
| Total | 0 (0.0%) | 0.0 |
Fertility by Education by Marriage Status in Westhope
| Educational Attainment | Married | Unmarried |
| Less than High School | 0 (0.0%) | 0 (0.0%) |
| High School Diploma | 0 (0.0%) | 0 (0.0%) |
| College or Associate's Degree | 0 (0.0%) | 0 (0.0%) |
| Bachelor's Degree | 0 (0.0%) | 0 (0.0%) |
| Graduate Degree | 0 (0.0%) | 0 (0.0%) |
| Total | 0 (0.0%) | 0 (0.0%) |
Employment Characteristics in Westhope
Employment by Class of Employer in Westhope
Among the 171 employed individuals in Westhope, private company employees (74 | 43.3%), federal government employees (49 | 28.6%), and local government employees (28 | 16.4%) make up the most common classes of employment.
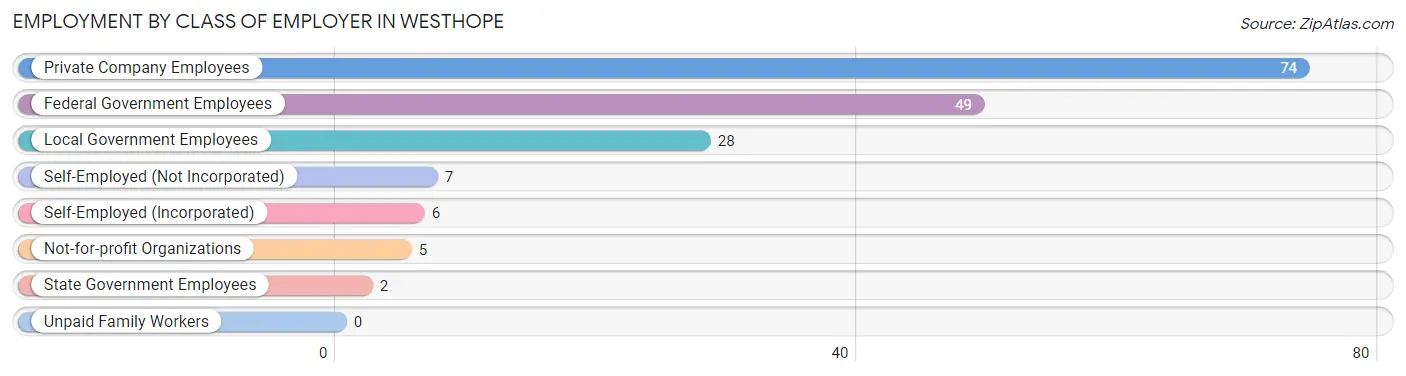
| Employer Class | # Employees | % Employees |
| Private Company Employees | 74 | 43.3% |
| Self-Employed (Incorporated) | 6 | 3.5% |
| Self-Employed (Not Incorporated) | 7 | 4.1% |
| Not-for-profit Organizations | 5 | 2.9% |
| Local Government Employees | 28 | 16.4% |
| State Government Employees | 2 | 1.2% |
| Federal Government Employees | 49 | 28.6% |
| Unpaid Family Workers | 0 | 0.0% |
| Total | 171 | 100.0% |
Employment Status by Age in Westhope
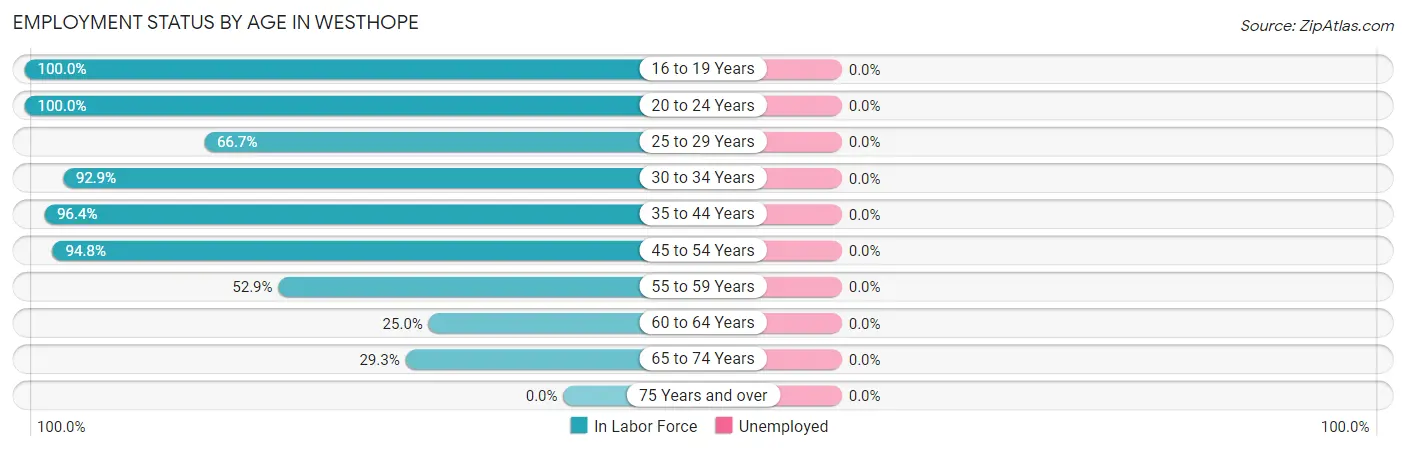
| Age Bracket | In Labor Force | Unemployed |
| 16 to 19 Years | 14 (100.0%) | 0 (0.0%) |
| 20 to 24 Years | 6 (100.0%) | 0 (0.0%) |
| 25 to 29 Years | 12 (66.7%) | 0 (0.0%) |
| 30 to 34 Years | 13 (92.9%) | 0 (0.0%) |
| 35 to 44 Years | 27 (96.4%) | 0 (0.0%) |
| 45 to 54 Years | 55 (94.8%) | 0 (0.0%) |
| 55 to 59 Years | 45 (52.9%) | 0 (0.0%) |
| 60 to 64 Years | 3 (25.0%) | 0 (0.0%) |
| 65 to 74 Years | 12 (29.3%) | 0 (0.0%) |
| 75 Years and over | 0 (0.0%) | 0 (0.0%) |
| Total | 187 (59.0%) | 0 (0.0%) |
Employment Status by Educational Attainment in Westhope
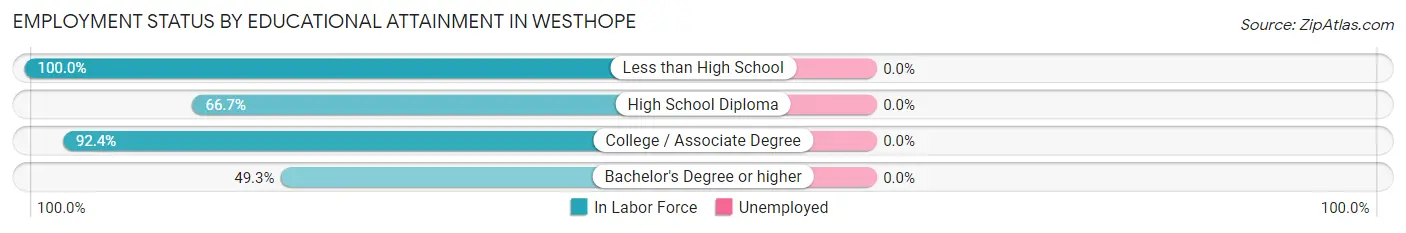
| Educational Attainment | In Labor Force | Unemployed |
| Less than High School | 3 (100.0%) | 0 (0.0%) |
| High School Diploma | 30 (66.7%) | 0 (0.0%) |
| College / Associate Degree | 85 (92.4%) | 0 (0.0%) |
| Bachelor's Degree or higher | 37 (49.3%) | 0 (0.0%) |
| Total | 155 (72.1%) | 0 (0.0%) |
Employment Occupations by Sex in Westhope
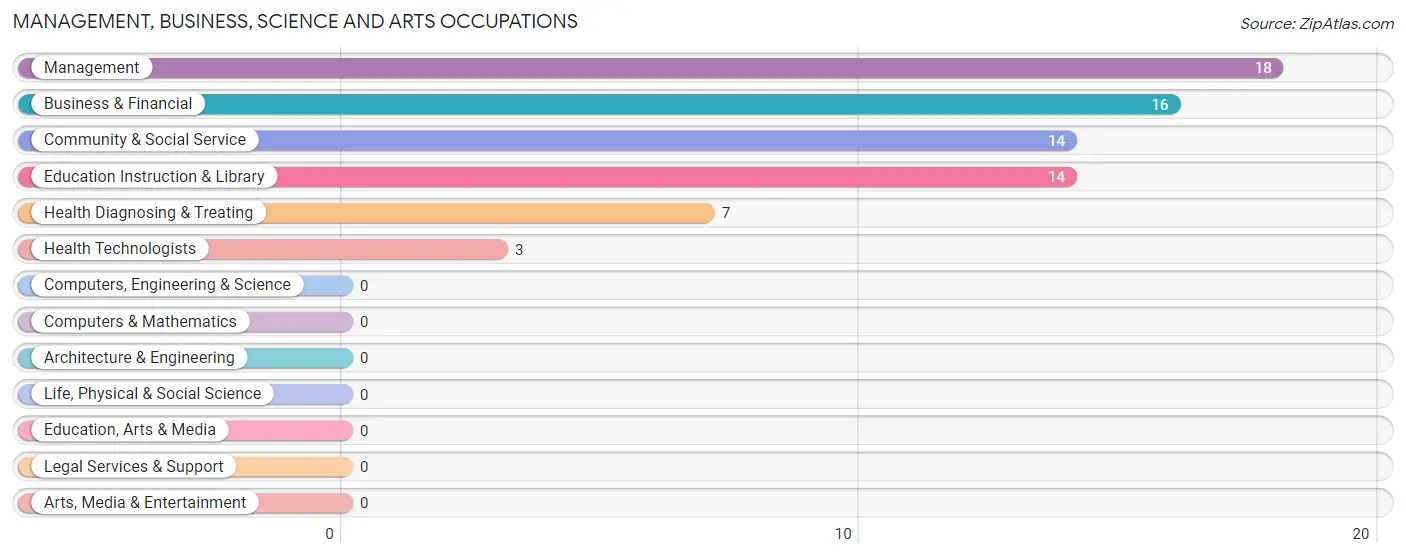
Management, Business, Science and Arts Occupations
The most common Management, Business, Science and Arts occupations in Westhope are Management (18 | 9.9%), Business & Financial (16 | 8.8%), Community & Social Service (14 | 7.7%), Education Instruction & Library (14 | 7.7%), and Health Diagnosing & Treating (7 | 3.8%).
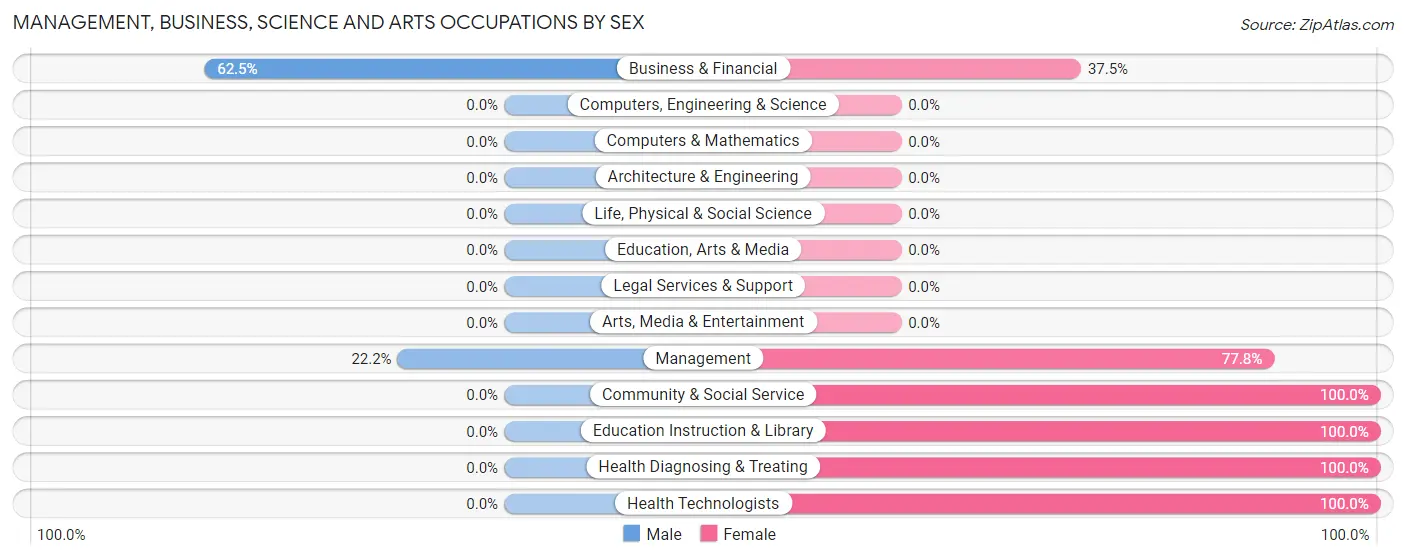
Management, Business, Science and Arts Occupations by Sex
Within the Management, Business, Science and Arts occupations in Westhope, the most male-oriented occupations are Business & Financial (62.5%), and Management (22.2%), while the most female-oriented occupations are Community & Social Service (100.0%), Education Instruction & Library (100.0%), and Health Diagnosing & Treating (100.0%).
| Occupation | Male | Female |
| Management | 4 (22.2%) | 14 (77.8%) |
| Business & Financial | 10 (62.5%) | 6 (37.5%) |
| Computers, Engineering & Science | 0 (0.0%) | 0 (0.0%) |
| Computers & Mathematics | 0 (0.0%) | 0 (0.0%) |
| Architecture & Engineering | 0 (0.0%) | 0 (0.0%) |
| Life, Physical & Social Science | 0 (0.0%) | 0 (0.0%) |
| Community & Social Service | 0 (0.0%) | 14 (100.0%) |
| Education, Arts & Media | 0 (0.0%) | 0 (0.0%) |
| Legal Services & Support | 0 (0.0%) | 0 (0.0%) |
| Education Instruction & Library | 0 (0.0%) | 14 (100.0%) |
| Arts, Media & Entertainment | 0 (0.0%) | 0 (0.0%) |
| Health Diagnosing & Treating | 0 (0.0%) | 7 (100.0%) |
| Health Technologists | 0 (0.0%) | 3 (100.0%) |
| Total (Category) | 14 (25.5%) | 41 (74.6%) |
| Total (Overall) | 75 (41.2%) | 107 (58.8%) |
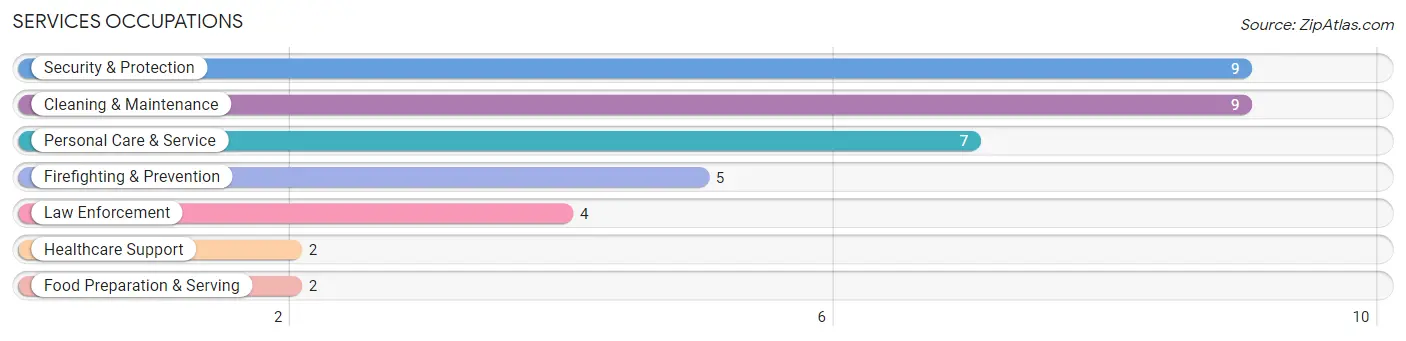
Services Occupations
The most common Services occupations in Westhope are Security & Protection (9 | 5.0%), Cleaning & Maintenance (9 | 5.0%), Personal Care & Service (7 | 3.8%), Firefighting & Prevention (5 | 2.8%), and Law Enforcement (4 | 2.2%).
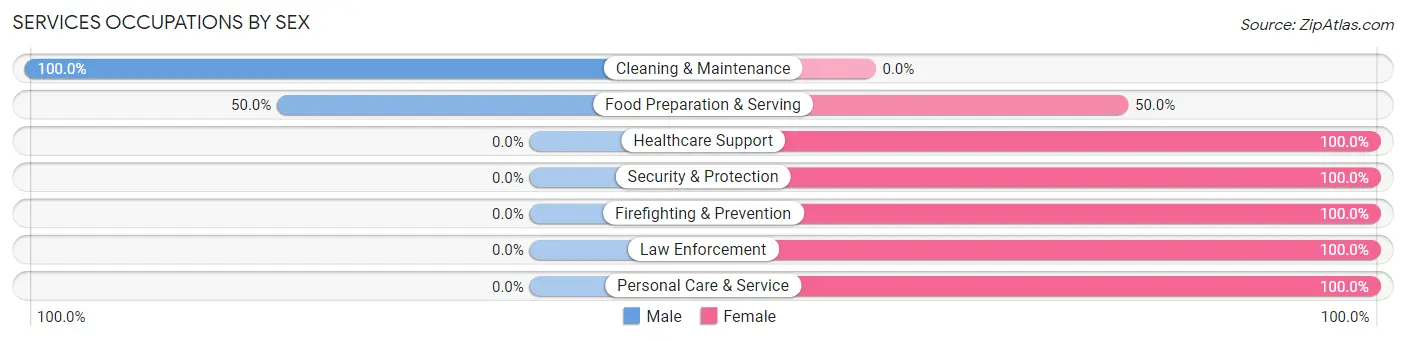
Services Occupations by Sex
Within the Services occupations in Westhope, the most male-oriented occupations are Cleaning & Maintenance (100.0%), and Food Preparation & Serving (50.0%), while the most female-oriented occupations are Healthcare Support (100.0%), Security & Protection (100.0%), and Firefighting & Prevention (100.0%).
| Occupation | Male | Female |
| Healthcare Support | 0 (0.0%) | 2 (100.0%) |
| Security & Protection | 0 (0.0%) | 9 (100.0%) |
| Firefighting & Prevention | 0 (0.0%) | 5 (100.0%) |
| Law Enforcement | 0 (0.0%) | 4 (100.0%) |
| Food Preparation & Serving | 1 (50.0%) | 1 (50.0%) |
| Cleaning & Maintenance | 9 (100.0%) | 0 (0.0%) |
| Personal Care & Service | 0 (0.0%) | 7 (100.0%) |
| Total (Category) | 10 (34.5%) | 19 (65.5%) |
| Total (Overall) | 75 (41.2%) | 107 (58.8%) |
Sales and Office Occupations
The most common Sales and Office occupations in Westhope are Office & Administration (21 | 11.5%), and Sales & Related (3 | 1.7%).
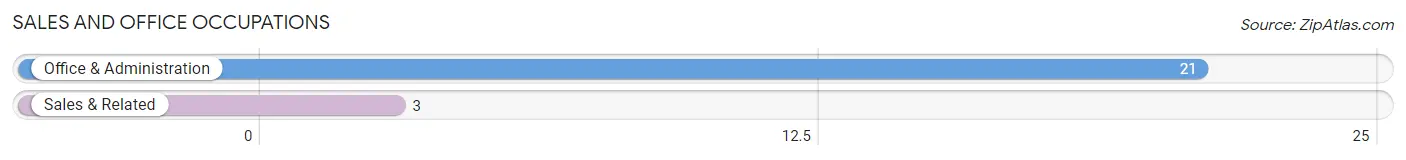
Sales and Office Occupations by Sex
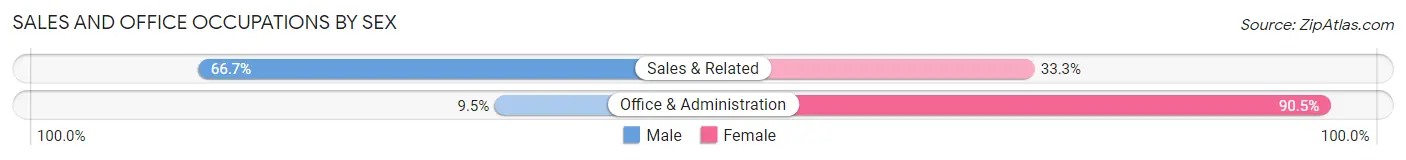
| Occupation | Male | Female |
| Sales & Related | 2 (66.7%) | 1 (33.3%) |
| Office & Administration | 2 (9.5%) | 19 (90.5%) |
| Total (Category) | 4 (16.7%) | 20 (83.3%) |
| Total (Overall) | 75 (41.2%) | 107 (58.8%) |
Natural Resources, Construction and Maintenance Occupations
The most common Natural Resources, Construction and Maintenance occupations in Westhope are Construction & Extraction (20 | 11.0%), and Installation, Maintenance & Repair (8 | 4.4%).
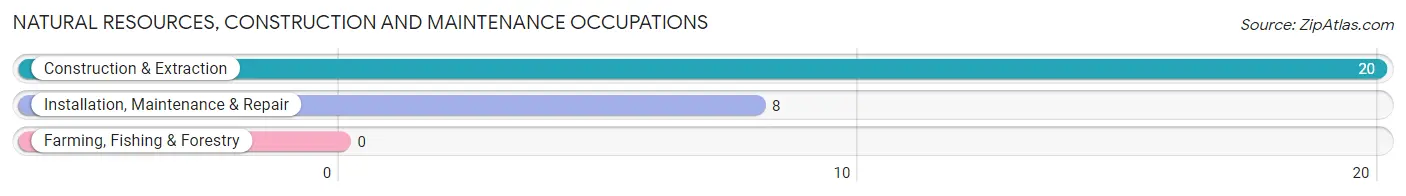
Natural Resources, Construction and Maintenance Occupations by Sex
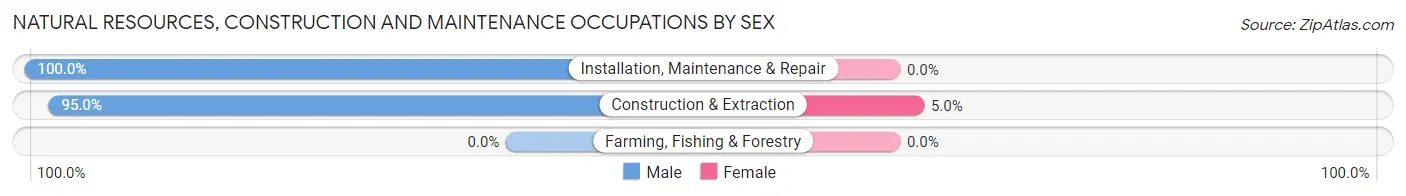
| Occupation | Male | Female |
| Farming, Fishing & Forestry | 0 (0.0%) | 0 (0.0%) |
| Construction & Extraction | 19 (95.0%) | 1 (5.0%) |
| Installation, Maintenance & Repair | 8 (100.0%) | 0 (0.0%) |
| Total (Category) | 27 (96.4%) | 1 (3.6%) |
| Total (Overall) | 75 (41.2%) | 107 (58.8%) |
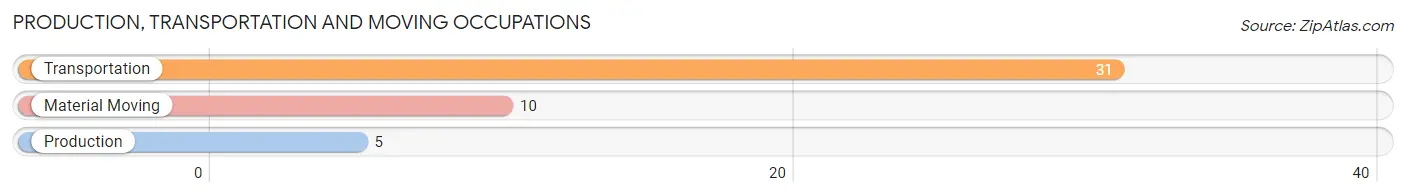
Production, Transportation and Moving Occupations
The most common Production, Transportation and Moving occupations in Westhope are Transportation (31 | 17.0%), Material Moving (10 | 5.5%), and Production (5 | 2.8%).
Production, Transportation and Moving Occupations by Sex
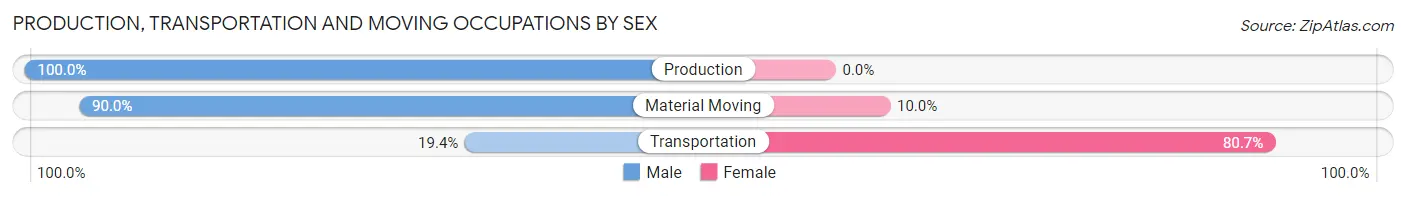
| Occupation | Male | Female |
| Production | 5 (100.0%) | 0 (0.0%) |
| Transportation | 6 (19.4%) | 25 (80.6%) |
| Material Moving | 9 (90.0%) | 1 (10.0%) |
| Total (Category) | 20 (43.5%) | 26 (56.5%) |
| Total (Overall) | 75 (41.2%) | 107 (58.8%) |
Employment Industries by Sex in Westhope
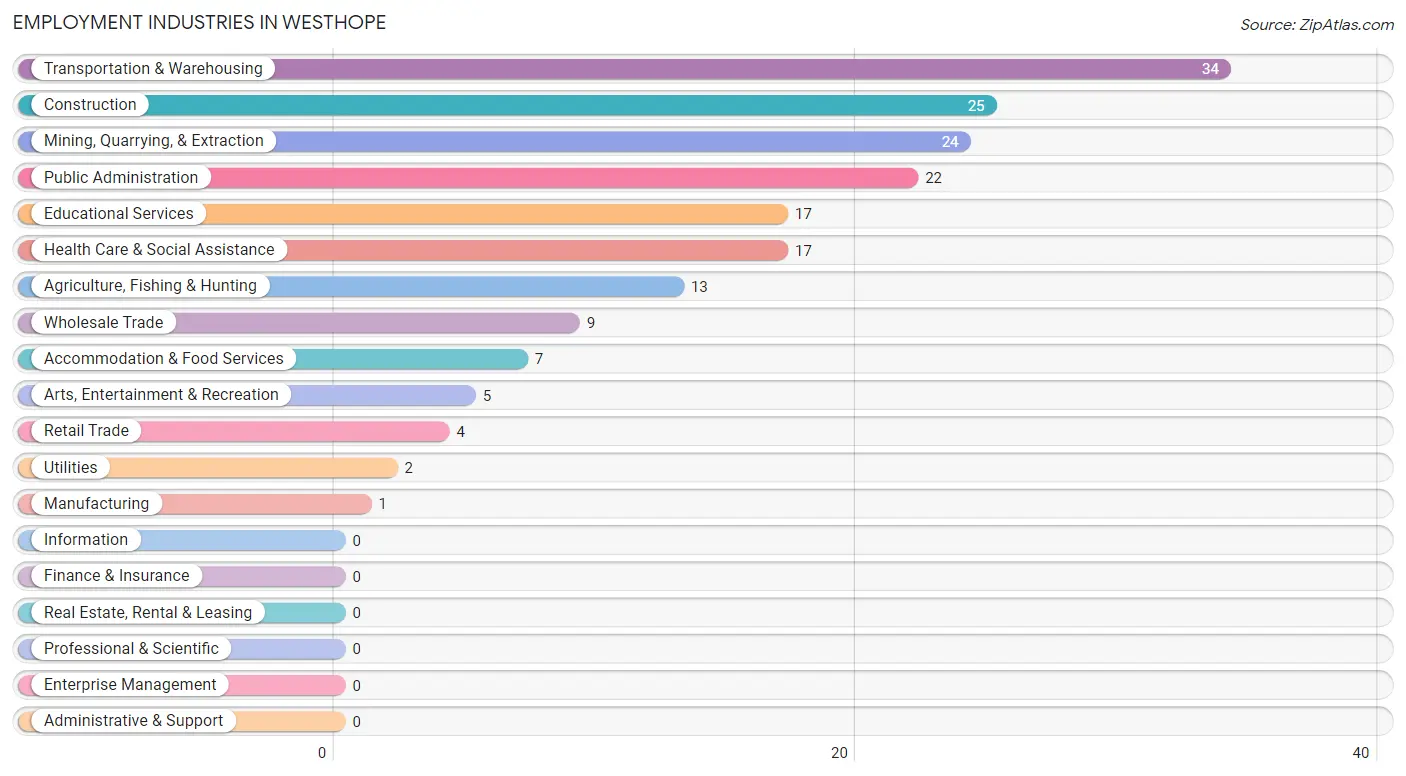
Employment Industries in Westhope
The major employment industries in Westhope include Transportation & Warehousing (34 | 18.7%), Construction (25 | 13.7%), Mining, Quarrying, & Extraction (24 | 13.2%), Public Administration (22 | 12.1%), and Educational Services (17 | 9.3%).
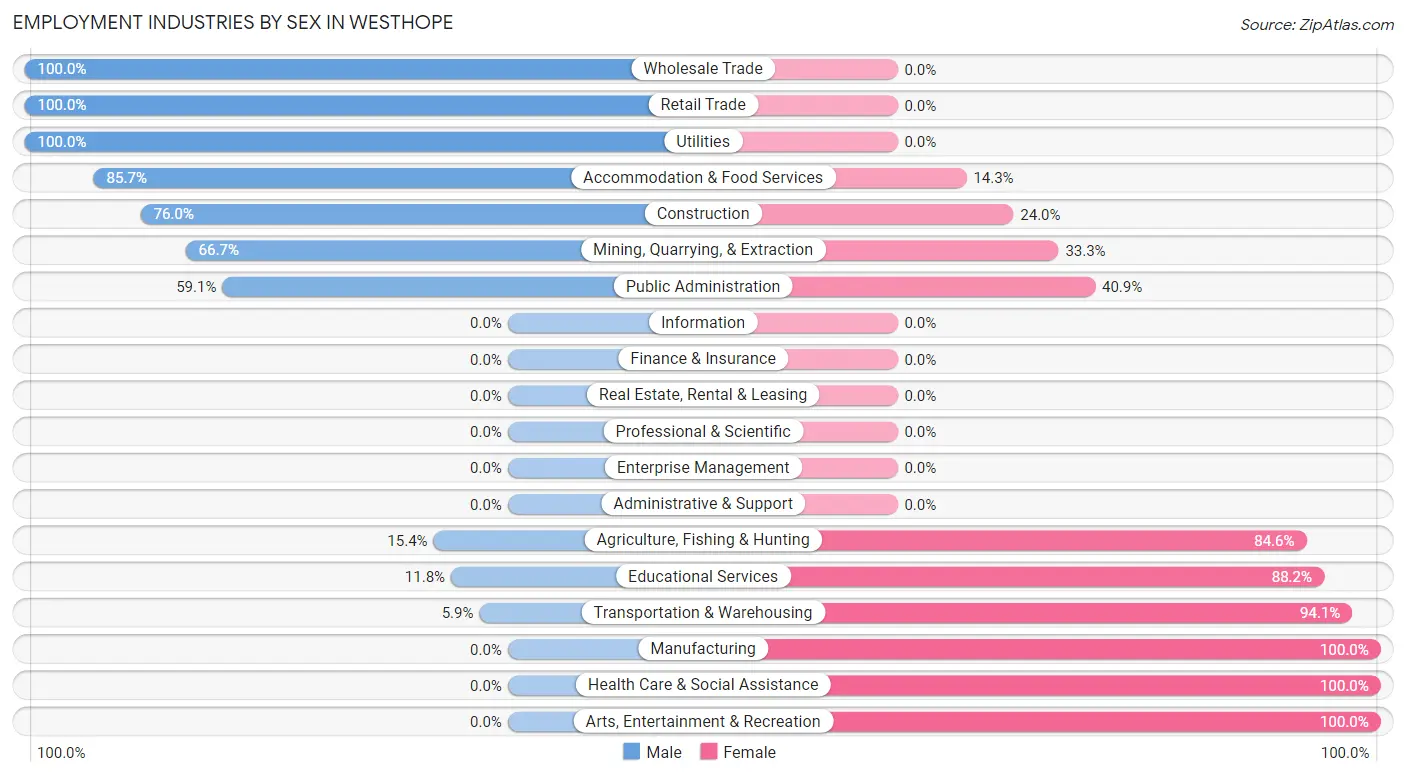
Employment Industries by Sex in Westhope
The Westhope industries that see more men than women are Wholesale Trade (100.0%), Retail Trade (100.0%), and Utilities (100.0%), whereas the industries that tend to have a higher number of women are Manufacturing (100.0%), Health Care & Social Assistance (100.0%), and Arts, Entertainment & Recreation (100.0%).
| Industry | Male | Female |
| Agriculture, Fishing & Hunting | 2 (15.4%) | 11 (84.6%) |
| Mining, Quarrying, & Extraction | 16 (66.7%) | 8 (33.3%) |
| Construction | 19 (76.0%) | 6 (24.0%) |
| Manufacturing | 0 (0.0%) | 1 (100.0%) |
| Wholesale Trade | 9 (100.0%) | 0 (0.0%) |
| Retail Trade | 4 (100.0%) | 0 (0.0%) |
| Transportation & Warehousing | 2 (5.9%) | 32 (94.1%) |
| Utilities | 2 (100.0%) | 0 (0.0%) |
| Information | 0 (0.0%) | 0 (0.0%) |
| Finance & Insurance | 0 (0.0%) | 0 (0.0%) |
| Real Estate, Rental & Leasing | 0 (0.0%) | 0 (0.0%) |
| Professional & Scientific | 0 (0.0%) | 0 (0.0%) |
| Enterprise Management | 0 (0.0%) | 0 (0.0%) |
| Administrative & Support | 0 (0.0%) | 0 (0.0%) |
| Educational Services | 2 (11.8%) | 15 (88.2%) |
| Health Care & Social Assistance | 0 (0.0%) | 17 (100.0%) |
| Arts, Entertainment & Recreation | 0 (0.0%) | 5 (100.0%) |
| Accommodation & Food Services | 6 (85.7%) | 1 (14.3%) |
| Public Administration | 13 (59.1%) | 9 (40.9%) |
| Total | 75 (41.2%) | 107 (58.8%) |
Education in Westhope
School Enrollment in Westhope
The most common levels of schooling among the 56 students in Westhope are elementary school (16 | 28.6%), high school (14 | 25.0%), and middle school (13 | 23.2%).
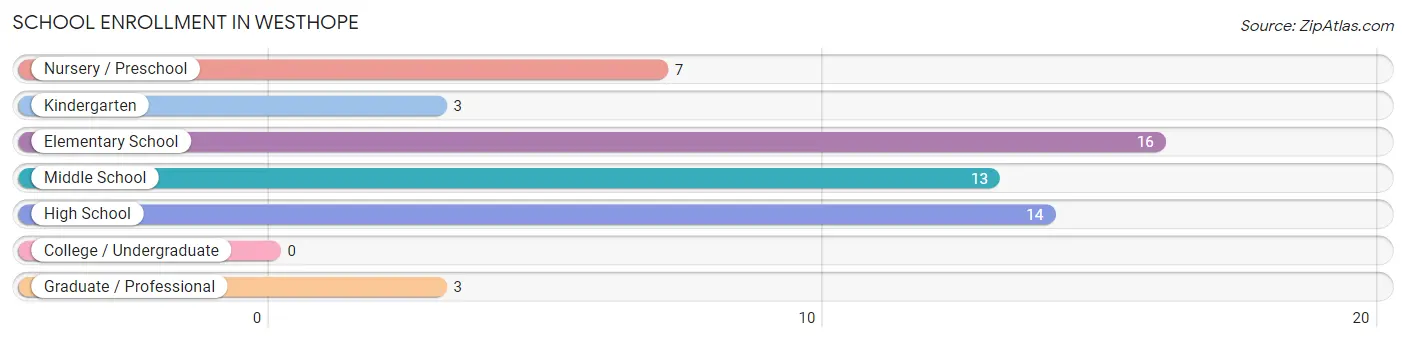
| School Level | # Students | % Students |
| Nursery / Preschool | 7 | 12.5% |
| Kindergarten | 3 | 5.4% |
| Elementary School | 16 | 28.6% |
| Middle School | 13 | 23.2% |
| High School | 14 | 25.0% |
| College / Undergraduate | 0 | 0.0% |
| Graduate / Professional | 3 | 5.4% |
| Total | 56 | 100.0% |
School Enrollment by Age by Funding Source in Westhope
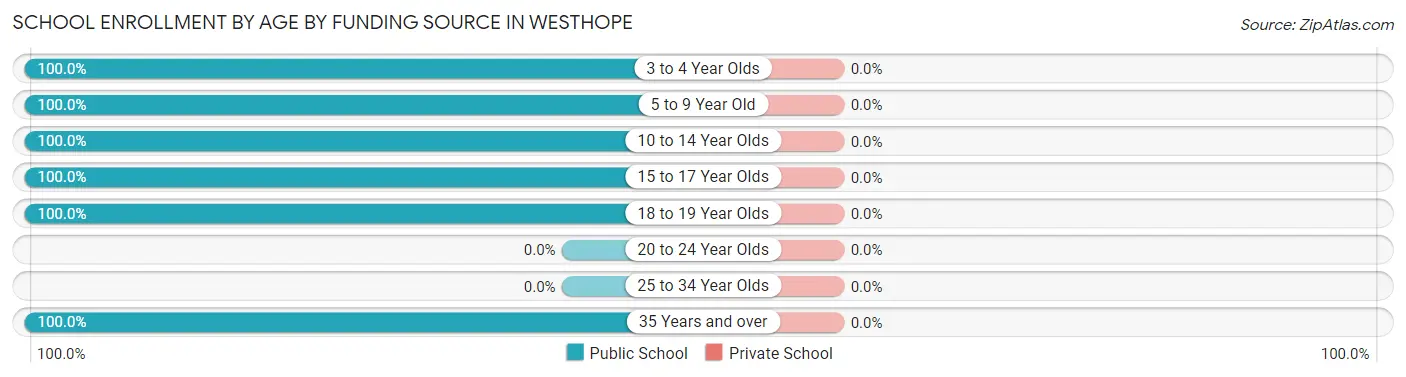
| Age Bracket | Public School | Private School |
| 3 to 4 Year Olds | 6 (100.0%) | 0 (0.0%) |
| 5 to 9 Year Old | 16 (100.0%) | 0 (0.0%) |
| 10 to 14 Year Olds | 17 (100.0%) | 0 (0.0%) |
| 15 to 17 Year Olds | 11 (100.0%) | 0 (0.0%) |
| 18 to 19 Year Olds | 3 (100.0%) | 0 (0.0%) |
| 20 to 24 Year Olds | 0 (0.0%) | 0 (0.0%) |
| 25 to 34 Year Olds | 0 (0.0%) | 0 (0.0%) |
| 35 Years and over | 3 (100.0%) | 0 (0.0%) |
| Total | 56 (100.0%) | 0 (0.0%) |
Educational Attainment by Field of Study in Westhope
Social sciences (28 | 34.2%), bio, nature & agricultural (13 | 15.9%), education (12 | 14.6%), arts & humanities (9 | 11.0%), and physical & health sciences (6 | 7.3%) are the most common fields of study among 82 individuals in Westhope who have obtained a bachelor's degree or higher.
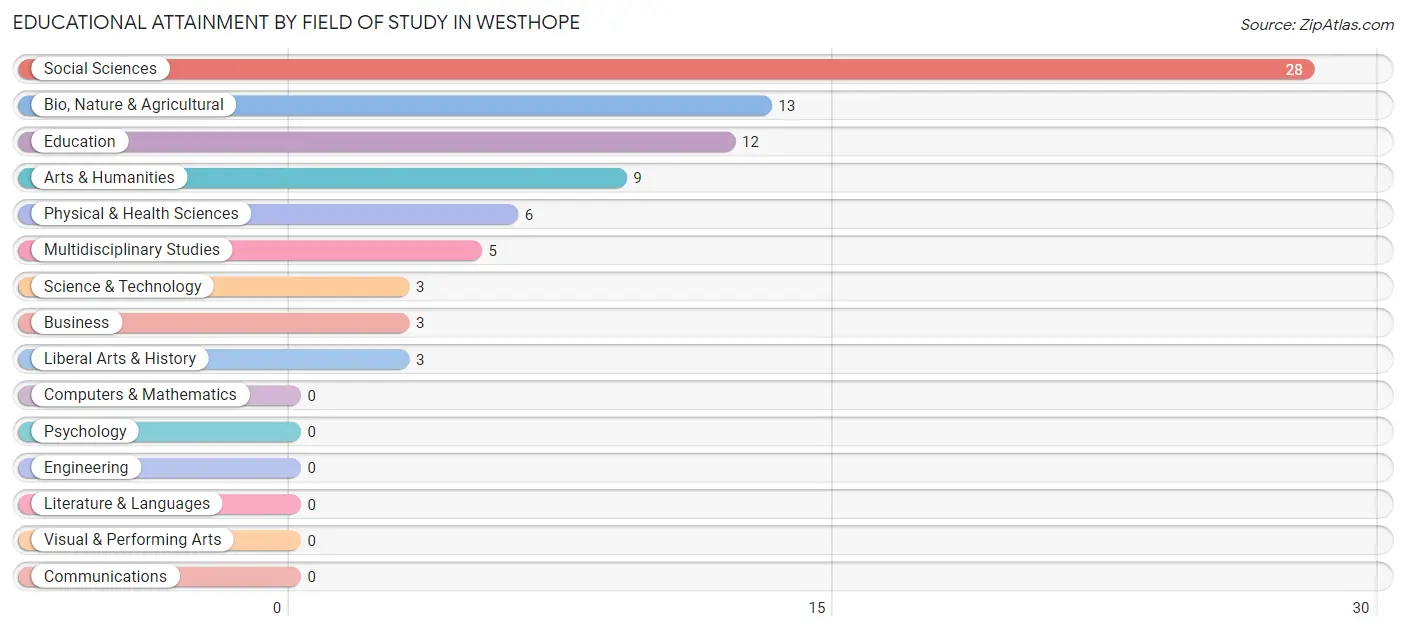
| Field of Study | # Graduates | % Graduates |
| Computers & Mathematics | 0 | 0.0% |
| Bio, Nature & Agricultural | 13 | 15.9% |
| Physical & Health Sciences | 6 | 7.3% |
| Psychology | 0 | 0.0% |
| Social Sciences | 28 | 34.2% |
| Engineering | 0 | 0.0% |
| Multidisciplinary Studies | 5 | 6.1% |
| Science & Technology | 3 | 3.7% |
| Business | 3 | 3.7% |
| Education | 12 | 14.6% |
| Literature & Languages | 0 | 0.0% |
| Liberal Arts & History | 3 | 3.7% |
| Visual & Performing Arts | 0 | 0.0% |
| Communications | 0 | 0.0% |
| Arts & Humanities | 9 | 11.0% |
| Total | 82 | 100.0% |
Transportation & Commute in Westhope
Vehicle Availability by Sex in Westhope
The most prevalent vehicle ownership categories in Westhope are males with 3 vehicles (28, accounting for 35.0%) and females with 3 vehicles (28, making up 30.8%).
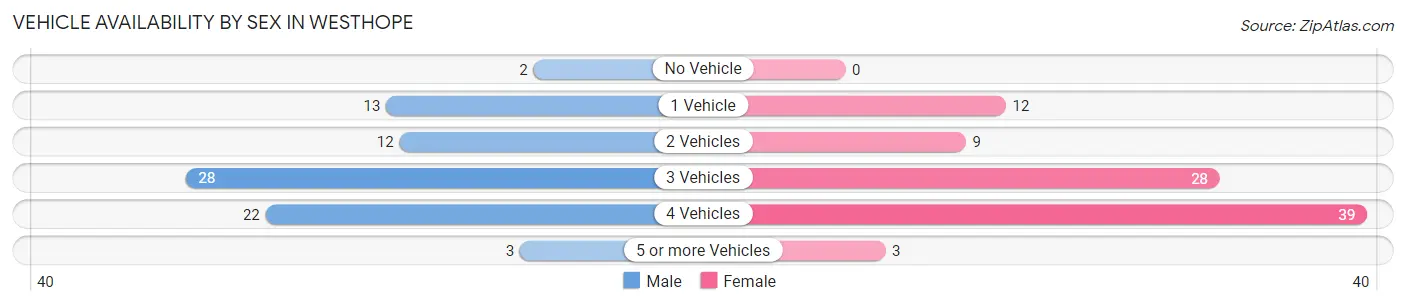
| Vehicles Available | Male | Female |
| No Vehicle | 2 (2.5%) | 0 (0.0%) |
| 1 Vehicle | 13 (16.3%) | 12 (13.2%) |
| 2 Vehicles | 12 (15.0%) | 9 (9.9%) |
| 3 Vehicles | 28 (35.0%) | 28 (30.8%) |
| 4 Vehicles | 22 (27.5%) | 39 (42.9%) |
| 5 or more Vehicles | 3 (3.7%) | 3 (3.3%) |
| Total | 80 (100.0%) | 91 (100.0%) |
Commute Time in Westhope
The most frequently occuring commute durations in Westhope are 5 to 9 minutes (36 commuters, 22.1%), 60 to 89 minutes (36 commuters, 22.1%), and less than 5 minutes (29 commuters, 17.8%).
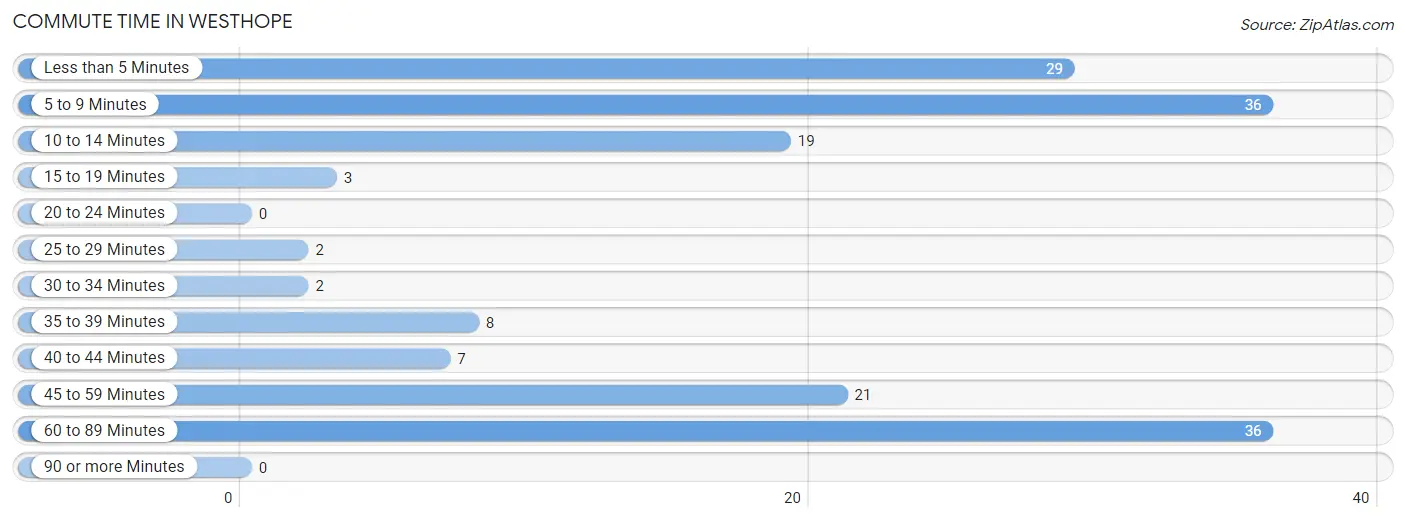
| Commute Time | # Commuters | % Commuters |
| Less than 5 Minutes | 29 | 17.8% |
| 5 to 9 Minutes | 36 | 22.1% |
| 10 to 14 Minutes | 19 | 11.7% |
| 15 to 19 Minutes | 3 | 1.8% |
| 20 to 24 Minutes | 0 | 0.0% |
| 25 to 29 Minutes | 2 | 1.2% |
| 30 to 34 Minutes | 2 | 1.2% |
| 35 to 39 Minutes | 8 | 4.9% |
| 40 to 44 Minutes | 7 | 4.3% |
| 45 to 59 Minutes | 21 | 12.9% |
| 60 to 89 Minutes | 36 | 22.1% |
| 90 or more Minutes | 0 | 0.0% |
Commute Time by Sex in Westhope
The most common commute times in Westhope are 5 to 9 minutes (24 commuters, 30.0%) for males and 60 to 89 minutes (25 commuters, 30.1%) for females.
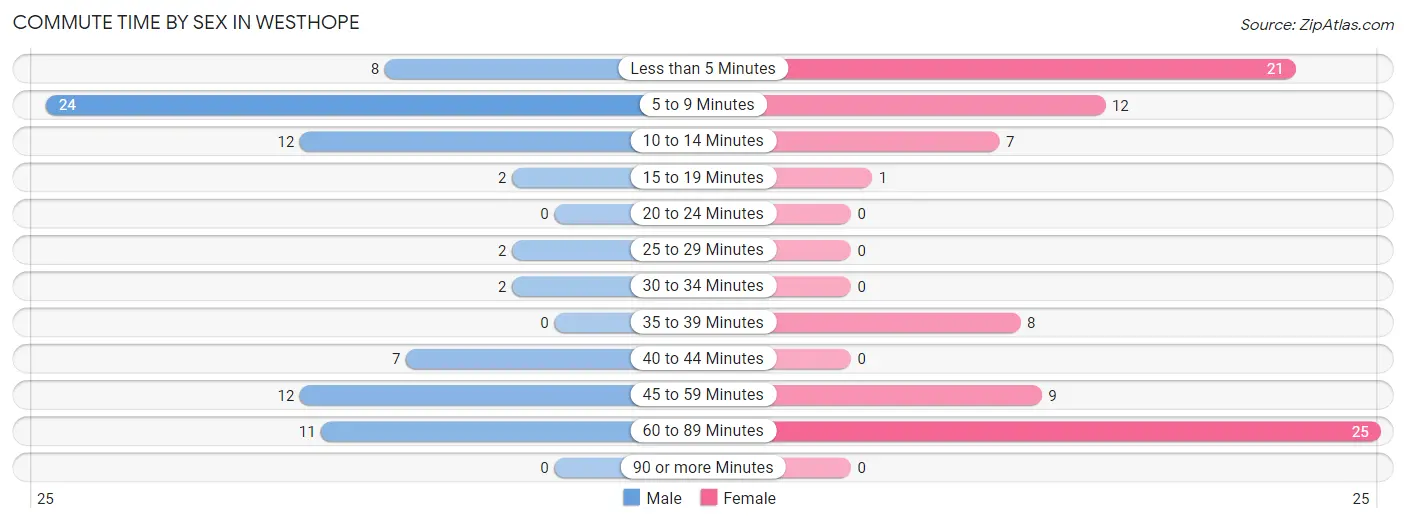
| Commute Time | Male | Female |
| Less than 5 Minutes | 8 (10.0%) | 21 (25.3%) |
| 5 to 9 Minutes | 24 (30.0%) | 12 (14.5%) |
| 10 to 14 Minutes | 12 (15.0%) | 7 (8.4%) |
| 15 to 19 Minutes | 2 (2.5%) | 1 (1.2%) |
| 20 to 24 Minutes | 0 (0.0%) | 0 (0.0%) |
| 25 to 29 Minutes | 2 (2.5%) | 0 (0.0%) |
| 30 to 34 Minutes | 2 (2.5%) | 0 (0.0%) |
| 35 to 39 Minutes | 0 (0.0%) | 8 (9.6%) |
| 40 to 44 Minutes | 7 (8.7%) | 0 (0.0%) |
| 45 to 59 Minutes | 12 (15.0%) | 9 (10.8%) |
| 60 to 89 Minutes | 11 (13.8%) | 25 (30.1%) |
| 90 or more Minutes | 0 (0.0%) | 0 (0.0%) |
Time of Departure to Work by Sex in Westhope
The most frequent times of departure to work in Westhope are 6:00 AM to 6:29 AM (15, 18.8%) for males and 12:00 PM to 3:59 PM (30, 36.1%) for females.
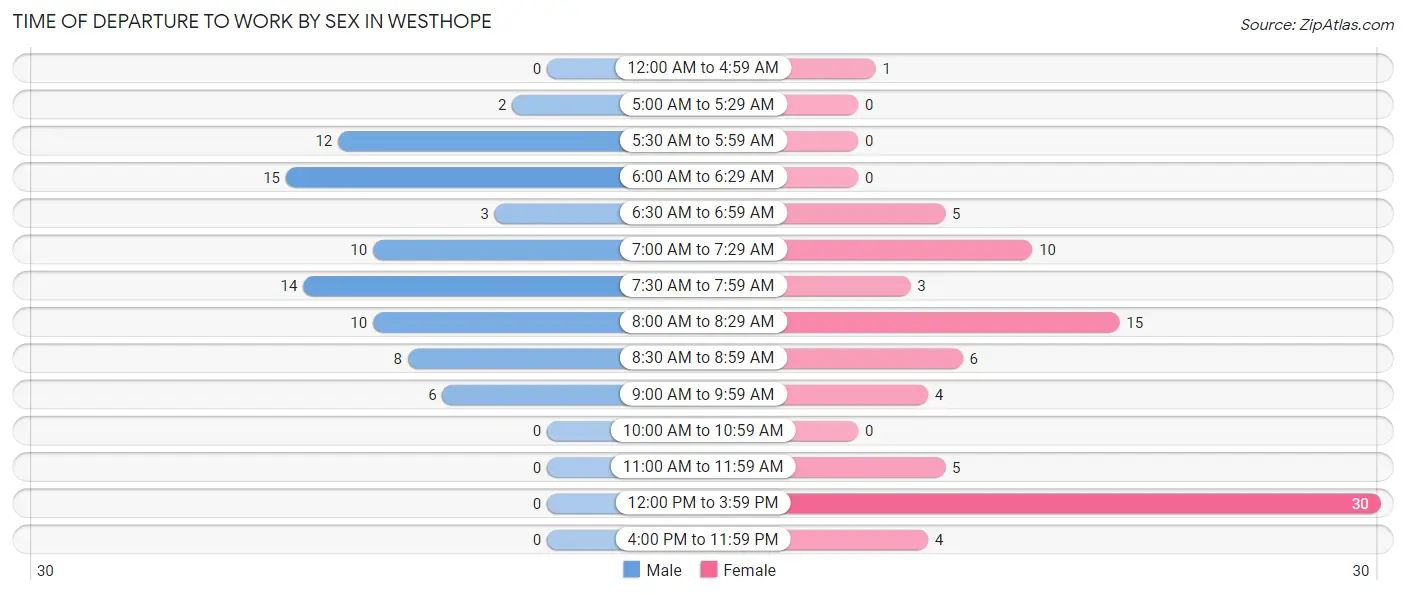
| Time of Departure | Male | Female |
| 12:00 AM to 4:59 AM | 0 (0.0%) | 1 (1.2%) |
| 5:00 AM to 5:29 AM | 2 (2.5%) | 0 (0.0%) |
| 5:30 AM to 5:59 AM | 12 (15.0%) | 0 (0.0%) |
| 6:00 AM to 6:29 AM | 15 (18.8%) | 0 (0.0%) |
| 6:30 AM to 6:59 AM | 3 (3.7%) | 5 (6.0%) |
| 7:00 AM to 7:29 AM | 10 (12.5%) | 10 (12.0%) |
| 7:30 AM to 7:59 AM | 14 (17.5%) | 3 (3.6%) |
| 8:00 AM to 8:29 AM | 10 (12.5%) | 15 (18.1%) |
| 8:30 AM to 8:59 AM | 8 (10.0%) | 6 (7.2%) |
| 9:00 AM to 9:59 AM | 6 (7.5%) | 4 (4.8%) |
| 10:00 AM to 10:59 AM | 0 (0.0%) | 0 (0.0%) |
| 11:00 AM to 11:59 AM | 0 (0.0%) | 5 (6.0%) |
| 12:00 PM to 3:59 PM | 0 (0.0%) | 30 (36.1%) |
| 4:00 PM to 11:59 PM | 0 (0.0%) | 4 (4.8%) |
| Total | 80 (100.0%) | 83 (100.0%) |
Housing Occupancy in Westhope
Occupancy by Ownership in Westhope
Of the total 128 dwellings in Westhope, owner-occupied units account for 113 (88.3%), while renter-occupied units make up 15 (11.7%).
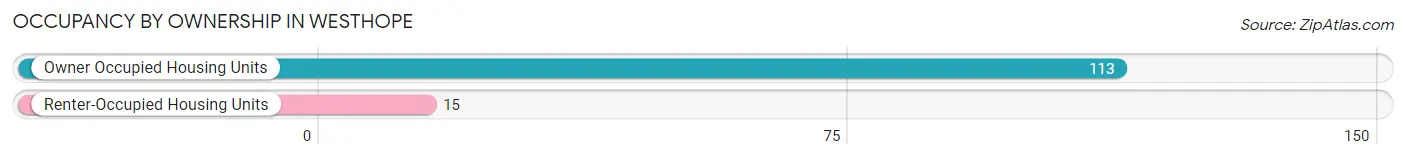
| Occupancy | # Housing Units | % Housing Units |
| Owner Occupied Housing Units | 113 | 88.3% |
| Renter-Occupied Housing Units | 15 | 11.7% |
| Total Occupied Housing Units | 128 | 100.0% |
Occupancy by Household Size in Westhope
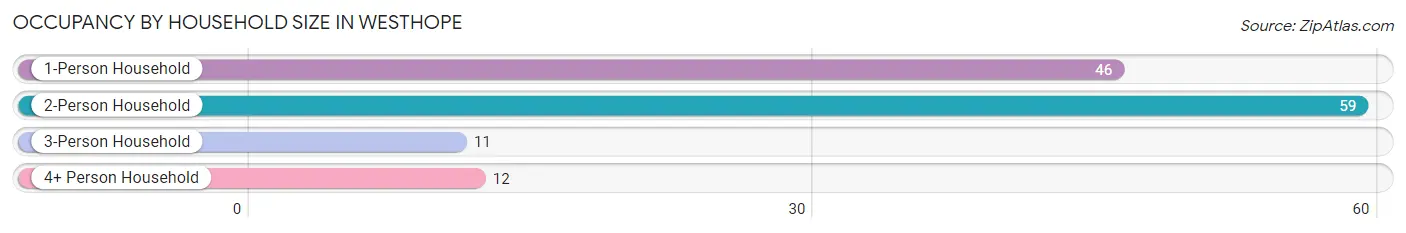
| Household Size | # Housing Units | % Housing Units |
| 1-Person Household | 46 | 35.9% |
| 2-Person Household | 59 | 46.1% |
| 3-Person Household | 11 | 8.6% |
| 4+ Person Household | 12 | 9.4% |
| Total Housing Units | 128 | 100.0% |
Occupancy by Ownership by Household Size in Westhope
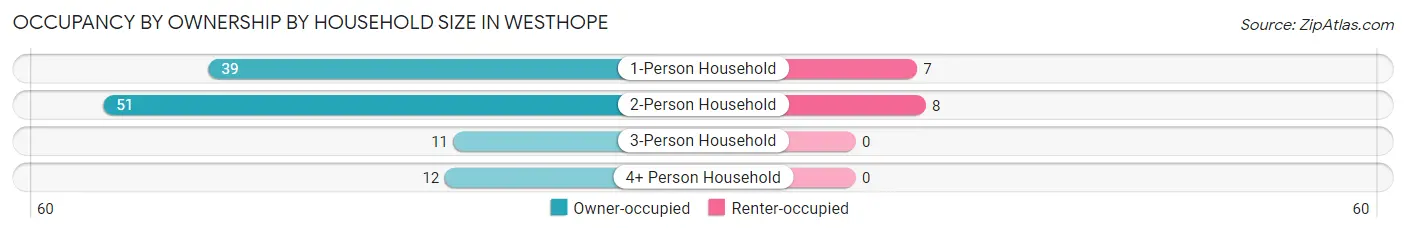
| Household Size | Owner-occupied | Renter-occupied |
| 1-Person Household | 39 (84.8%) | 7 (15.2%) |
| 2-Person Household | 51 (86.4%) | 8 (13.6%) |
| 3-Person Household | 11 (100.0%) | 0 (0.0%) |
| 4+ Person Household | 12 (100.0%) | 0 (0.0%) |
| Total Housing Units | 113 (88.3%) | 15 (11.7%) |
Occupancy by Educational Attainment in Westhope
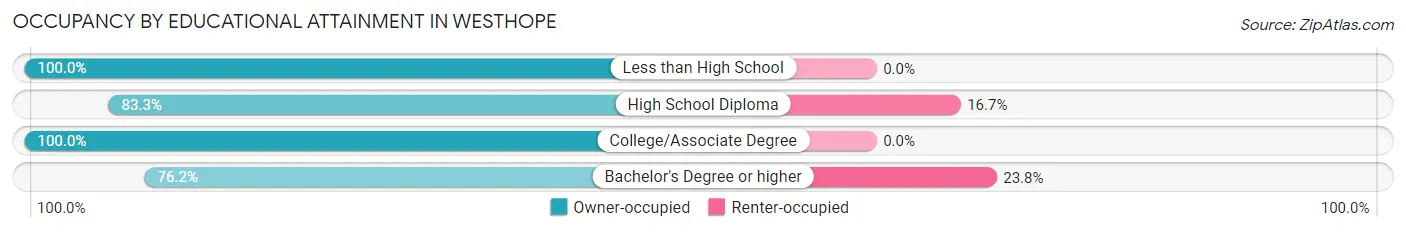
| Household Size | Owner-occupied | Renter-occupied |
| Less than High School | 14 (100.0%) | 0 (0.0%) |
| High School Diploma | 25 (83.3%) | 5 (16.7%) |
| College/Associate Degree | 42 (100.0%) | 0 (0.0%) |
| Bachelor's Degree or higher | 32 (76.2%) | 10 (23.8%) |
Occupancy by Age of Householder in Westhope
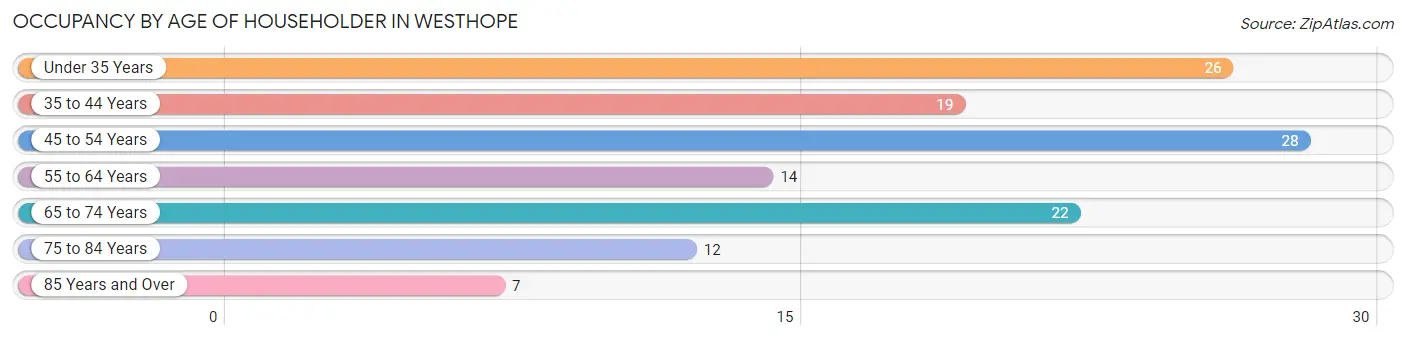
| Age Bracket | # Households | % Households |
| Under 35 Years | 26 | 20.3% |
| 35 to 44 Years | 19 | 14.8% |
| 45 to 54 Years | 28 | 21.9% |
| 55 to 64 Years | 14 | 10.9% |
| 65 to 74 Years | 22 | 17.2% |
| 75 to 84 Years | 12 | 9.4% |
| 85 Years and Over | 7 | 5.5% |
| Total | 128 | 100.0% |
Housing Finances in Westhope
Median Income by Occupancy in Westhope
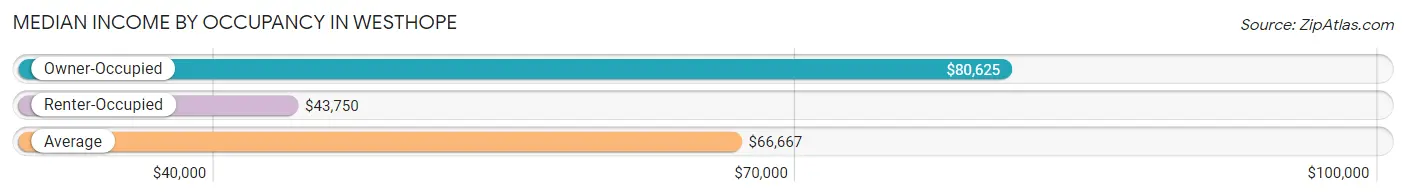
| Occupancy Type | # Households | Median Income |
| Owner-Occupied | 113 (88.3%) | $80,625 |
| Renter-Occupied | 15 (11.7%) | $43,750 |
| Average | 128 (100.0%) | $66,667 |
Occupancy by Householder Income Bracket in Westhope
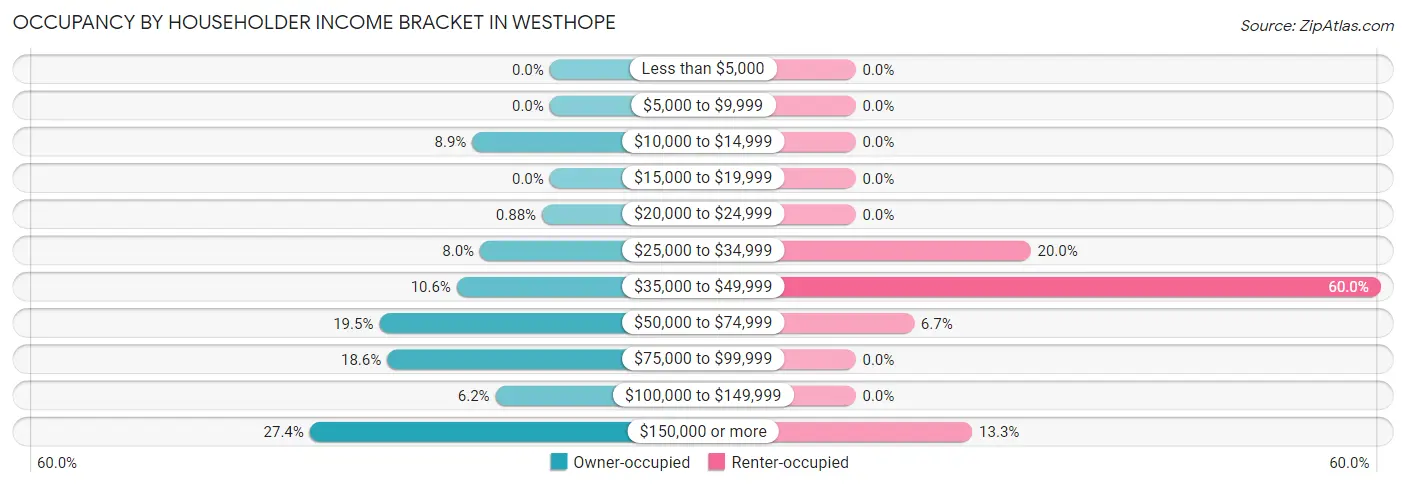
| Income Bracket | Owner-occupied | Renter-occupied |
| Less than $5,000 | 0 (0.0%) | 0 (0.0%) |
| $5,000 to $9,999 | 0 (0.0%) | 0 (0.0%) |
| $10,000 to $14,999 | 10 (8.8%) | 0 (0.0%) |
| $15,000 to $19,999 | 0 (0.0%) | 0 (0.0%) |
| $20,000 to $24,999 | 1 (0.9%) | 0 (0.0%) |
| $25,000 to $34,999 | 9 (8.0%) | 3 (20.0%) |
| $35,000 to $49,999 | 12 (10.6%) | 9 (60.0%) |
| $50,000 to $74,999 | 22 (19.5%) | 1 (6.7%) |
| $75,000 to $99,999 | 21 (18.6%) | 0 (0.0%) |
| $100,000 to $149,999 | 7 (6.2%) | 0 (0.0%) |
| $150,000 or more | 31 (27.4%) | 2 (13.3%) |
| Total | 113 (100.0%) | 15 (100.0%) |
Monthly Housing Cost Tiers in Westhope
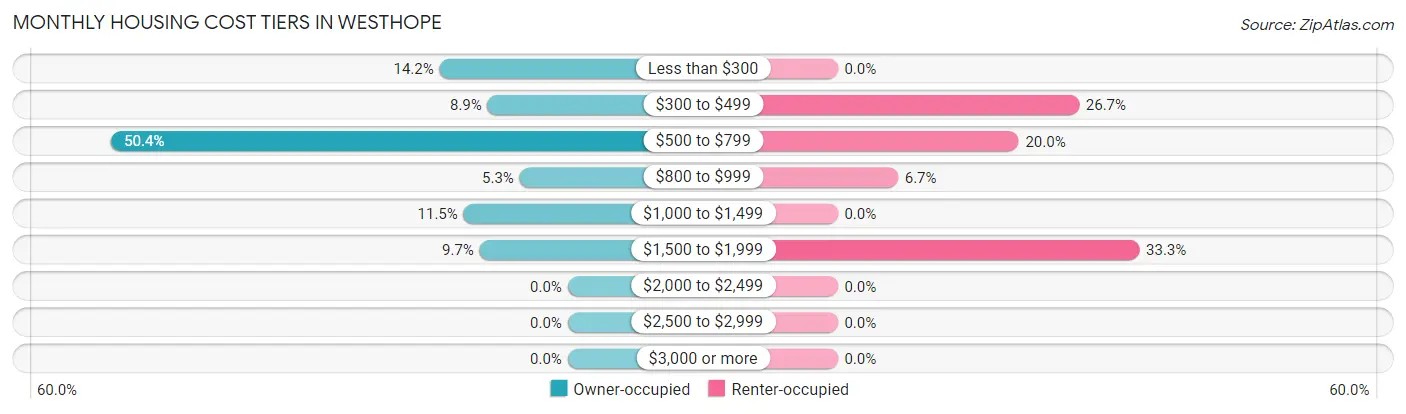
| Monthly Cost | Owner-occupied | Renter-occupied |
| Less than $300 | 16 (14.2%) | 0 (0.0%) |
| $300 to $499 | 10 (8.8%) | 4 (26.7%) |
| $500 to $799 | 57 (50.4%) | 3 (20.0%) |
| $800 to $999 | 6 (5.3%) | 1 (6.7%) |
| $1,000 to $1,499 | 13 (11.5%) | 0 (0.0%) |
| $1,500 to $1,999 | 11 (9.7%) | 5 (33.3%) |
| $2,000 to $2,499 | 0 (0.0%) | 0 (0.0%) |
| $2,500 to $2,999 | 0 (0.0%) | 0 (0.0%) |
| $3,000 or more | 0 (0.0%) | 0 (0.0%) |
| Total | 113 (100.0%) | 15 (100.0%) |
Physical Housing Characteristics in Westhope
Housing Structures in Westhope
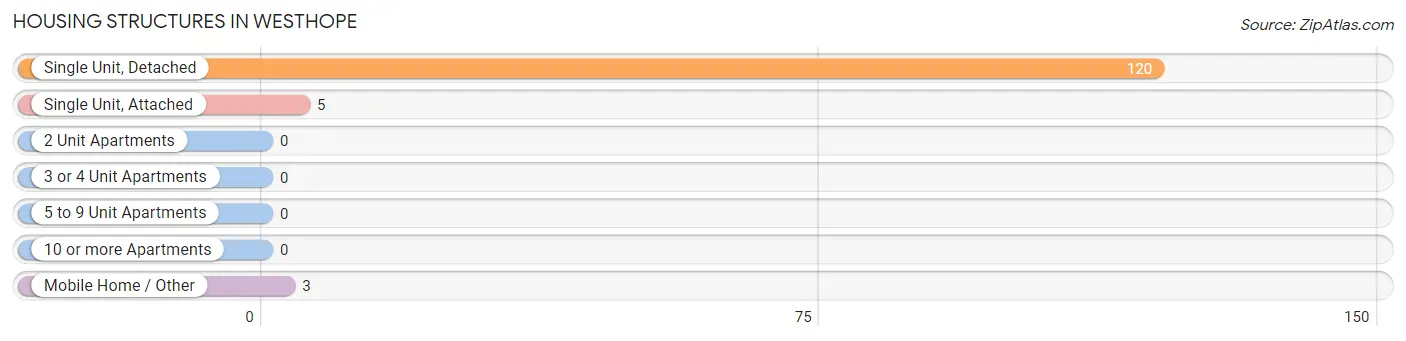
| Structure Type | # Housing Units | % Housing Units |
| Single Unit, Detached | 120 | 93.8% |
| Single Unit, Attached | 5 | 3.9% |
| 2 Unit Apartments | 0 | 0.0% |
| 3 or 4 Unit Apartments | 0 | 0.0% |
| 5 to 9 Unit Apartments | 0 | 0.0% |
| 10 or more Apartments | 0 | 0.0% |
| Mobile Home / Other | 3 | 2.3% |
| Total | 128 | 100.0% |
Housing Structures by Occupancy in Westhope
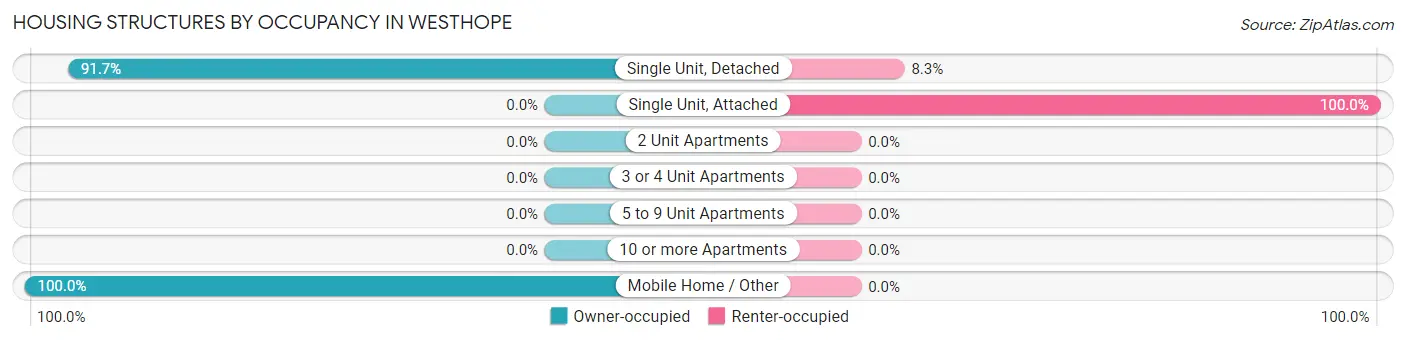
| Structure Type | Owner-occupied | Renter-occupied |
| Single Unit, Detached | 110 (91.7%) | 10 (8.3%) |
| Single Unit, Attached | 0 (0.0%) | 5 (100.0%) |
| 2 Unit Apartments | 0 (0.0%) | 0 (0.0%) |
| 3 or 4 Unit Apartments | 0 (0.0%) | 0 (0.0%) |
| 5 to 9 Unit Apartments | 0 (0.0%) | 0 (0.0%) |
| 10 or more Apartments | 0 (0.0%) | 0 (0.0%) |
| Mobile Home / Other | 3 (100.0%) | 0 (0.0%) |
| Total | 113 (88.3%) | 15 (11.7%) |
Housing Structures by Number of Rooms in Westhope
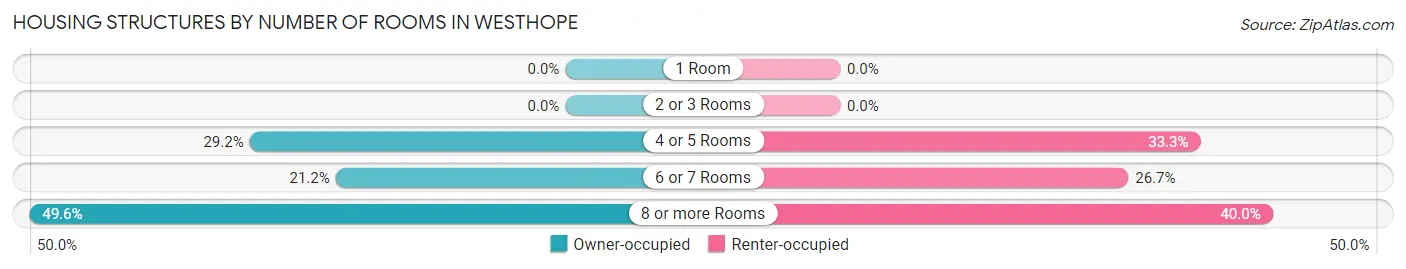
| Number of Rooms | Owner-occupied | Renter-occupied |
| 1 Room | 0 (0.0%) | 0 (0.0%) |
| 2 or 3 Rooms | 0 (0.0%) | 0 (0.0%) |
| 4 or 5 Rooms | 33 (29.2%) | 5 (33.3%) |
| 6 or 7 Rooms | 24 (21.2%) | 4 (26.7%) |
| 8 or more Rooms | 56 (49.6%) | 6 (40.0%) |
| Total | 113 (100.0%) | 15 (100.0%) |
Housing Structure by Heating Type in Westhope
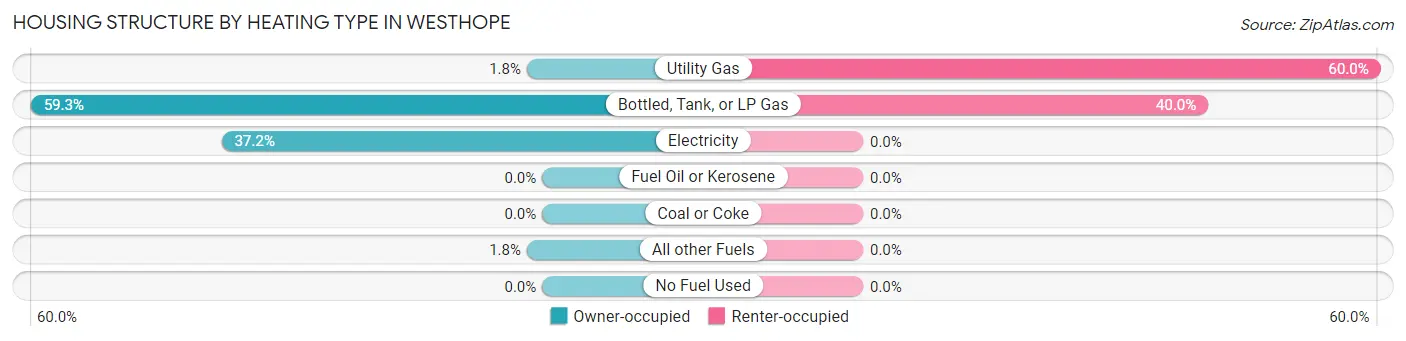
| Heating Type | Owner-occupied | Renter-occupied |
| Utility Gas | 2 (1.8%) | 9 (60.0%) |
| Bottled, Tank, or LP Gas | 67 (59.3%) | 6 (40.0%) |
| Electricity | 42 (37.2%) | 0 (0.0%) |
| Fuel Oil or Kerosene | 0 (0.0%) | 0 (0.0%) |
| Coal or Coke | 0 (0.0%) | 0 (0.0%) |
| All other Fuels | 2 (1.8%) | 0 (0.0%) |
| No Fuel Used | 0 (0.0%) | 0 (0.0%) |
| Total | 113 (100.0%) | 15 (100.0%) |
Household Vehicle Usage in Westhope
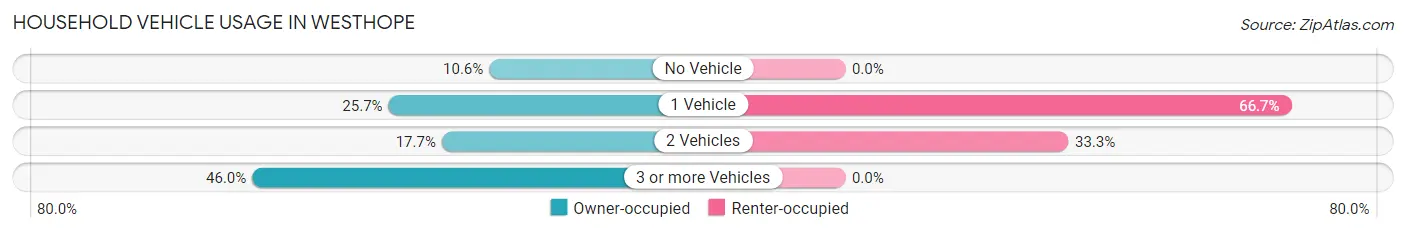
| Vehicles per Household | Owner-occupied | Renter-occupied |
| No Vehicle | 12 (10.6%) | 0 (0.0%) |
| 1 Vehicle | 29 (25.7%) | 10 (66.7%) |
| 2 Vehicles | 20 (17.7%) | 5 (33.3%) |
| 3 or more Vehicles | 52 (46.0%) | 0 (0.0%) |
| Total | 113 (100.0%) | 15 (100.0%) |
Real Estate & Mortgages in Westhope
Real Estate and Mortgage Overview in Westhope
| Characteristic | Without Mortgage | With Mortgage |
| Housing Units | 78 | 35 |
| Median Property Value | $98,000 | $134,400 |
| Median Household Income | $73,750 | $7 |
| Monthly Housing Costs | $568 | $0 |
| Real Estate Taxes | $960 | $0 |
Property Value by Mortgage Status in Westhope
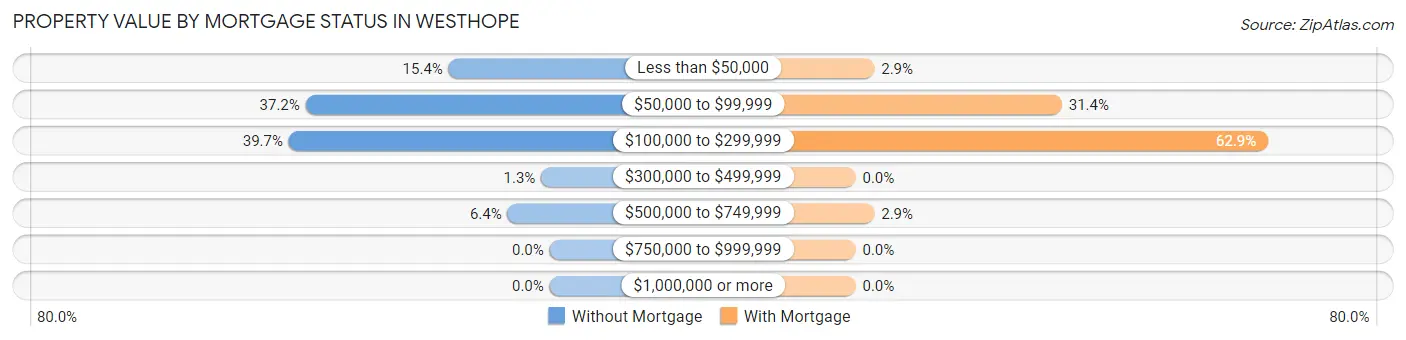
| Property Value | Without Mortgage | With Mortgage |
| Less than $50,000 | 12 (15.4%) | 1 (2.9%) |
| $50,000 to $99,999 | 29 (37.2%) | 11 (31.4%) |
| $100,000 to $299,999 | 31 (39.7%) | 22 (62.9%) |
| $300,000 to $499,999 | 1 (1.3%) | 0 (0.0%) |
| $500,000 to $749,999 | 5 (6.4%) | 1 (2.9%) |
| $750,000 to $999,999 | 0 (0.0%) | 0 (0.0%) |
| $1,000,000 or more | 0 (0.0%) | 0 (0.0%) |
| Total | 78 (100.0%) | 35 (100.0%) |
Household Income by Mortgage Status in Westhope
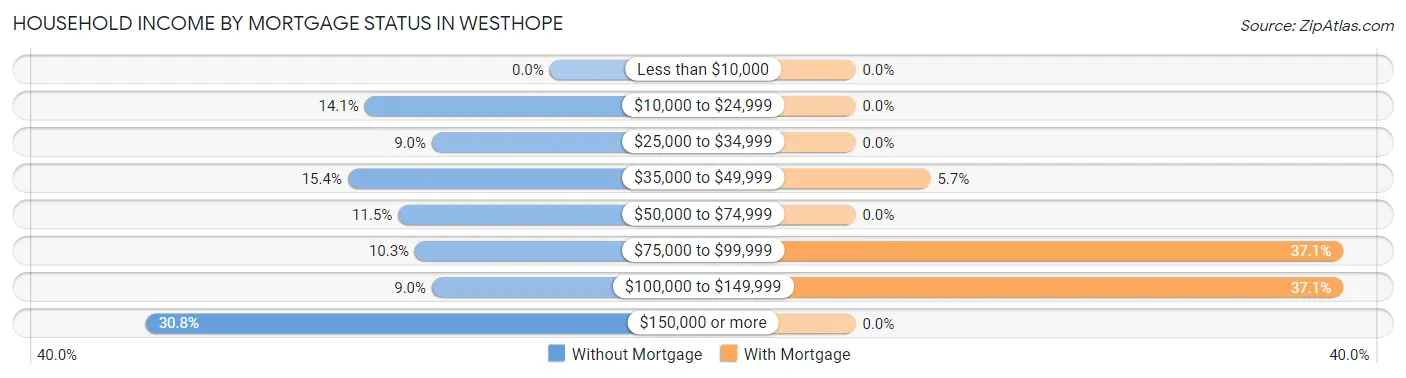
| Household Income | Without Mortgage | With Mortgage |
| Less than $10,000 | 0 (0.0%) | 0 (0.0%) |
| $10,000 to $24,999 | 11 (14.1%) | 0 (0.0%) |
| $25,000 to $34,999 | 7 (9.0%) | 0 (0.0%) |
| $35,000 to $49,999 | 12 (15.4%) | 2 (5.7%) |
| $50,000 to $74,999 | 9 (11.5%) | 0 (0.0%) |
| $75,000 to $99,999 | 8 (10.3%) | 13 (37.1%) |
| $100,000 to $149,999 | 7 (9.0%) | 13 (37.1%) |
| $150,000 or more | 24 (30.8%) | 0 (0.0%) |
| Total | 78 (100.0%) | 35 (100.0%) |
Property Value to Household Income Ratio in Westhope
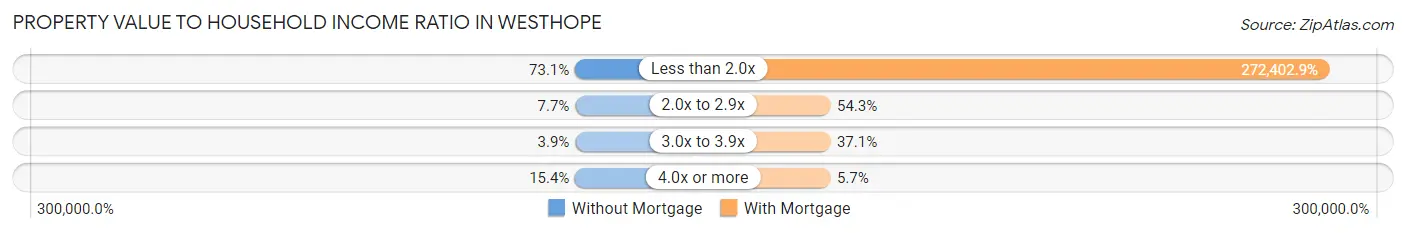
| Value-to-Income Ratio | Without Mortgage | With Mortgage |
| Less than 2.0x | 57 (73.1%) | 95,341 (272,402.9%) |
| 2.0x to 2.9x | 6 (7.7%) | 19 (54.3%) |
| 3.0x to 3.9x | 3 (3.8%) | 13 (37.1%) |
| 4.0x or more | 12 (15.4%) | 2 (5.7%) |
| Total | 78 (100.0%) | 35 (100.0%) |
Real Estate Taxes by Mortgage Status in Westhope
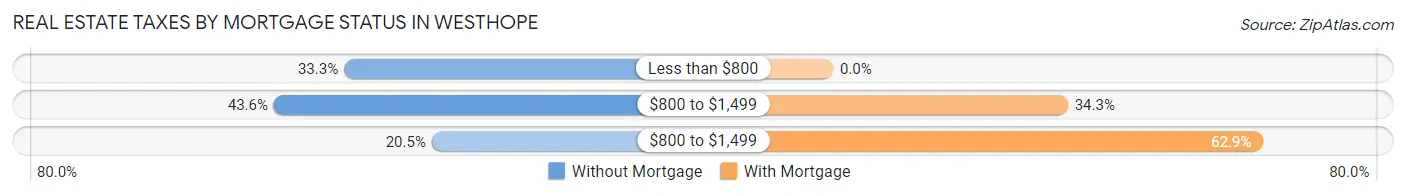
| Property Taxes | Without Mortgage | With Mortgage |
| Less than $800 | 26 (33.3%) | 0 (0.0%) |
| $800 to $1,499 | 34 (43.6%) | 12 (34.3%) |
| $800 to $1,499 | 16 (20.5%) | 22 (62.9%) |
| Total | 78 (100.0%) | 35 (100.0%) |
Health & Disability in Westhope
Health Insurance Coverage by Age in Westhope
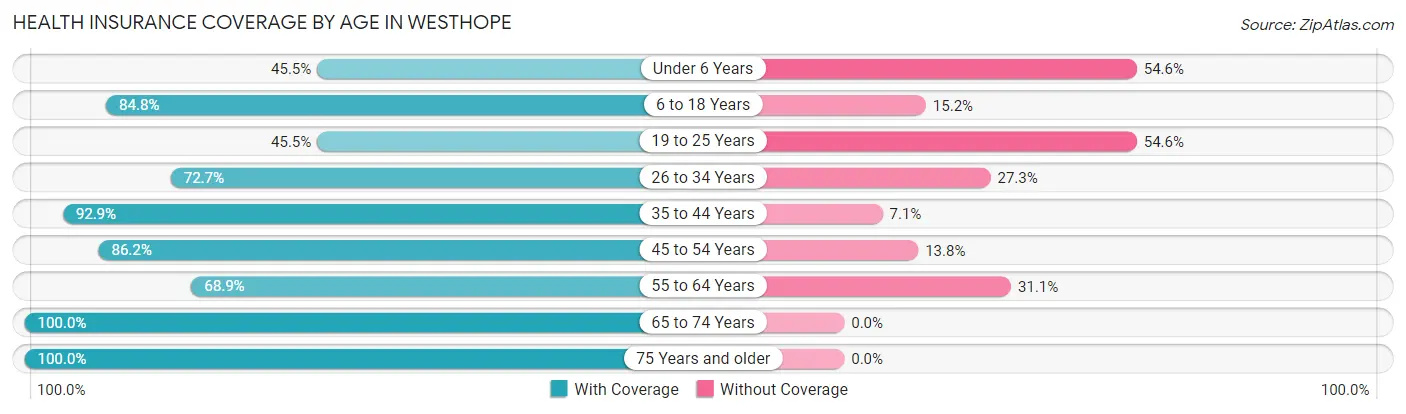
| Age Bracket | With Coverage | Without Coverage |
| Under 6 Years | 5 (45.5%) | 6 (54.5%) |
| 6 to 18 Years | 39 (84.8%) | 7 (15.2%) |
| 19 to 25 Years | 5 (45.5%) | 6 (54.5%) |
| 26 to 34 Years | 16 (72.7%) | 6 (27.3%) |
| 35 to 44 Years | 26 (92.9%) | 2 (7.1%) |
| 45 to 54 Years | 50 (86.2%) | 8 (13.8%) |
| 55 to 64 Years | 62 (68.9%) | 28 (31.1%) |
| 65 to 74 Years | 36 (100.0%) | 0 (0.0%) |
| 75 Years and older | 29 (100.0%) | 0 (0.0%) |
| Total | 268 (81.0%) | 63 (19.0%) |
Health Insurance Coverage by Citizenship Status in Westhope
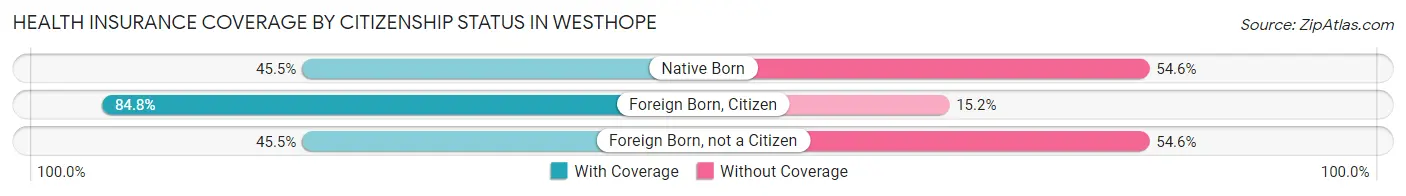
| Citizenship Status | With Coverage | Without Coverage |
| Native Born | 5 (45.5%) | 6 (54.5%) |
| Foreign Born, Citizen | 39 (84.8%) | 7 (15.2%) |
| Foreign Born, not a Citizen | 5 (45.5%) | 6 (54.5%) |
Health Insurance Coverage by Household Income in Westhope
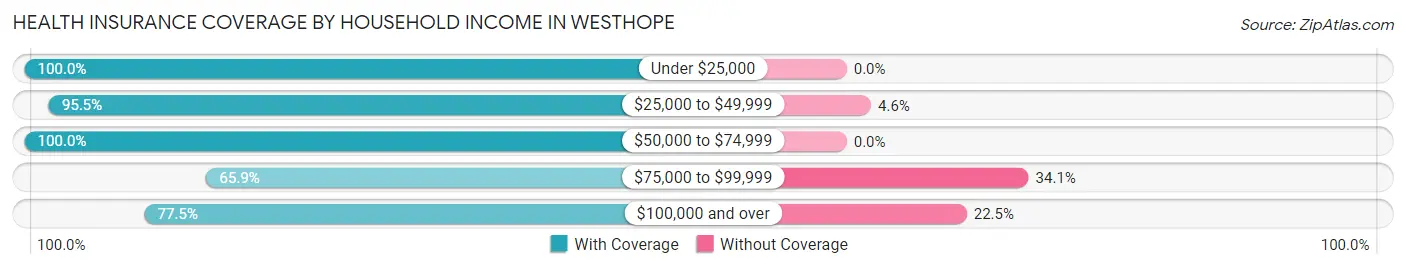
| Household Income | With Coverage | Without Coverage |
| Under $25,000 | 11 (100.0%) | 0 (0.0%) |
| $25,000 to $49,999 | 63 (95.5%) | 3 (4.5%) |
| $50,000 to $74,999 | 34 (100.0%) | 0 (0.0%) |
| $75,000 to $99,999 | 60 (65.9%) | 31 (34.1%) |
| $100,000 and over | 100 (77.5%) | 29 (22.5%) |
Public vs Private Health Insurance Coverage by Age in Westhope
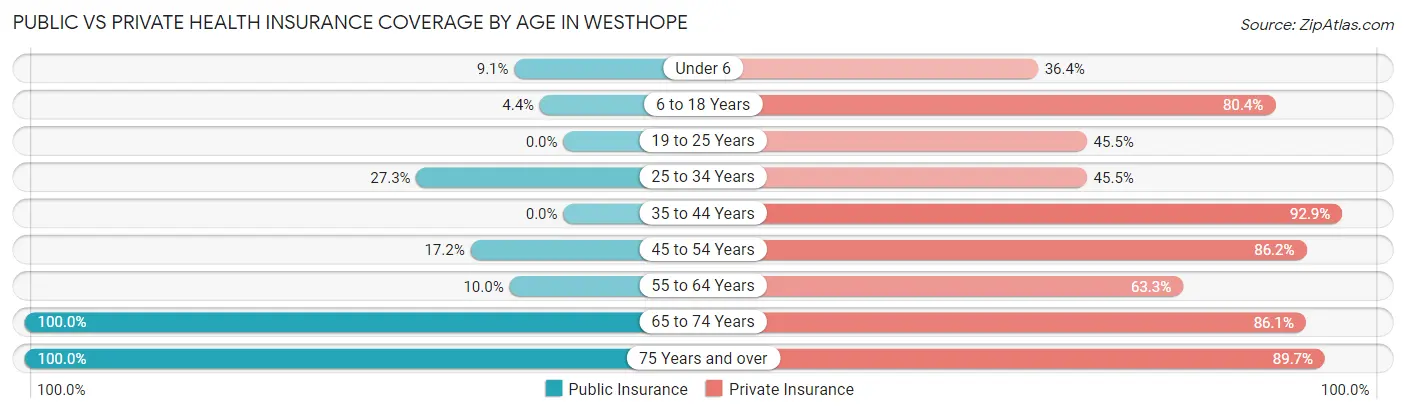
| Age Bracket | Public Insurance | Private Insurance |
| Under 6 | 1 (9.1%) | 4 (36.4%) |
| 6 to 18 Years | 2 (4.3%) | 37 (80.4%) |
| 19 to 25 Years | 0 (0.0%) | 5 (45.5%) |
| 25 to 34 Years | 6 (27.3%) | 10 (45.5%) |
| 35 to 44 Years | 0 (0.0%) | 26 (92.9%) |
| 45 to 54 Years | 10 (17.2%) | 50 (86.2%) |
| 55 to 64 Years | 9 (10.0%) | 57 (63.3%) |
| 65 to 74 Years | 36 (100.0%) | 31 (86.1%) |
| 75 Years and over | 29 (100.0%) | 26 (89.7%) |
| Total | 93 (28.1%) | 246 (74.3%) |
Disability Status by Sex by Age in Westhope
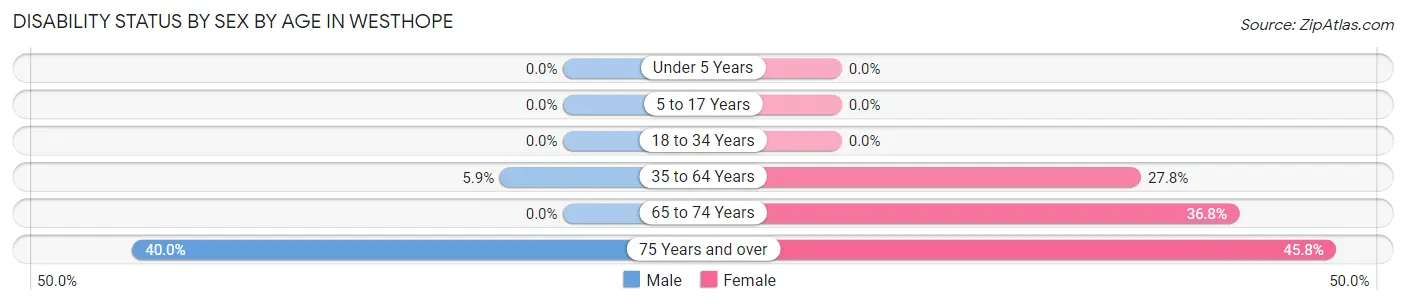
| Age Bracket | Male | Female |
| Under 5 Years | 0 (0.0%) | 0 (0.0%) |
| 5 to 17 Years | 0 (0.0%) | 0 (0.0%) |
| 18 to 34 Years | 0 (0.0%) | 0 (0.0%) |
| 35 to 64 Years | 4 (5.9%) | 30 (27.8%) |
| 65 to 74 Years | 0 (0.0%) | 7 (36.8%) |
| 75 Years and over | 2 (40.0%) | 11 (45.8%) |
Disability Class by Sex by Age in Westhope
Disability Class: Hearing Difficulty
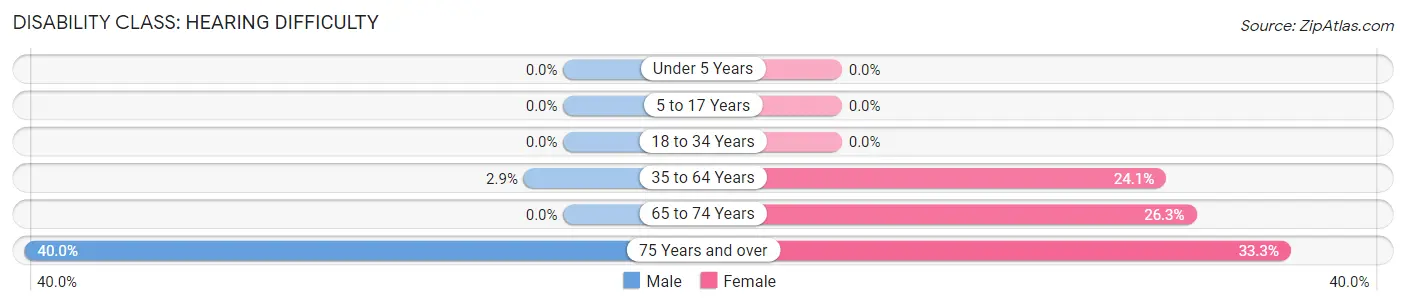
| Age Bracket | Male | Female |
| Under 5 Years | 0 (0.0%) | 0 (0.0%) |
| 5 to 17 Years | 0 (0.0%) | 0 (0.0%) |
| 18 to 34 Years | 0 (0.0%) | 0 (0.0%) |
| 35 to 64 Years | 2 (2.9%) | 26 (24.1%) |
| 65 to 74 Years | 0 (0.0%) | 5 (26.3%) |
| 75 Years and over | 2 (40.0%) | 8 (33.3%) |
Disability Class: Vision Difficulty
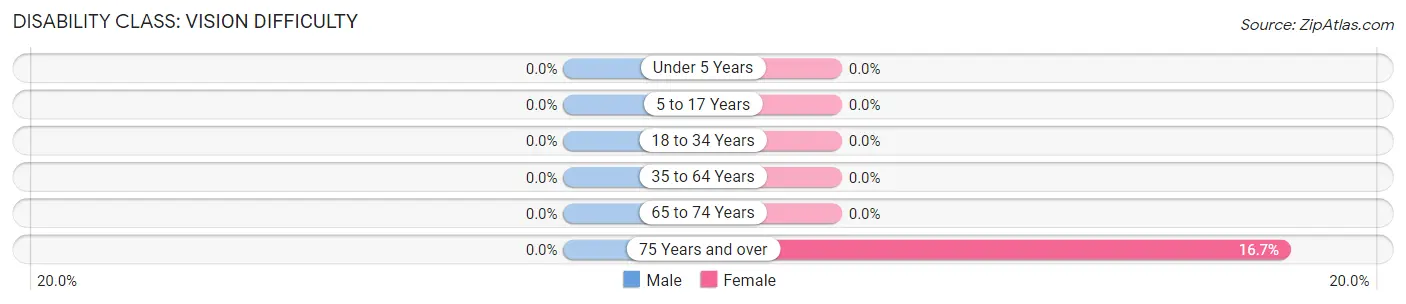
| Age Bracket | Male | Female |
| Under 5 Years | 0 (0.0%) | 0 (0.0%) |
| 5 to 17 Years | 0 (0.0%) | 0 (0.0%) |
| 18 to 34 Years | 0 (0.0%) | 0 (0.0%) |
| 35 to 64 Years | 0 (0.0%) | 0 (0.0%) |
| 65 to 74 Years | 0 (0.0%) | 0 (0.0%) |
| 75 Years and over | 0 (0.0%) | 4 (16.7%) |
Disability Class: Cognitive Difficulty
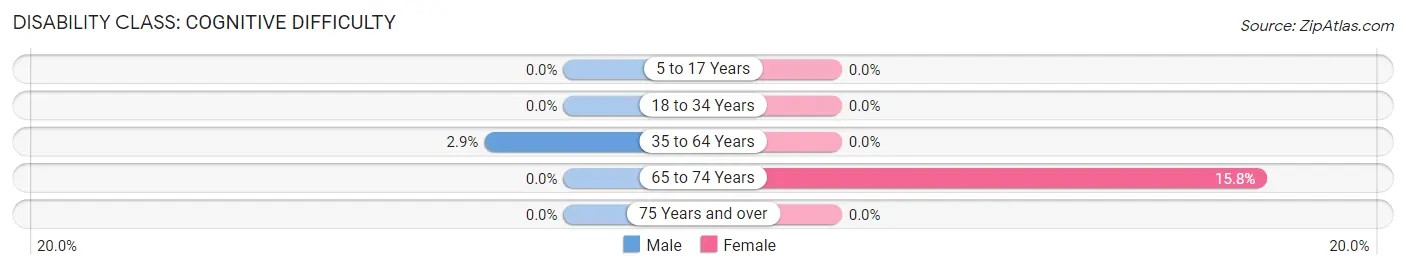
| Age Bracket | Male | Female |
| 5 to 17 Years | 0 (0.0%) | 0 (0.0%) |
| 18 to 34 Years | 0 (0.0%) | 0 (0.0%) |
| 35 to 64 Years | 2 (2.9%) | 0 (0.0%) |
| 65 to 74 Years | 0 (0.0%) | 3 (15.8%) |
| 75 Years and over | 0 (0.0%) | 0 (0.0%) |
Disability Class: Ambulatory Difficulty
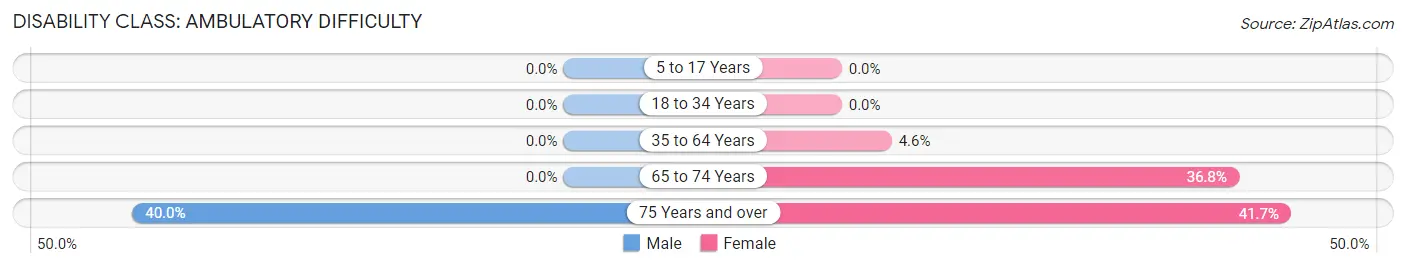
| Age Bracket | Male | Female |
| 5 to 17 Years | 0 (0.0%) | 0 (0.0%) |
| 18 to 34 Years | 0 (0.0%) | 0 (0.0%) |
| 35 to 64 Years | 0 (0.0%) | 5 (4.6%) |
| 65 to 74 Years | 0 (0.0%) | 7 (36.8%) |
| 75 Years and over | 2 (40.0%) | 10 (41.7%) |
Disability Class: Self-Care Difficulty
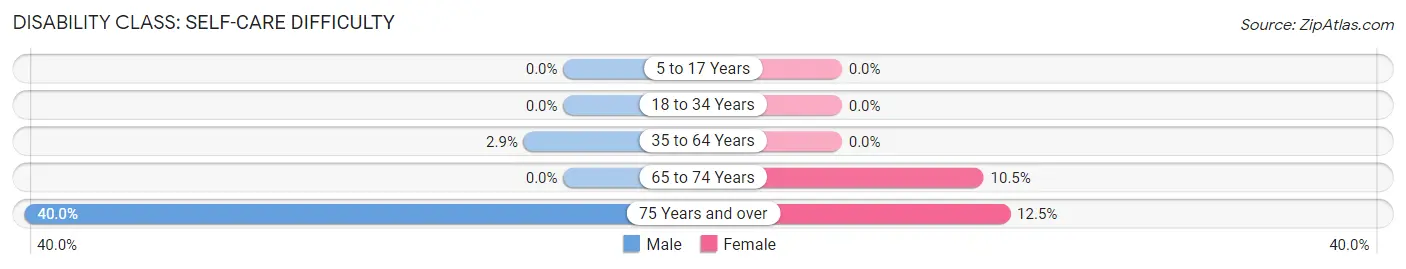
| Age Bracket | Male | Female |
| 5 to 17 Years | 0 (0.0%) | 0 (0.0%) |
| 18 to 34 Years | 0 (0.0%) | 0 (0.0%) |
| 35 to 64 Years | 2 (2.9%) | 0 (0.0%) |
| 65 to 74 Years | 0 (0.0%) | 2 (10.5%) |
| 75 Years and over | 2 (40.0%) | 3 (12.5%) |
Technology Access in Westhope
Computing Device Access in Westhope
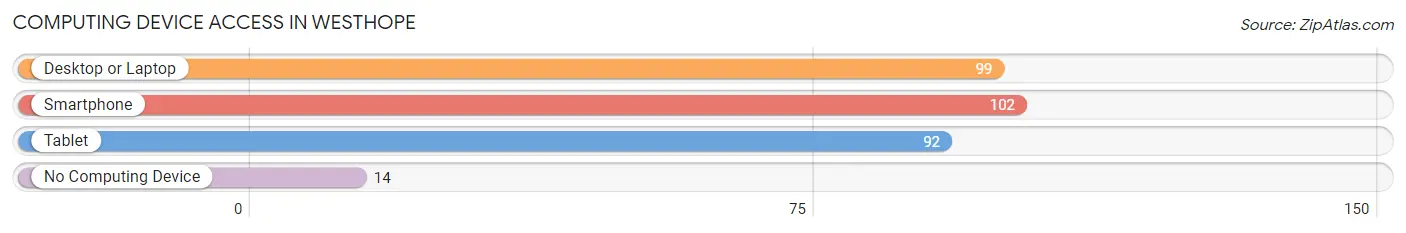
| Device Type | # Households | % Households |
| Desktop or Laptop | 99 | 77.3% |
| Smartphone | 102 | 79.7% |
| Tablet | 92 | 71.9% |
| No Computing Device | 14 | 10.9% |
| Total | 128 | 100.0% |
Internet Access in Westhope
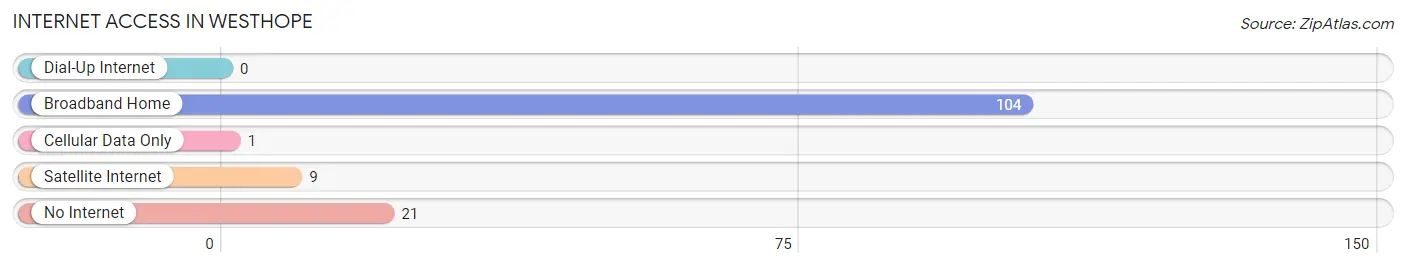
| Internet Type | # Households | % Households |
| Dial-Up Internet | 0 | 0.0% |
| Broadband Home | 104 | 81.2% |
| Cellular Data Only | 1 | 0.8% |
| Satellite Internet | 9 | 7.0% |
| No Internet | 21 | 16.4% |
| Total | 128 | 100.0% |
Westhope Summary
Westhope, North Dakota is a small city located in the northwestern corner of the state. It is the county seat of Bottineau County and is situated on the banks of the Souris River. The city has a population of 1,092 as of the 2010 census.
Westhope was founded in 1883 by a group of Norwegian settlers who were looking for a place to settle and farm. The city was named after the nearby Westhope Creek, which was named by the settlers after the town of Westhope in Norway. The city was incorporated in 1887 and has since grown to become the largest city in Bottineau County.
Geography
Westhope is located at 48°25'N 100°17'W (48.4167, -100.2833). It is situated on the banks of the Souris River, which is a tributary of the Red River of the North. The city is located in the northern part of the state, approximately 30 miles south of the Canadian border. The city is surrounded by rolling hills and prairies, and is located in the heart of the Red River Valley.
The climate in Westhope is classified as a humid continental climate, with cold winters and hot summers. The average annual temperature is 45°F (7°C), with an average high of 68°F (20°C) in the summer and an average low of 22°F (-6°C) in the winter. The average annual precipitation is 17.5 inches (44.5 cm).
Economy
Westhope's economy is largely based on agriculture and tourism. The city is home to several large farms, which produce a variety of crops, including wheat, barley, oats, and hay. The city is also home to several small businesses, including restaurants, retail stores, and service providers.
Tourism is an important part of the local economy, as the city is home to several attractions, including the Westhope Historical Museum, the Westhope Golf Course, and the Westhope Wildlife Refuge. The city is also home to several festivals and events throughout the year, including the Westhope Summer Festival and the Westhope Winter Festival.
Demographics
As of the 2010 census, Westhope had a population of 1,092. The racial makeup of the city was 97.2% White, 0.7% Native American, 0.2% Asian, 0.1% from other races, and 1.8% from two or more races. Hispanic or Latino of any race were 0.7% of the population.
The median income for a household in Westhope was $37,500, and the median income for a family was $45,000. The per capita income for the city was $18,845. About 11.2% of families and 14.2% of the population were below the poverty line, including 18.2% of those under age 18 and 8.3% of those age 65 or over.
Westhope is a small city with a rich history and a vibrant economy. The city is home to several attractions and events, and is a popular destination for tourists. The city is also home to a diverse population, with a variety of backgrounds and cultures. Westhope is a great place to live, work, and play.
Common Questions
What is Per Capita Income in Westhope?
Per Capita income in Westhope is $44,185.
What is the Median Family Income in Westhope?
Median Family Income in Westhope is $89,375.
What is the Median Household income in Westhope?
Median Household Income in Westhope is $66,667.
What is Income or Wage Gap in Westhope?
Income or Wage Gap in Westhope is 18.4%.
Women in Westhope earn 81.6 cents for every dollar earned by a man.
What is Inequality or Gini Index in Westhope?
Inequality or Gini Index in Westhope is 0.43.
What is the Total Population of Westhope?
Total Population of Westhope is 360.
What is the Total Male Population of Westhope?
Total Male Population of Westhope is 165.
What is the Total Female Population of Westhope?
Total Female Population of Westhope is 195.
What is the Ratio of Males per 100 Females in Westhope?
There are 84.62 Males per 100 Females in Westhope.
What is the Ratio of Females per 100 Males in Westhope?
There are 118.18 Females per 100 Males in Westhope.
What is the Median Population Age in Westhope?
Median Population Age in Westhope is 54.9 Years.
What is the Average Family Size in Westhope
Average Family Size in Westhope is 3.5 People.
What is the Average Household Size in Westhope
Average Household Size in Westhope is 2.6 People.
How Large is the Labor Force in Westhope?
There are 187 People in the Labor Forcein in Westhope.
What is the Percentage of People in the Labor Force in Westhope?
59.0% of People are in the Labor Force in Westhope.