Sheldon, ND Map & Demographics
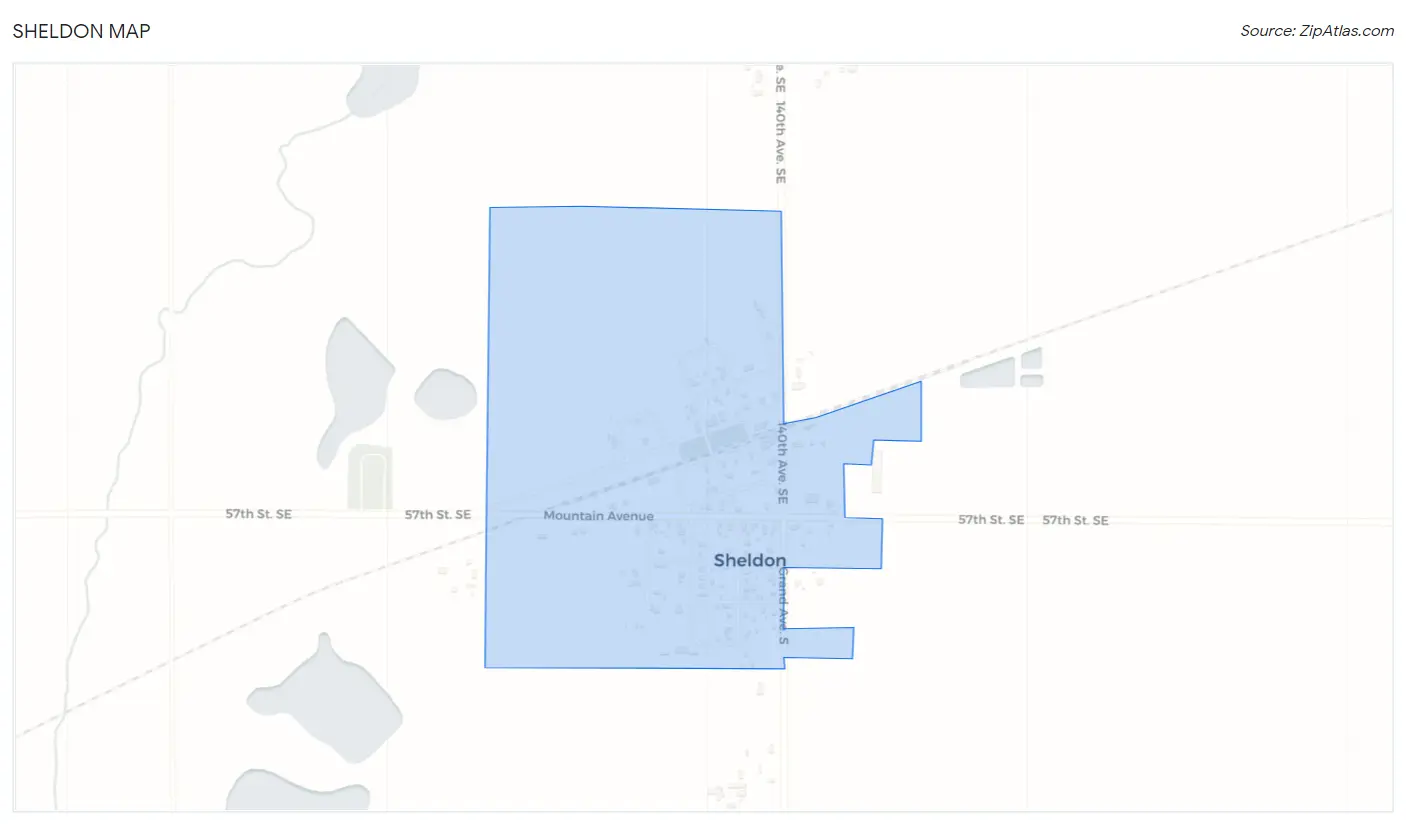
Sheldon Map
Sheldon Overview
$25,849
PER CAPITA INCOME
$55,833
AVG FAMILY INCOME
$50,000
AVG HOUSEHOLD INCOME
0.35
INEQUALITY / GINI INDEX
155
TOTAL POPULATION
93
MALE POPULATION
62
FEMALE POPULATION
150.00
MALES / 100 FEMALES
66.67
FEMALES / 100 MALES
38.9
MEDIAN AGE
3.2
AVG FAMILY SIZE
2.5
AVG HOUSEHOLD SIZE
109
LABOR FORCE [ PEOPLE ]
82.0%
PERCENT IN LABOR FORCE
2.8%
UNEMPLOYMENT RATE
Sheldon Zip Codes
Sheldon Area Codes
Income in Sheldon
Income Overview in Sheldon
Per Capita Income in Sheldon is $25,849, while median incomes of families and households are $55,833 and $50,000 respectively.
| Characteristic | Number | Measure |
| Per Capita Income | 155 | $25,849 |
| Median Family Income | 42 | $55,833 |
| Mean Family Income | 42 | $74,107 |
| Median Household Income | 62 | $50,000 |
| Mean Household Income | 62 | $60,755 |
| Income Deficit | 42 | $0 |
| Wage / Income Gap (%) | 155 | 0.00% |
| Wage / Income Gap ($) | 155 | 100.00¢ per $1 |
| Gini / Inequality Index | 155 | 0.35 |
Earnings by Sex in Sheldon
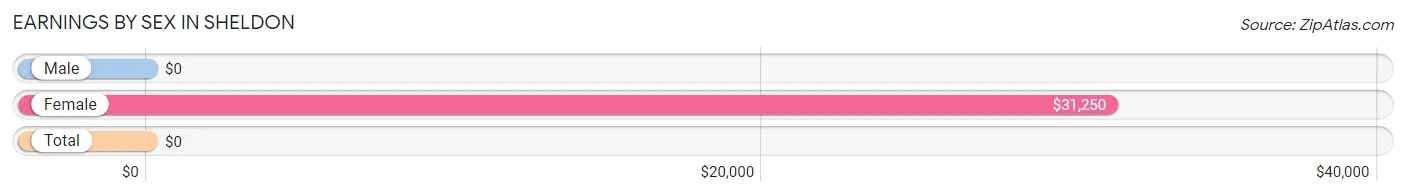
| Sex | Number | Average Earnings |
| Male | 66 (58.9%) | $0 |
| Female | 46 (41.1%) | $31,250 |
| Total | 112 (100.0%) | $0 |
Earnings by Sex by Income Bracket in Sheldon
The most common earnings brackets in Sheldon are $15,000 to $17,499 for men (17 | 25.8%) and $35,000 to $39,999 for women (13 | 28.3%).
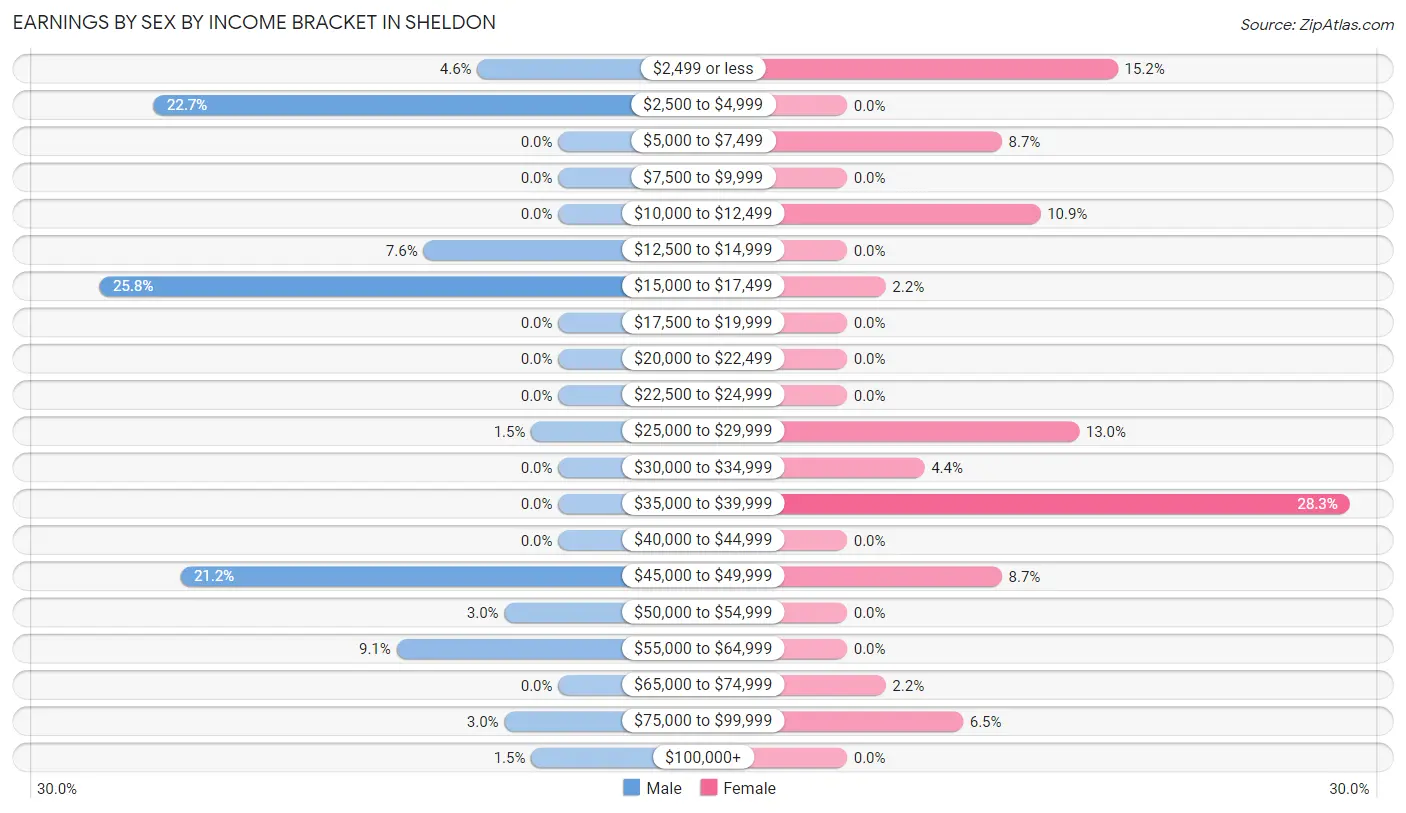
| Income | Male | Female |
| $2,499 or less | 3 (4.5%) | 7 (15.2%) |
| $2,500 to $4,999 | 15 (22.7%) | 0 (0.0%) |
| $5,000 to $7,499 | 0 (0.0%) | 4 (8.7%) |
| $7,500 to $9,999 | 0 (0.0%) | 0 (0.0%) |
| $10,000 to $12,499 | 0 (0.0%) | 5 (10.9%) |
| $12,500 to $14,999 | 5 (7.6%) | 0 (0.0%) |
| $15,000 to $17,499 | 17 (25.8%) | 1 (2.2%) |
| $17,500 to $19,999 | 0 (0.0%) | 0 (0.0%) |
| $20,000 to $22,499 | 0 (0.0%) | 0 (0.0%) |
| $22,500 to $24,999 | 0 (0.0%) | 0 (0.0%) |
| $25,000 to $29,999 | 1 (1.5%) | 6 (13.0%) |
| $30,000 to $34,999 | 0 (0.0%) | 2 (4.3%) |
| $35,000 to $39,999 | 0 (0.0%) | 13 (28.3%) |
| $40,000 to $44,999 | 0 (0.0%) | 0 (0.0%) |
| $45,000 to $49,999 | 14 (21.2%) | 4 (8.7%) |
| $50,000 to $54,999 | 2 (3.0%) | 0 (0.0%) |
| $55,000 to $64,999 | 6 (9.1%) | 0 (0.0%) |
| $65,000 to $74,999 | 0 (0.0%) | 1 (2.2%) |
| $75,000 to $99,999 | 2 (3.0%) | 3 (6.5%) |
| $100,000+ | 1 (1.5%) | 0 (0.0%) |
| Total | 66 (100.0%) | 46 (100.0%) |
Earnings by Sex by Educational Attainment in Sheldon
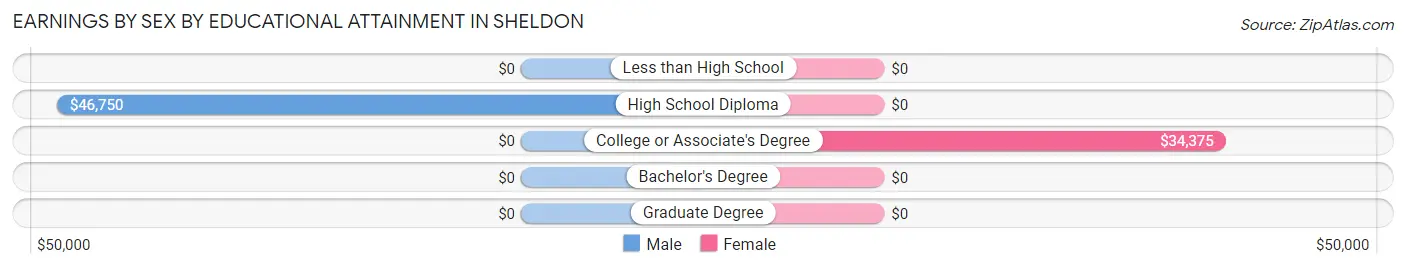
| Educational Attainment | Male Income | Female Income |
| Less than High School | - | - |
| High School Diploma | $46,750 | $0 |
| College or Associate's Degree | - | - |
| Bachelor's Degree | - | - |
| Graduate Degree | - | - |
| Total | - | - |
Family Income in Sheldon
Family Income Brackets in Sheldon
According to the Sheldon family income data, there are 10 families falling into the $50,000 to $74,999 income range, which is the most common income bracket and makes up 23.8% of all families.
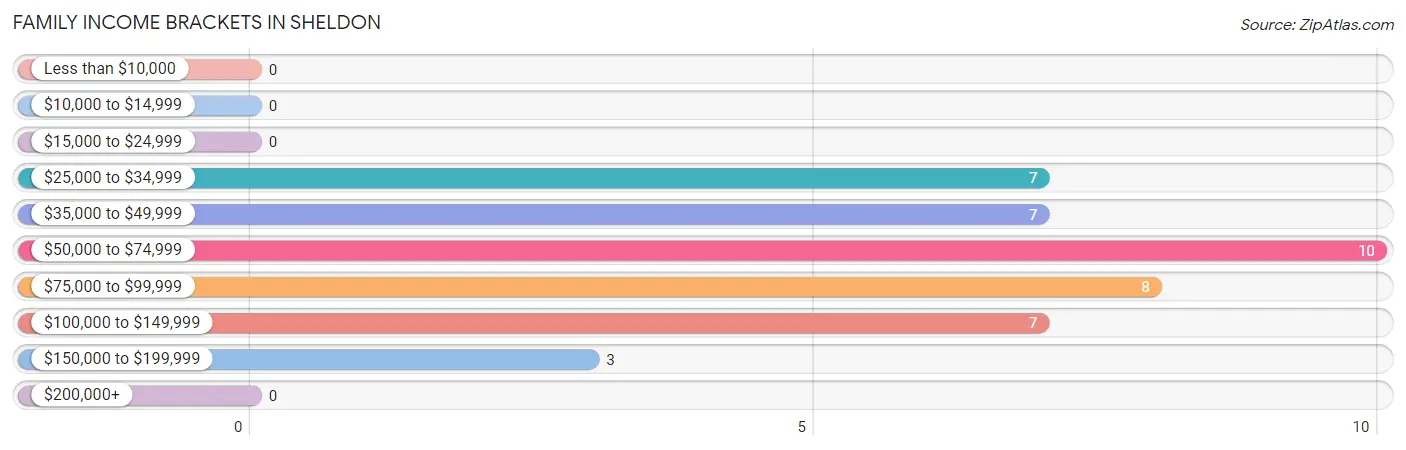
| Income Bracket | # Families | % Families |
| Less than $10,000 | 0 | 0.0% |
| $10,000 to $14,999 | 0 | 0.0% |
| $15,000 to $24,999 | 0 | 0.0% |
| $25,000 to $34,999 | 7 | 16.7% |
| $35,000 to $49,999 | 7 | 16.7% |
| $50,000 to $74,999 | 10 | 23.8% |
| $75,000 to $99,999 | 8 | 19.0% |
| $100,000 to $149,999 | 7 | 16.7% |
| $150,000 to $199,999 | 3 | 7.1% |
| $200,000+ | 0 | 0.0% |
Family Income by Famaliy Size in Sheldon
2-person families (15 | 35.7%) account for the highest median family income in Sheldon with $54,063 per family, while 2-person families (15 | 35.7%) have the highest median income of $27,032 per family member.
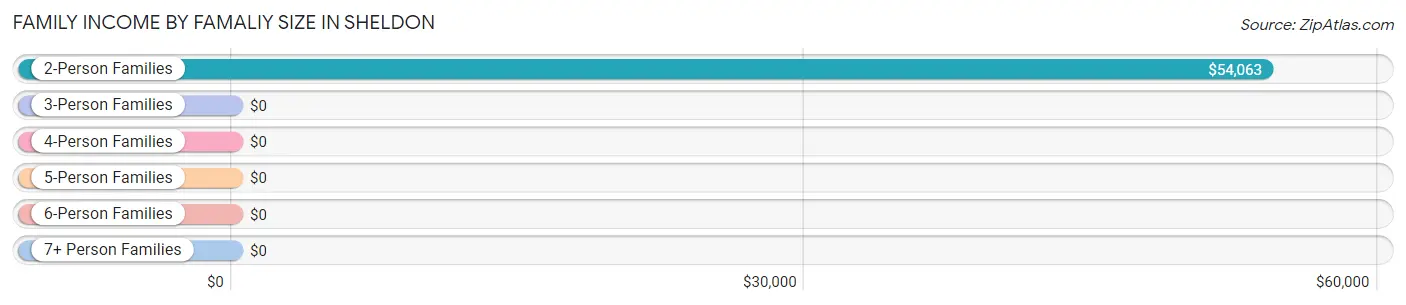
| Income Bracket | # Families | Median Income |
| 2-Person Families | 15 (35.7%) | $54,063 |
| 3-Person Families | 14 (33.3%) | $0 |
| 4-Person Families | 13 (30.9%) | $0 |
| 5-Person Families | 0 (0.0%) | $0 |
| 6-Person Families | 0 (0.0%) | $0 |
| 7+ Person Families | 0 (0.0%) | $0 |
| Total | 42 (100.0%) | $55,833 |
Family Income by Number of Earners in Sheldon
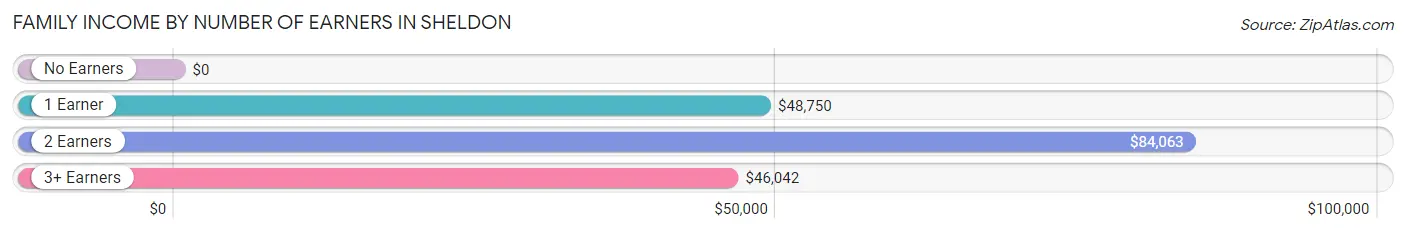
| Number of Earners | # Families | Median Income |
| No Earners | 3 (7.1%) | $0 |
| 1 Earner | 6 (14.3%) | $48,750 |
| 2 Earners | 18 (42.9%) | $84,063 |
| 3+ Earners | 15 (35.7%) | $46,042 |
| Total | 42 (100.0%) | $55,833 |
Household Income in Sheldon
Household Income Brackets in Sheldon
With 13 households falling in the category, the $50,000 to $74,999 income range is the most frequent in Sheldon, accounting for 21.0% of all households.
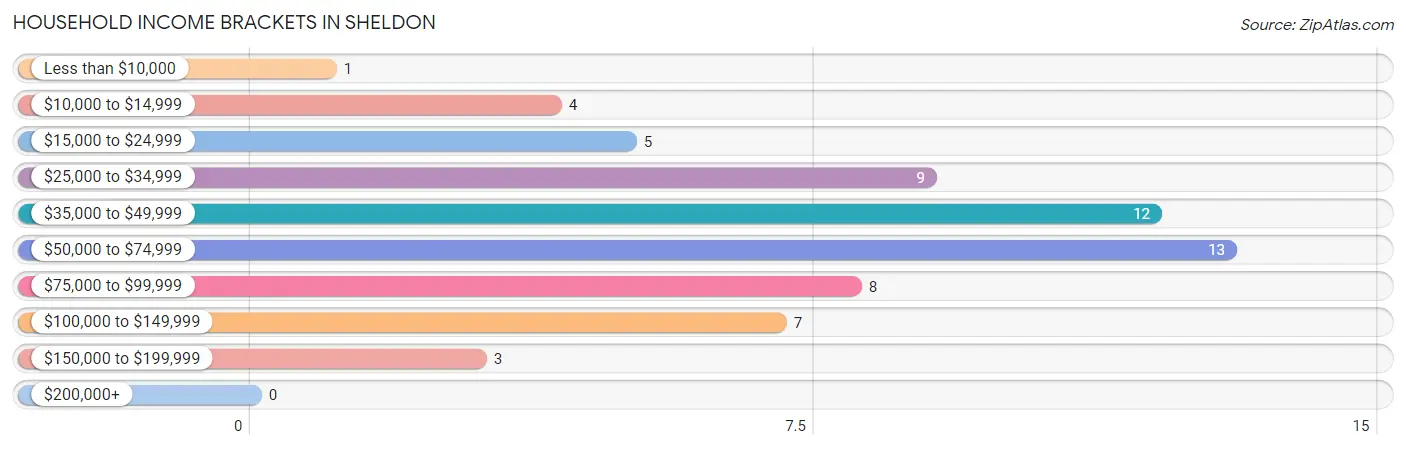
| Income Bracket | # Households | % Households |
| Less than $10,000 | 1 | 1.6% |
| $10,000 to $14,999 | 4 | 6.5% |
| $15,000 to $24,999 | 5 | 8.1% |
| $25,000 to $34,999 | 9 | 14.5% |
| $35,000 to $49,999 | 12 | 19.4% |
| $50,000 to $74,999 | 13 | 21.0% |
| $75,000 to $99,999 | 8 | 12.9% |
| $100,000 to $149,999 | 7 | 11.3% |
| $150,000 to $199,999 | 3 | 4.8% |
| $200,000+ | 0 | 0.0% |
Household Income by Householder Age in Sheldon
The median household income in Sheldon is $50,000, with the highest median household income of $83,438 found in the 25 to 44 years age bracket for the primary householder. A total of 16 households (25.8%) fall into this category.
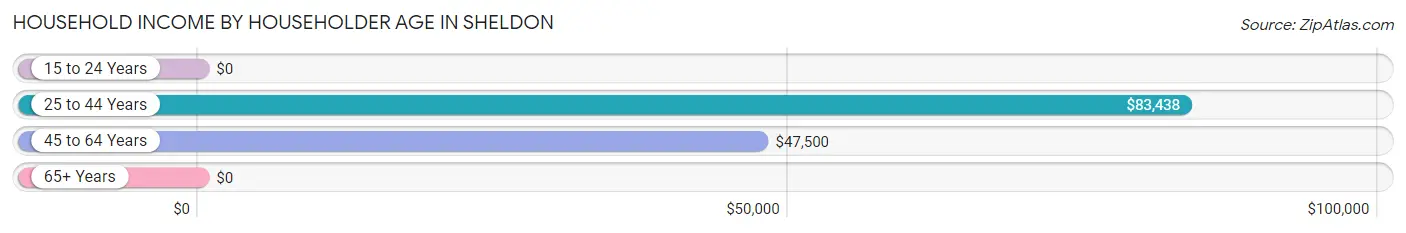
| Income Bracket | # Households | Median Income |
| 15 to 24 Years | 0 (0.0%) | $0 |
| 25 to 44 Years | 16 (25.8%) | $83,438 |
| 45 to 64 Years | 26 (41.9%) | $47,500 |
| 65+ Years | 20 (32.3%) | $0 |
| Total | 62 (100.0%) | $50,000 |
Poverty in Sheldon
Income Below Poverty by Sex and Age in Sheldon
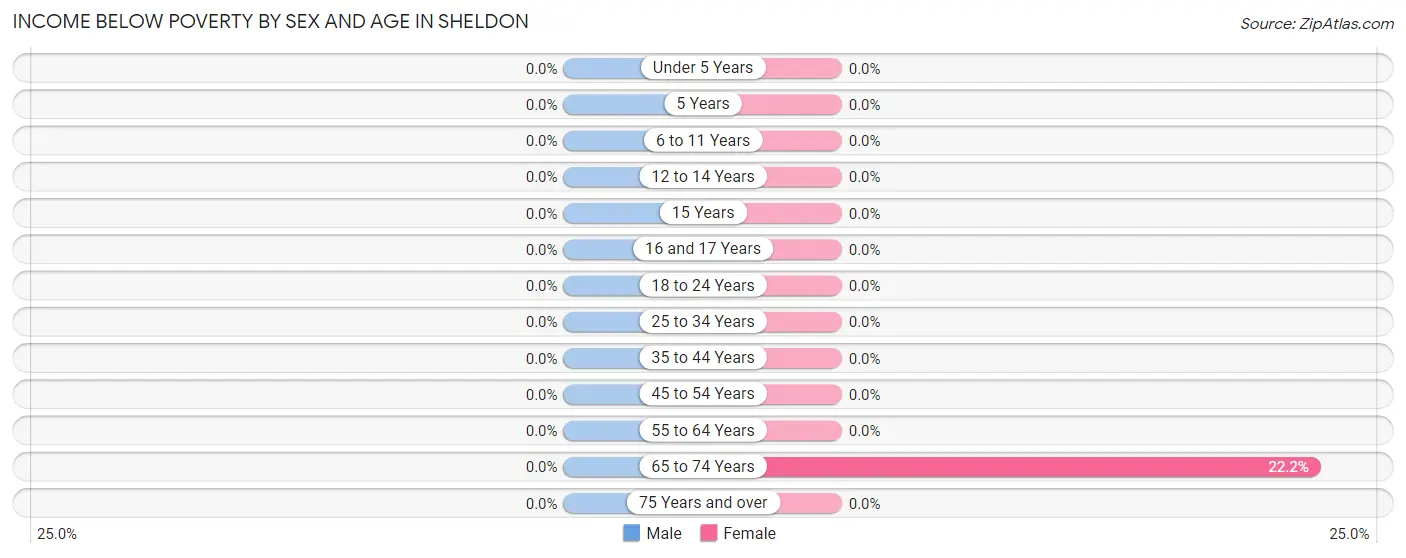
| Age Bracket | Male | Female |
| Under 5 Years | 0 (0.0%) | 0 (0.0%) |
| 5 Years | 0 (0.0%) | 0 (0.0%) |
| 6 to 11 Years | 0 (0.0%) | 0 (0.0%) |
| 12 to 14 Years | 0 (0.0%) | 0 (0.0%) |
| 15 Years | 0 (0.0%) | 0 (0.0%) |
| 16 and 17 Years | 0 (0.0%) | 0 (0.0%) |
| 18 to 24 Years | 0 (0.0%) | 0 (0.0%) |
| 25 to 34 Years | 0 (0.0%) | 0 (0.0%) |
| 35 to 44 Years | 0 (0.0%) | 0 (0.0%) |
| 45 to 54 Years | 0 (0.0%) | 0 (0.0%) |
| 55 to 64 Years | 0 (0.0%) | 0 (0.0%) |
| 65 to 74 Years | 0 (0.0%) | 2 (22.2%) |
| 75 Years and over | 0 (0.0%) | 0 (0.0%) |
| Total | 0 (0.0%) | 2 (3.2%) |
Income Above Poverty by Sex and Age in Sheldon
According to the poverty statistics in Sheldon, males aged under 5 years and females aged 6 to 11 years are the age groups that are most secure financially, with 100.0% of males and 100.0% of females in these age groups living above the poverty line.
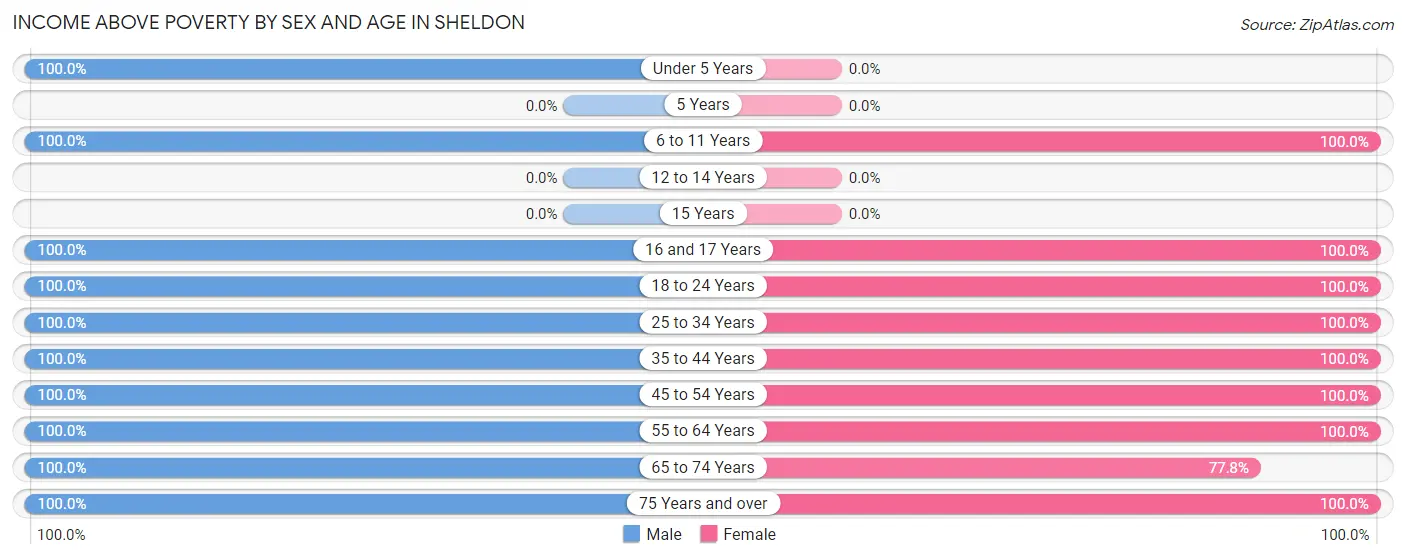
| Age Bracket | Male | Female |
| Under 5 Years | 16 (100.0%) | 0 (0.0%) |
| 5 Years | 0 (0.0%) | 0 (0.0%) |
| 6 to 11 Years | 2 (100.0%) | 4 (100.0%) |
| 12 to 14 Years | 0 (0.0%) | 0 (0.0%) |
| 15 Years | 0 (0.0%) | 0 (0.0%) |
| 16 and 17 Years | 13 (100.0%) | 4 (100.0%) |
| 18 to 24 Years | 3 (100.0%) | 3 (100.0%) |
| 25 to 34 Years | 10 (100.0%) | 8 (100.0%) |
| 35 to 44 Years | 17 (100.0%) | 12 (100.0%) |
| 45 to 54 Years | 17 (100.0%) | 15 (100.0%) |
| 55 to 64 Years | 4 (100.0%) | 4 (100.0%) |
| 65 to 74 Years | 8 (100.0%) | 7 (77.8%) |
| 75 Years and over | 3 (100.0%) | 3 (100.0%) |
| Total | 93 (100.0%) | 60 (96.8%) |
Income Below Poverty Among Married-Couple Families in Sheldon

| Children | Above Poverty | Below Poverty |
| No Children | 17 (100.0%) | 0 (0.0%) |
| 1 or 2 Children | 21 (100.0%) | 0 (0.0%) |
| 3 or 4 Children | 0 (0.0%) | 0 (0.0%) |
| 5 or more Children | 0 (0.0%) | 0 (0.0%) |
| Total | 38 (100.0%) | 0 (0.0%) |
Income Below Poverty Among Single-Parent Households in Sheldon
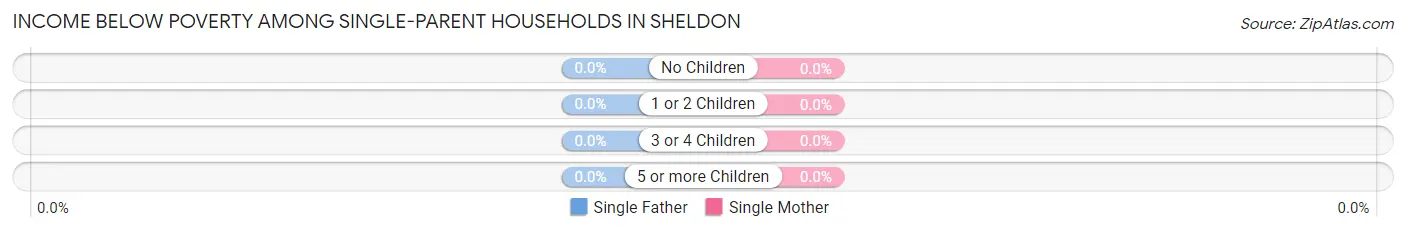
| Children | Single Father | Single Mother |
| No Children | 0 (0.0%) | 0 (0.0%) |
| 1 or 2 Children | 0 (0.0%) | 0 (0.0%) |
| 3 or 4 Children | 0 (0.0%) | 0 (0.0%) |
| 5 or more Children | 0 (0.0%) | 0 (0.0%) |
| Total | 0 (0.0%) | 0 (0.0%) |
Income Below Poverty Among Married-Couple vs Single-Parent Households in Sheldon
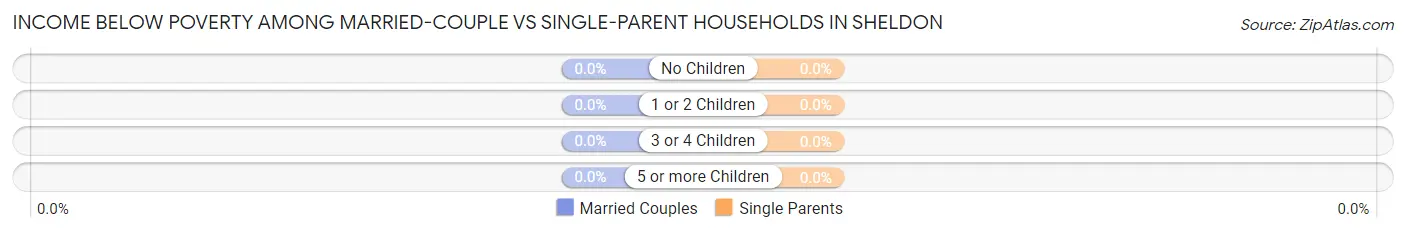
| Children | Married-Couple Families | Single-Parent Households |
| No Children | 0 (0.0%) | 0 (0.0%) |
| 1 or 2 Children | 0 (0.0%) | 0 (0.0%) |
| 3 or 4 Children | 0 (0.0%) | 0 (0.0%) |
| 5 or more Children | 0 (0.0%) | 0 (0.0%) |
| Total | 0 (0.0%) | 0 (0.0%) |
Race in Sheldon
The most populous races in Sheldon are White / Caucasian (127 | 81.9%), Hispanic or Latino (27 | 17.4%), and Some other Race (27 | 17.4%).
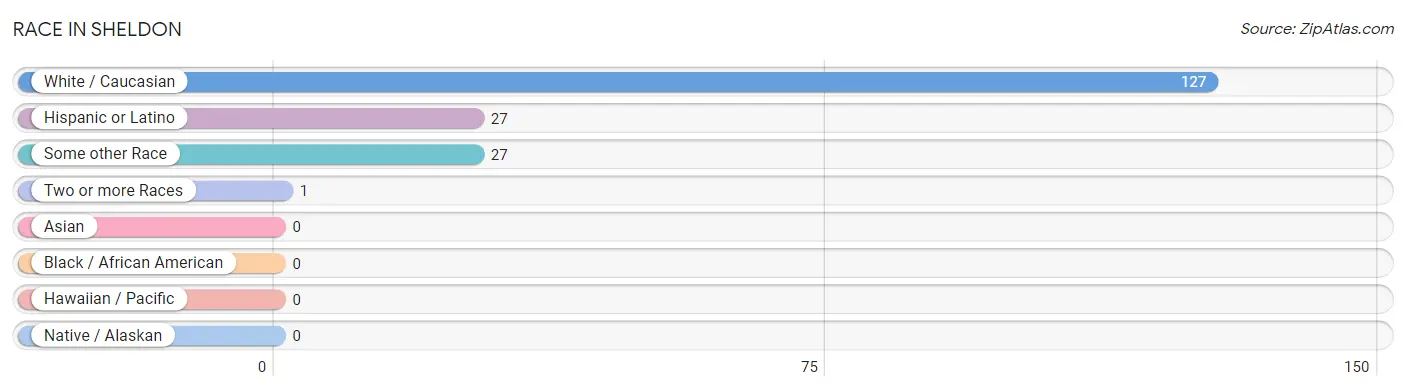
| Race | # Population | % Population |
| Asian | 0 | 0.0% |
| Black / African American | 0 | 0.0% |
| Hawaiian / Pacific | 0 | 0.0% |
| Hispanic or Latino | 27 | 17.4% |
| Native / Alaskan | 0 | 0.0% |
| White / Caucasian | 127 | 81.9% |
| Two or more Races | 1 | 0.6% |
| Some other Race | 27 | 17.4% |
| Total | 155 | 100.0% |
Ancestry in Sheldon
The most populous ancestries reported in Sheldon are German (56 | 36.1%), Irish (30 | 19.4%), Mexican (27 | 17.4%), Norwegian (27 | 17.4%), and French (9 | 5.8%), together accounting for 96.1% of all Sheldon residents.
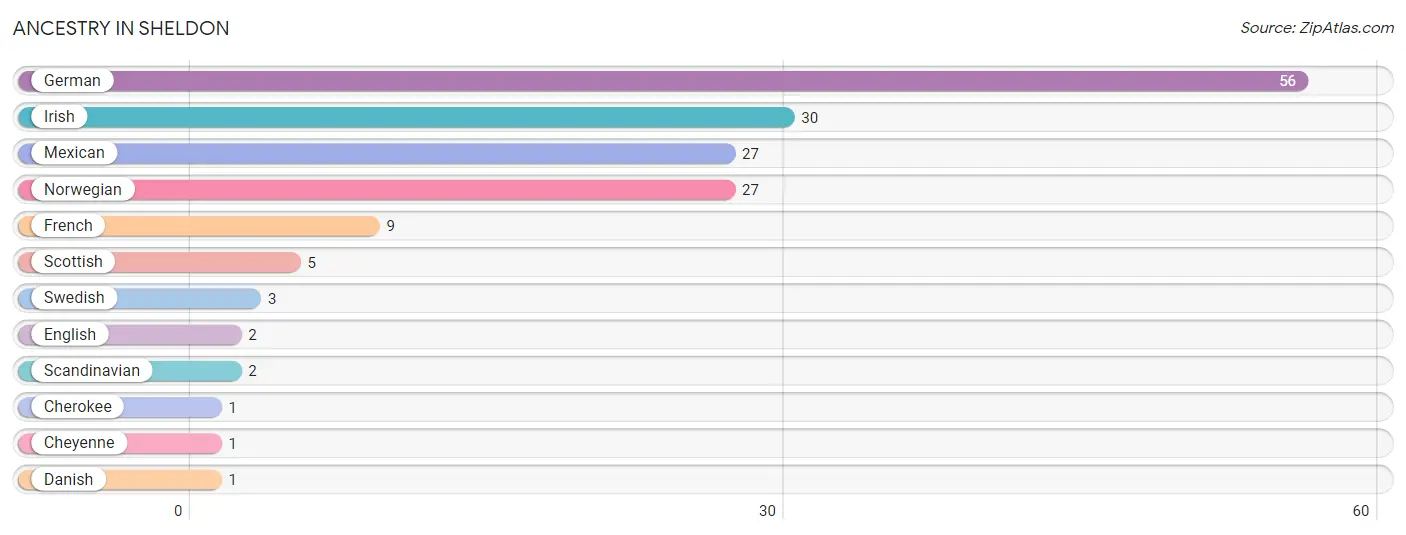
| Ancestry | # Population | % Population |
| Cherokee | 1 | 0.6% |
| Cheyenne | 1 | 0.6% |
| Danish | 1 | 0.6% |
| English | 2 | 1.3% |
| French | 9 | 5.8% |
| German | 56 | 36.1% |
| Irish | 30 | 19.4% |
| Mexican | 27 | 17.4% |
| Norwegian | 27 | 17.4% |
| Scandinavian | 2 | 1.3% |
| Scottish | 5 | 3.2% |
| Swedish | 3 | 1.9% | View All 12 Rows |
Immigrants in Sheldon
The most numerous immigrant groups reported in Sheldon came from Central America (17 | 11.0%), Latin America (17 | 11.0%), and Mexico (17 | 11.0%), together accounting for 32.9% of all Sheldon residents.
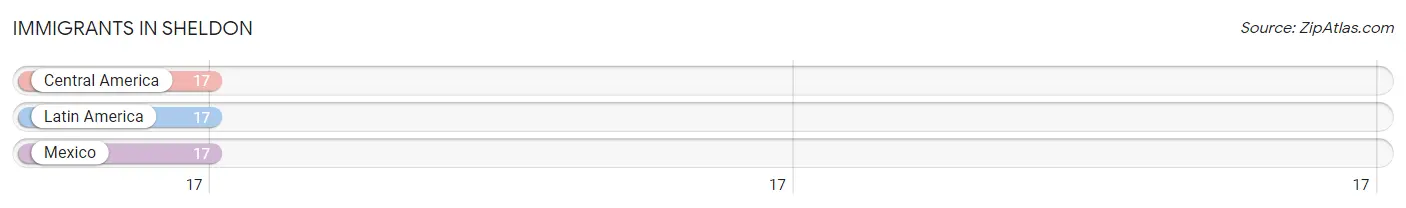
| Immigration Origin | # Population | % Population |
| Central America | 17 | 11.0% |
| Latin America | 17 | 11.0% |
| Mexico | 17 | 11.0% | View All 3 Rows |
Sex and Age in Sheldon
Sex and Age in Sheldon
The most populous age groups in Sheldon are 35 to 39 Years (17 | 18.3%) for men and 45 to 49 Years (11 | 17.7%) for women.
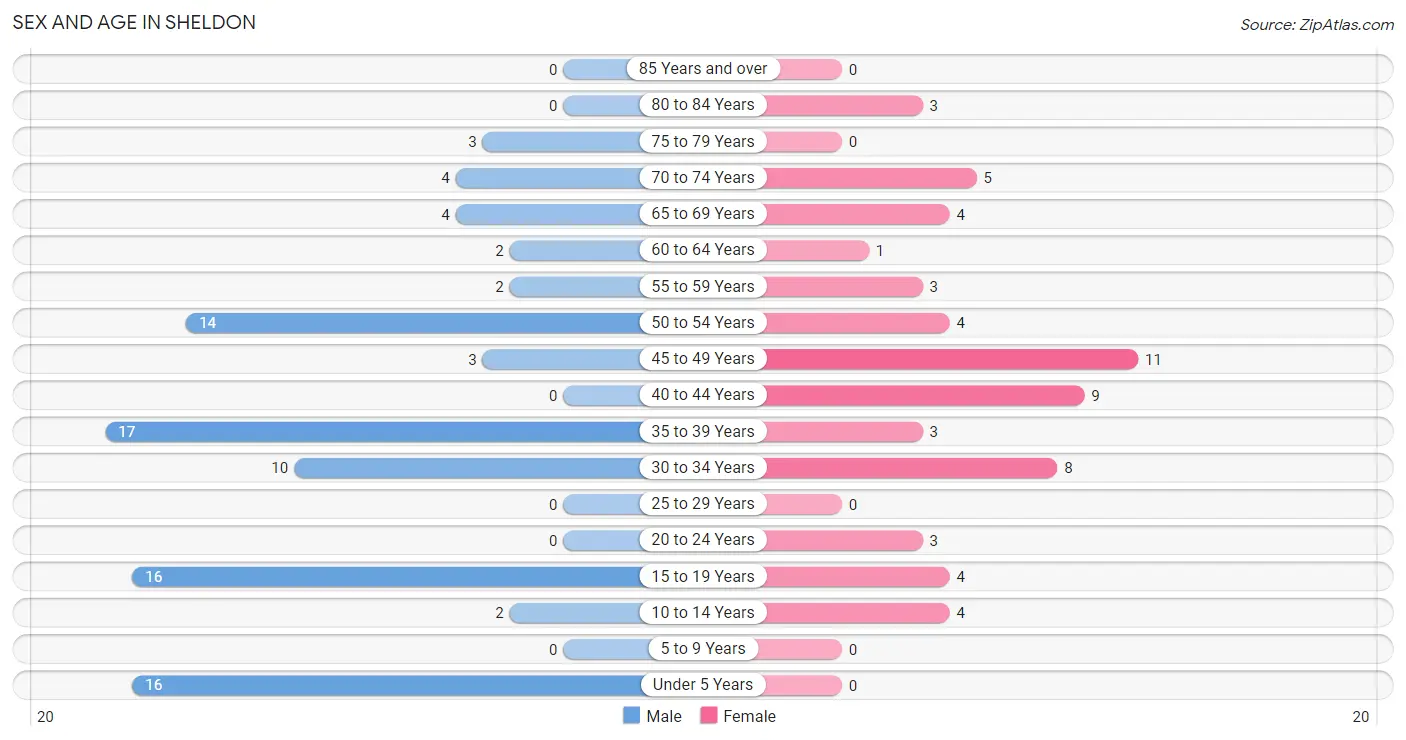
| Age Bracket | Male | Female |
| Under 5 Years | 16 (17.2%) | 0 (0.0%) |
| 5 to 9 Years | 0 (0.0%) | 0 (0.0%) |
| 10 to 14 Years | 2 (2.1%) | 4 (6.5%) |
| 15 to 19 Years | 16 (17.2%) | 4 (6.5%) |
| 20 to 24 Years | 0 (0.0%) | 3 (4.8%) |
| 25 to 29 Years | 0 (0.0%) | 0 (0.0%) |
| 30 to 34 Years | 10 (10.7%) | 8 (12.9%) |
| 35 to 39 Years | 17 (18.3%) | 3 (4.8%) |
| 40 to 44 Years | 0 (0.0%) | 9 (14.5%) |
| 45 to 49 Years | 3 (3.2%) | 11 (17.7%) |
| 50 to 54 Years | 14 (15.0%) | 4 (6.5%) |
| 55 to 59 Years | 2 (2.1%) | 3 (4.8%) |
| 60 to 64 Years | 2 (2.1%) | 1 (1.6%) |
| 65 to 69 Years | 4 (4.3%) | 4 (6.5%) |
| 70 to 74 Years | 4 (4.3%) | 5 (8.1%) |
| 75 to 79 Years | 3 (3.2%) | 0 (0.0%) |
| 80 to 84 Years | 0 (0.0%) | 3 (4.8%) |
| 85 Years and over | 0 (0.0%) | 0 (0.0%) |
| Total | 93 (100.0%) | 62 (100.0%) |
Families and Households in Sheldon
Median Family Size in Sheldon
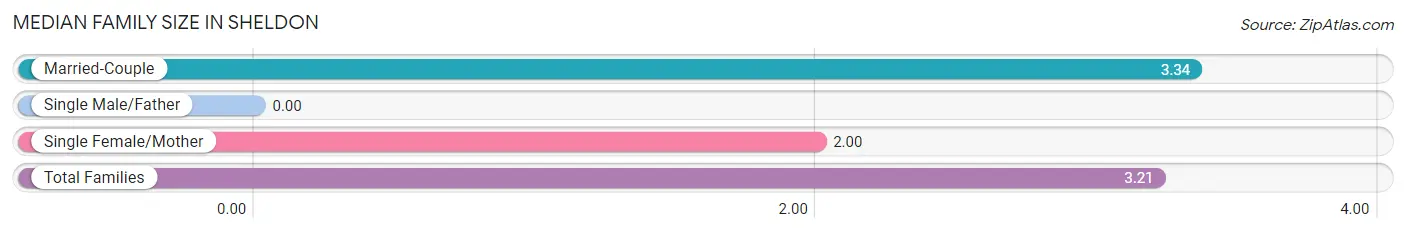
| Family Type | # Families | Family Size |
| Married-Couple | 38 (90.5%) | 3.34 |
| Single Male/Father | 0 (0.0%) | - |
| Single Female/Mother | 4 (9.5%) | 2.00 |
| Total Families | 42 (100.0%) | 3.21 |
Median Household Size in Sheldon
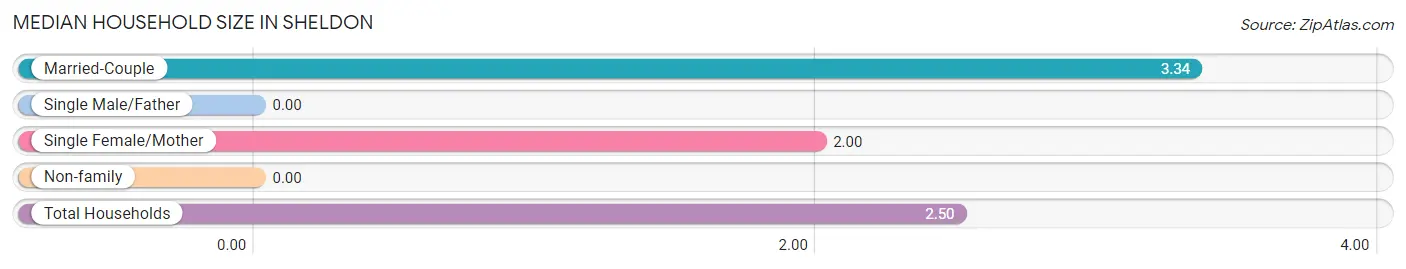
| Household Type | # Households | Household Size |
| Married-Couple | 38 (61.3%) | 3.34 |
| Single Male/Father | 0 (0.0%) | - |
| Single Female/Mother | 4 (6.5%) | 2.00 |
| Non-family | 20 (32.3%) | - |
| Total Households | 62 (100.0%) | 2.50 |
Household Size by Marriage Status in Sheldon
Out of a total of 62 households in Sheldon, 42 (67.7%) are family households, while 20 (32.3%) are nonfamily households. The most numerous type of family households are 2-person households, comprising 15, and the most common type of nonfamily households are 1-person households, comprising 20.
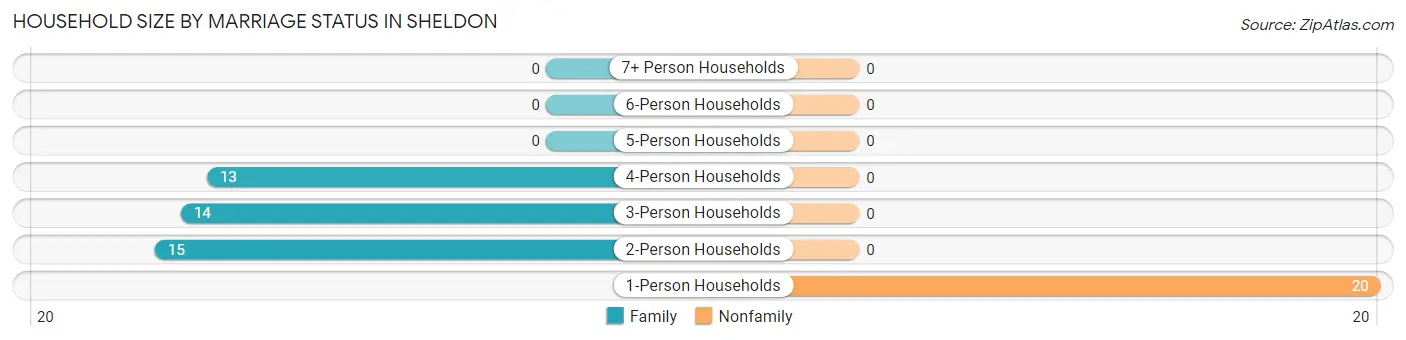
| Household Size | Family Households | Nonfamily Households |
| 1-Person Households | - | 20 (32.3%) |
| 2-Person Households | 15 (24.2%) | 0 (0.0%) |
| 3-Person Households | 14 (22.6%) | 0 (0.0%) |
| 4-Person Households | 13 (21.0%) | 0 (0.0%) |
| 5-Person Households | 0 (0.0%) | 0 (0.0%) |
| 6-Person Households | 0 (0.0%) | 0 (0.0%) |
| 7+ Person Households | 0 (0.0%) | 0 (0.0%) |
| Total | 42 (67.7%) | 20 (32.3%) |
Female Fertility in Sheldon
Fertility by Age in Sheldon
| Age Bracket | Women with Births | Births / 1,000 Women |
| 15 to 19 years | 0 (0.0%) | 0.0 |
| 20 to 34 years | 0 (0.0%) | 0.0 |
| 35 to 50 years | 0 (0.0%) | 0.0 |
| Total | 0 (0.0%) | 0.0 |
Fertility by Age by Marriage Status in Sheldon
| Age Bracket | Married | Unmarried |
| 15 to 19 years | 0 (0.0%) | 0 (0.0%) |
| 20 to 34 years | 0 (0.0%) | 0 (0.0%) |
| 35 to 50 years | 0 (0.0%) | 0 (0.0%) |
| Total | 0 (0.0%) | 0 (0.0%) |
Fertility by Education in Sheldon
| Educational Attainment | Women with Births | Births / 1,000 Women |
| Less than High School | 0 (0.0%) | 0.0 |
| High School Diploma | 0 (0.0%) | 0.0 |
| College or Associate's Degree | 0 (0.0%) | 0.0 |
| Bachelor's Degree | 0 (0.0%) | 0.0 |
| Graduate Degree | 0 (0.0%) | 0.0 |
| Total | 0 (0.0%) | 0.0 |
Fertility by Education by Marriage Status in Sheldon
| Educational Attainment | Married | Unmarried |
| Less than High School | 0 (0.0%) | 0 (0.0%) |
| High School Diploma | 0 (0.0%) | 0 (0.0%) |
| College or Associate's Degree | 0 (0.0%) | 0 (0.0%) |
| Bachelor's Degree | 0 (0.0%) | 0 (0.0%) |
| Graduate Degree | 0 (0.0%) | 0 (0.0%) |
| Total | 0 (0.0%) | 0 (0.0%) |
Employment Characteristics in Sheldon
Employment by Class of Employer in Sheldon
Among the 106 employed individuals in Sheldon, private company employees (85 | 80.2%), local government employees (11 | 10.4%), and state government employees (6 | 5.7%) make up the most common classes of employment.
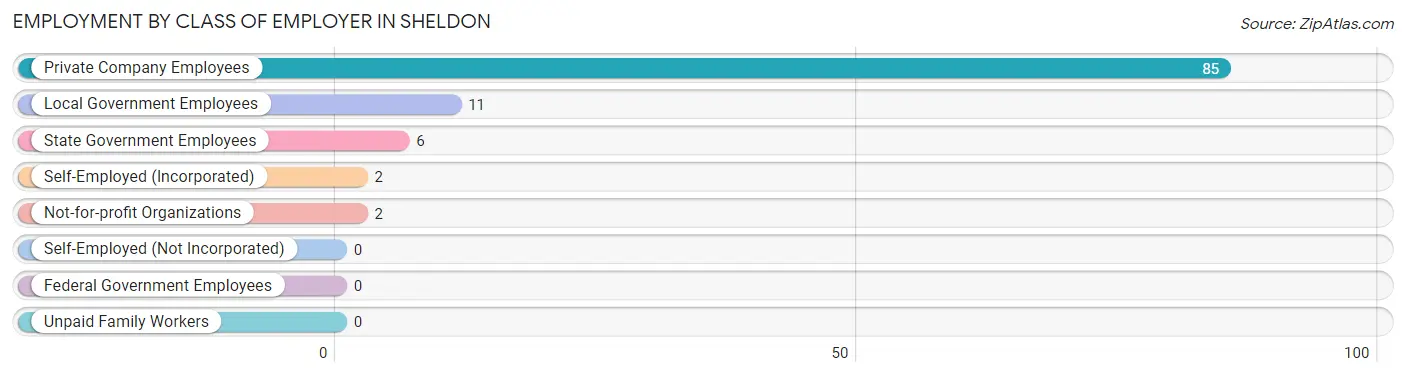
| Employer Class | # Employees | % Employees |
| Private Company Employees | 85 | 80.2% |
| Self-Employed (Incorporated) | 2 | 1.9% |
| Self-Employed (Not Incorporated) | 0 | 0.0% |
| Not-for-profit Organizations | 2 | 1.9% |
| Local Government Employees | 11 | 10.4% |
| State Government Employees | 6 | 5.7% |
| Federal Government Employees | 0 | 0.0% |
| Unpaid Family Workers | 0 | 0.0% |
| Total | 106 | 100.0% |
Employment Status by Age in Sheldon
According to the labor force statistics for Sheldon, out of the total population over 16 years of age (133), 82.0% or 109 individuals are in the labor force, with 2.8% or 3 of them unemployed. The age group with the highest labor force participation rate is 16 to 19 years, with 100.0% or 20 individuals in the labor force. Within the labor force, the 55 to 59 years age range has the highest percentage of unemployed individuals, with 50.0% or 1 of them being unemployed.
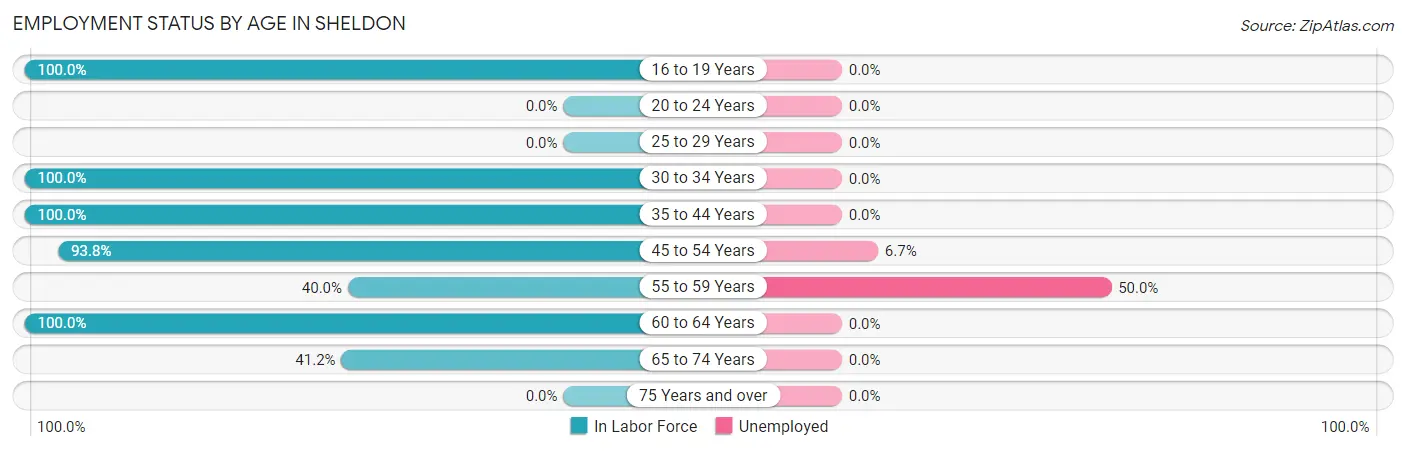
| Age Bracket | In Labor Force | Unemployed |
| 16 to 19 Years | 20 (100.0%) | 0 (0.0%) |
| 20 to 24 Years | 0 (0.0%) | 0 (0.0%) |
| 25 to 29 Years | 0 (0.0%) | 0 (0.0%) |
| 30 to 34 Years | 18 (100.0%) | 0 (0.0%) |
| 35 to 44 Years | 29 (100.0%) | 0 (0.0%) |
| 45 to 54 Years | 30 (93.8%) | 2 (6.7%) |
| 55 to 59 Years | 2 (40.0%) | 1 (50.0%) |
| 60 to 64 Years | 3 (100.0%) | 0 (0.0%) |
| 65 to 74 Years | 7 (41.2%) | 0 (0.0%) |
| 75 Years and over | 0 (0.0%) | 0 (0.0%) |
| Total | 109 (82.0%) | 3 (2.8%) |
Employment Status by Educational Attainment in Sheldon
According to labor force statistics for Sheldon, 94.3% of individuals (82) out of the total population between 25 and 64 years of age (87) are in the labor force, with 3.7% or 3 of them being unemployed. The group with the highest labor force participation rate are those with the educational attainment of less than high school, with 100.0% or 20 individuals in the labor force. Within the labor force, individuals with high school diploma education have the highest percentage of unemployment, with 10.0% or 2 of them being unemployed.
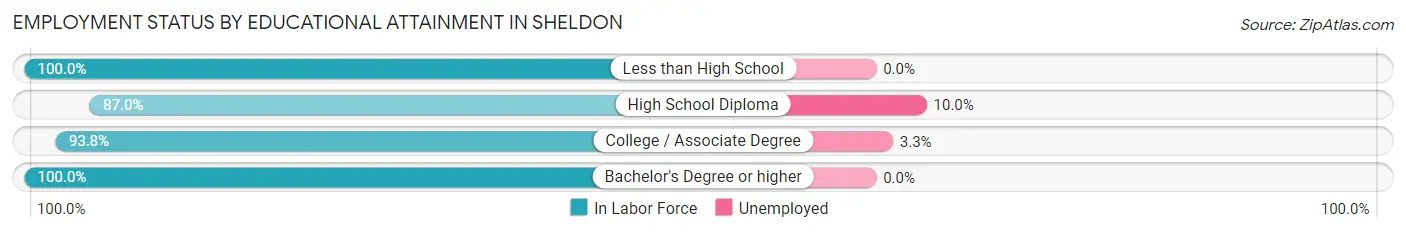
| Educational Attainment | In Labor Force | Unemployed |
| Less than High School | 20 (100.0%) | 0 (0.0%) |
| High School Diploma | 20 (87.0%) | 2 (10.0%) |
| College / Associate Degree | 30 (93.8%) | 1 (3.3%) |
| Bachelor's Degree or higher | 12 (100.0%) | 0 (0.0%) |
| Total | 82 (94.3%) | 3 (3.7%) |
Employment Occupations by Sex in Sheldon
Management, Business, Science and Arts Occupations
The most common Management, Business, Science and Arts occupations in Sheldon are Community & Social Service (10 | 9.4%), Education Instruction & Library (8 | 7.5%), Health Diagnosing & Treating (6 | 5.7%), Management (4 | 3.8%), and Education, Arts & Media (2 | 1.9%).
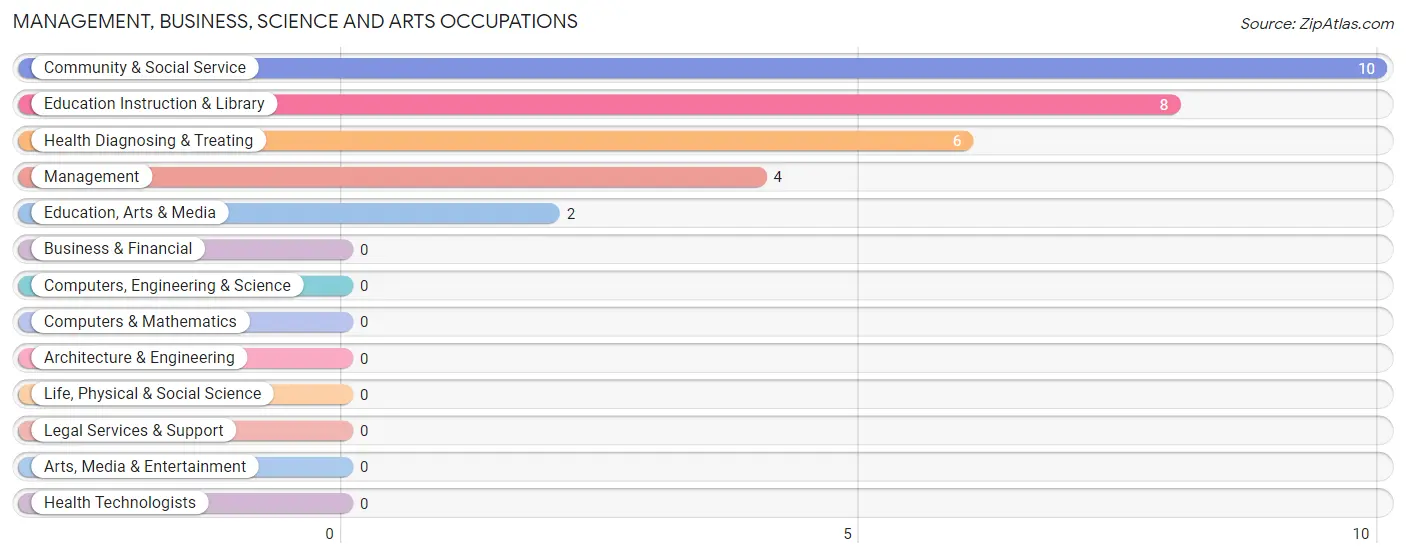
Management, Business, Science and Arts Occupations by Sex
Within the Management, Business, Science and Arts occupations in Sheldon, the most male-oriented occupations are Education, Arts & Media (100.0%), Management (25.0%), and Community & Social Service (20.0%), while the most female-oriented occupations are Education Instruction & Library (100.0%), Health Diagnosing & Treating (100.0%), and Community & Social Service (80.0%).
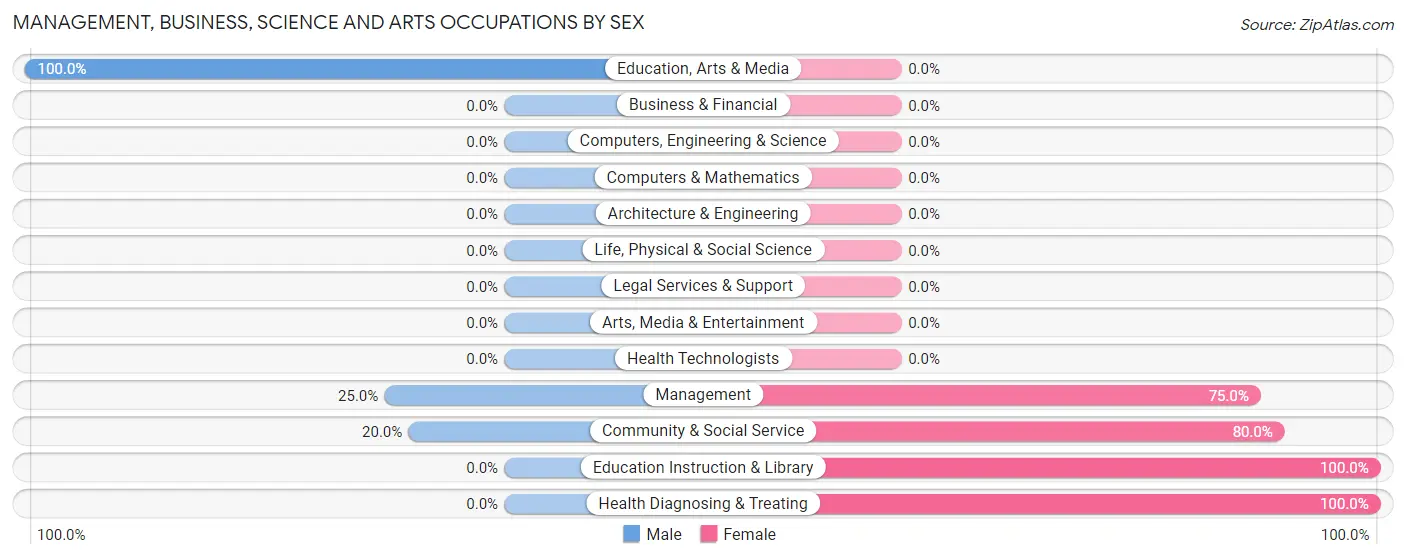
| Occupation | Male | Female |
| Management | 1 (25.0%) | 3 (75.0%) |
| Business & Financial | 0 (0.0%) | 0 (0.0%) |
| Computers, Engineering & Science | 0 (0.0%) | 0 (0.0%) |
| Computers & Mathematics | 0 (0.0%) | 0 (0.0%) |
| Architecture & Engineering | 0 (0.0%) | 0 (0.0%) |
| Life, Physical & Social Science | 0 (0.0%) | 0 (0.0%) |
| Community & Social Service | 2 (20.0%) | 8 (80.0%) |
| Education, Arts & Media | 2 (100.0%) | 0 (0.0%) |
| Legal Services & Support | 0 (0.0%) | 0 (0.0%) |
| Education Instruction & Library | 0 (0.0%) | 8 (100.0%) |
| Arts, Media & Entertainment | 0 (0.0%) | 0 (0.0%) |
| Health Diagnosing & Treating | 0 (0.0%) | 6 (100.0%) |
| Health Technologists | 0 (0.0%) | 0 (0.0%) |
| Total (Category) | 3 (15.0%) | 17 (85.0%) |
| Total (Overall) | 63 (59.4%) | 43 (40.6%) |
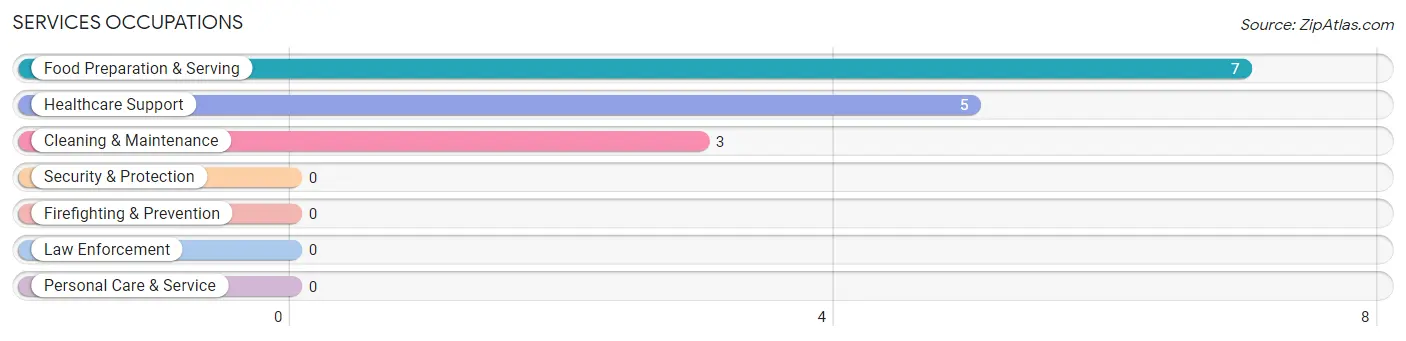
Services Occupations
The most common Services occupations in Sheldon are Food Preparation & Serving (7 | 6.6%), Healthcare Support (5 | 4.7%), and Cleaning & Maintenance (3 | 2.8%).
Services Occupations by Sex
Within the Services occupations in Sheldon, the most male-oriented occupations are Cleaning & Maintenance (100.0%), and Food Preparation & Serving (85.7%), while the most female-oriented occupations are Healthcare Support (100.0%), and Food Preparation & Serving (14.3%).
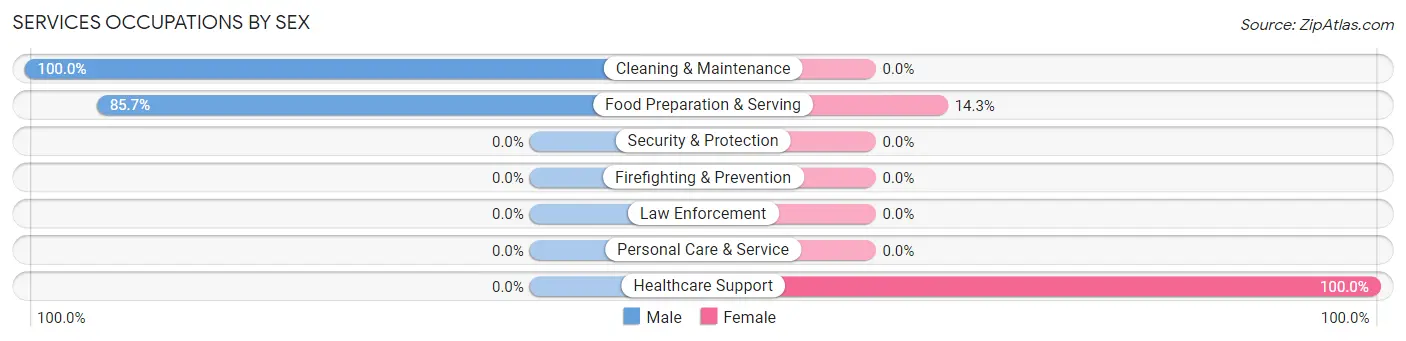
| Occupation | Male | Female |
| Healthcare Support | 0 (0.0%) | 5 (100.0%) |
| Security & Protection | 0 (0.0%) | 0 (0.0%) |
| Firefighting & Prevention | 0 (0.0%) | 0 (0.0%) |
| Law Enforcement | 0 (0.0%) | 0 (0.0%) |
| Food Preparation & Serving | 6 (85.7%) | 1 (14.3%) |
| Cleaning & Maintenance | 3 (100.0%) | 0 (0.0%) |
| Personal Care & Service | 0 (0.0%) | 0 (0.0%) |
| Total (Category) | 9 (60.0%) | 6 (40.0%) |
| Total (Overall) | 63 (59.4%) | 43 (40.6%) |
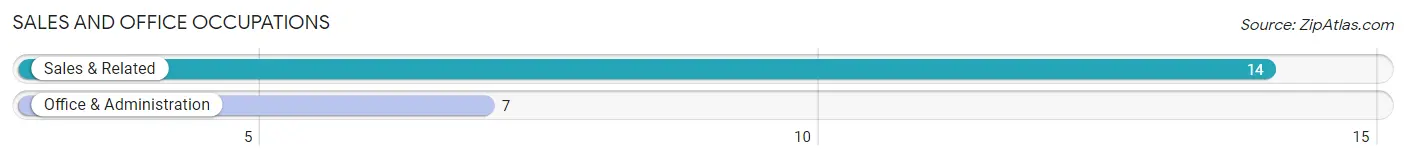
Sales and Office Occupations
The most common Sales and Office occupations in Sheldon are Sales & Related (14 | 13.2%), and Office & Administration (7 | 6.6%).
Sales and Office Occupations by Sex
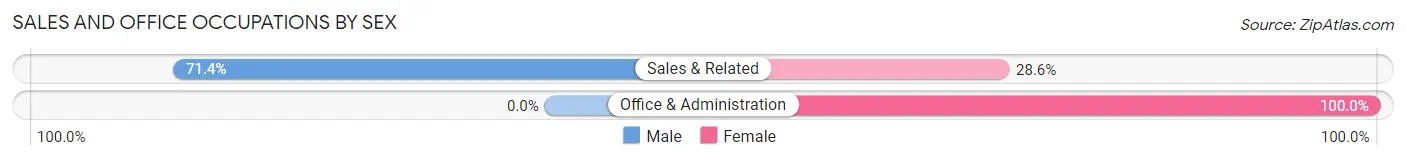
| Occupation | Male | Female |
| Sales & Related | 10 (71.4%) | 4 (28.6%) |
| Office & Administration | 0 (0.0%) | 7 (100.0%) |
| Total (Category) | 10 (47.6%) | 11 (52.4%) |
| Total (Overall) | 63 (59.4%) | 43 (40.6%) |
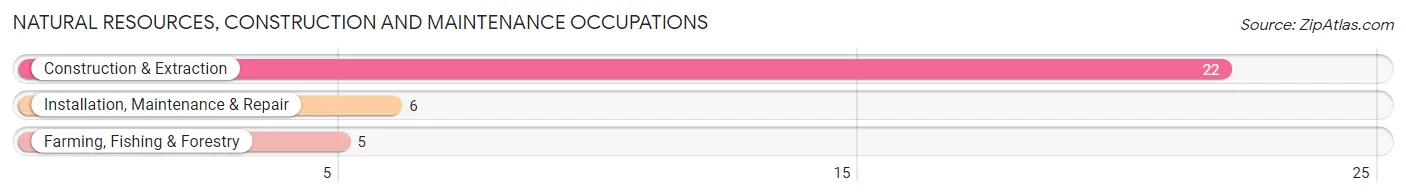
Natural Resources, Construction and Maintenance Occupations
The most common Natural Resources, Construction and Maintenance occupations in Sheldon are Construction & Extraction (22 | 20.7%), Installation, Maintenance & Repair (6 | 5.7%), and Farming, Fishing & Forestry (5 | 4.7%).
Natural Resources, Construction and Maintenance Occupations by Sex
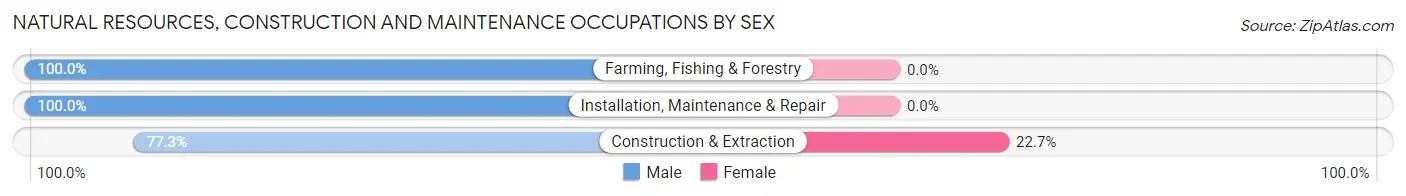
| Occupation | Male | Female |
| Farming, Fishing & Forestry | 5 (100.0%) | 0 (0.0%) |
| Construction & Extraction | 17 (77.3%) | 5 (22.7%) |
| Installation, Maintenance & Repair | 6 (100.0%) | 0 (0.0%) |
| Total (Category) | 28 (84.9%) | 5 (15.1%) |
| Total (Overall) | 63 (59.4%) | 43 (40.6%) |
Production, Transportation and Moving Occupations
The most common Production, Transportation and Moving occupations in Sheldon are Production (13 | 12.3%), and Transportation (4 | 3.8%).
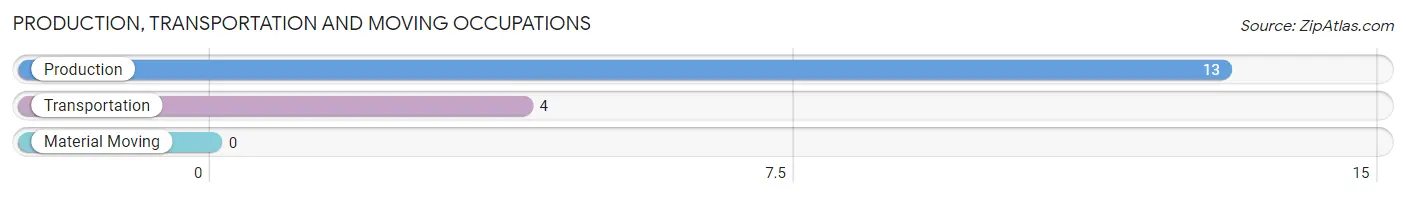
Production, Transportation and Moving Occupations by Sex
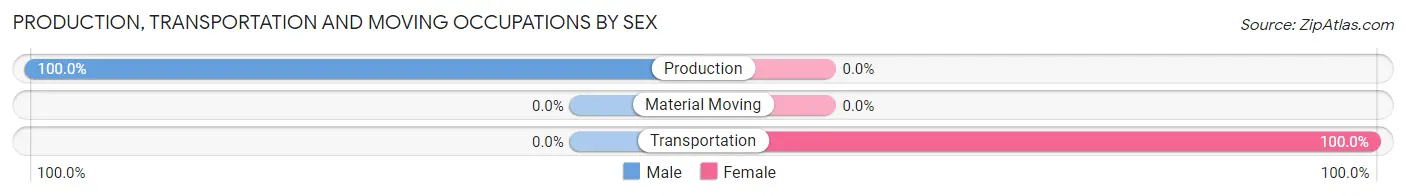
| Occupation | Male | Female |
| Production | 13 (100.0%) | 0 (0.0%) |
| Transportation | 0 (0.0%) | 4 (100.0%) |
| Material Moving | 0 (0.0%) | 0 (0.0%) |
| Total (Category) | 13 (76.5%) | 4 (23.5%) |
| Total (Overall) | 63 (59.4%) | 43 (40.6%) |
Employment Industries by Sex in Sheldon
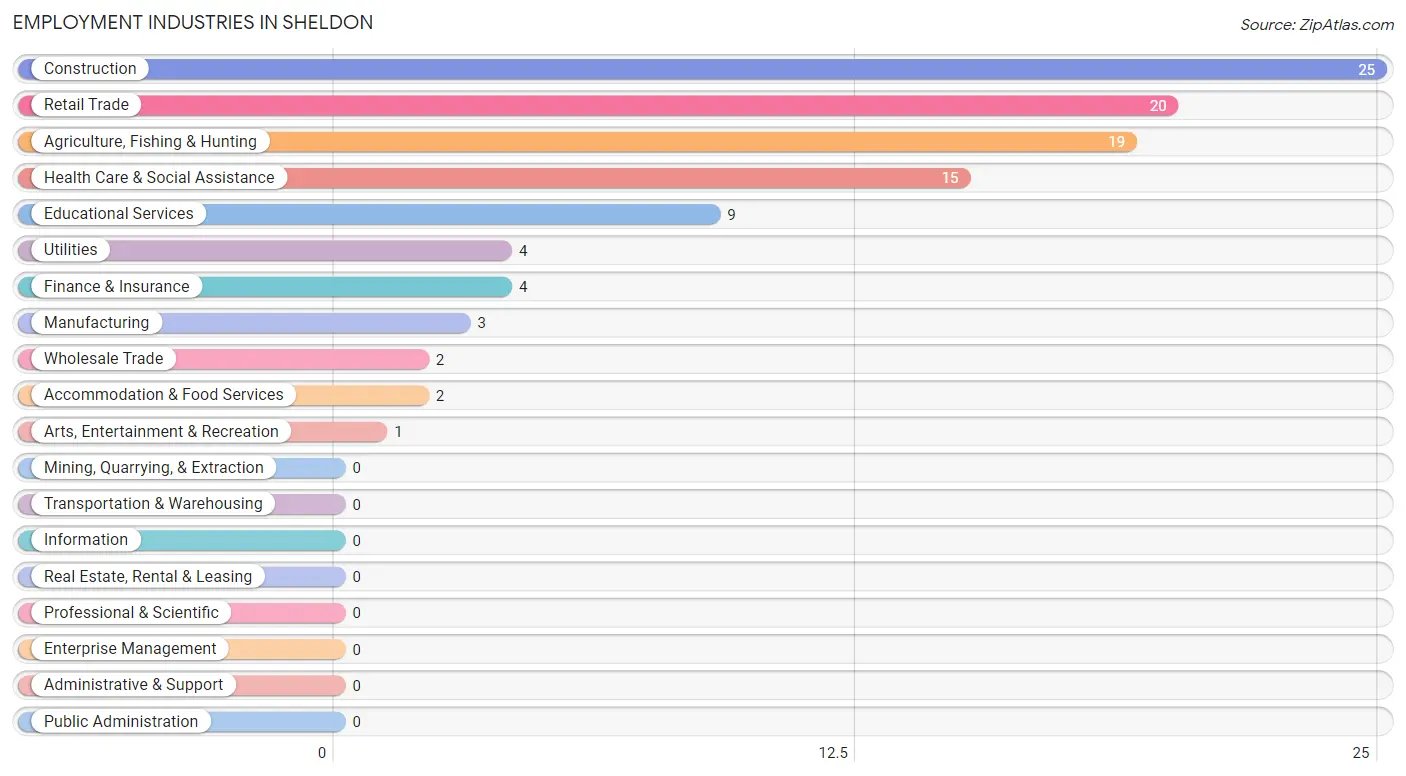
Employment Industries in Sheldon
The major employment industries in Sheldon include Construction (25 | 23.6%), Retail Trade (20 | 18.9%), Agriculture, Fishing & Hunting (19 | 17.9%), Health Care & Social Assistance (15 | 14.1%), and Educational Services (9 | 8.5%).
Employment Industries by Sex in Sheldon
The Sheldon industries that see more men than women are Manufacturing (100.0%), Wholesale Trade (100.0%), and Utilities (100.0%), whereas the industries that tend to have a higher number of women are Finance & Insurance (100.0%), Educational Services (100.0%), and Accommodation & Food Services (100.0%).
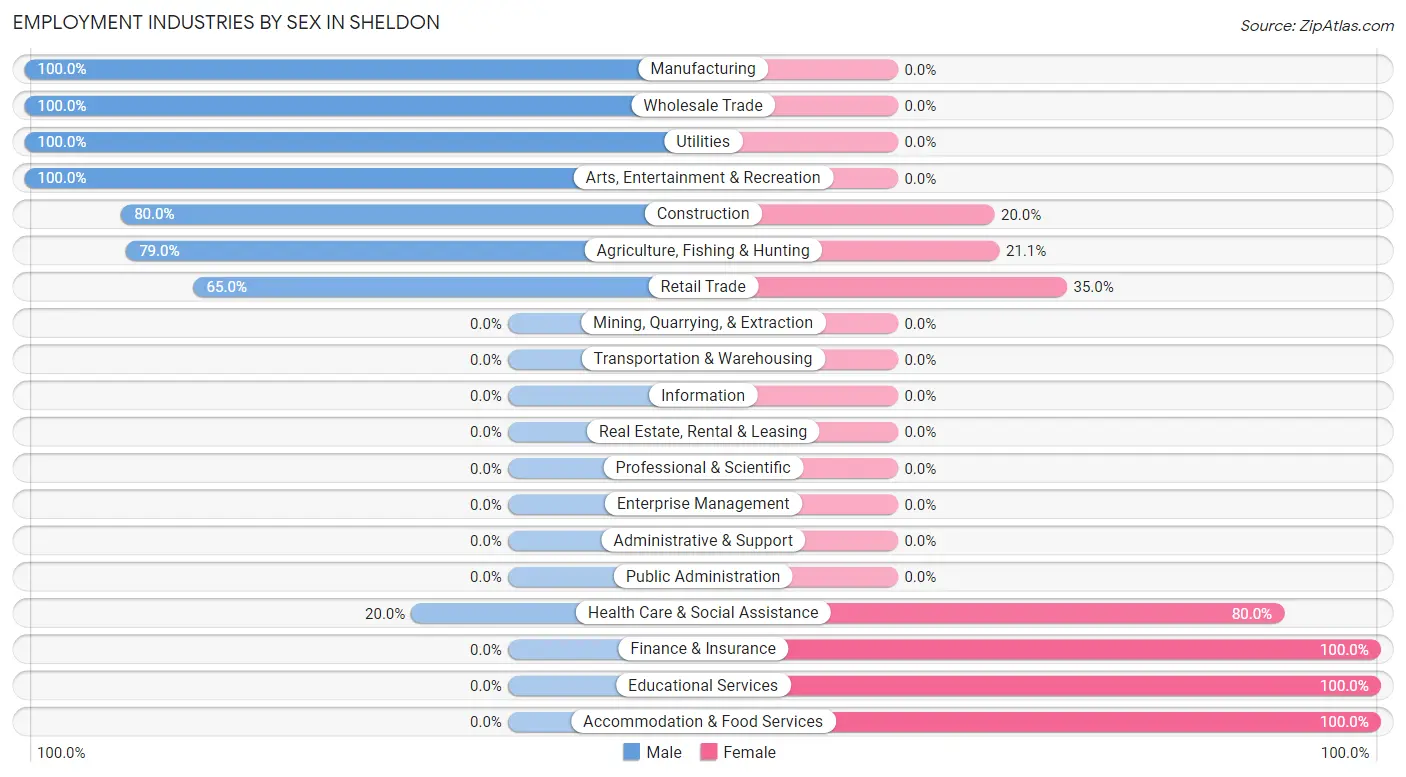
| Industry | Male | Female |
| Agriculture, Fishing & Hunting | 15 (78.9%) | 4 (21.0%) |
| Mining, Quarrying, & Extraction | 0 (0.0%) | 0 (0.0%) |
| Construction | 20 (80.0%) | 5 (20.0%) |
| Manufacturing | 3 (100.0%) | 0 (0.0%) |
| Wholesale Trade | 2 (100.0%) | 0 (0.0%) |
| Retail Trade | 13 (65.0%) | 7 (35.0%) |
| Transportation & Warehousing | 0 (0.0%) | 0 (0.0%) |
| Utilities | 4 (100.0%) | 0 (0.0%) |
| Information | 0 (0.0%) | 0 (0.0%) |
| Finance & Insurance | 0 (0.0%) | 4 (100.0%) |
| Real Estate, Rental & Leasing | 0 (0.0%) | 0 (0.0%) |
| Professional & Scientific | 0 (0.0%) | 0 (0.0%) |
| Enterprise Management | 0 (0.0%) | 0 (0.0%) |
| Administrative & Support | 0 (0.0%) | 0 (0.0%) |
| Educational Services | 0 (0.0%) | 9 (100.0%) |
| Health Care & Social Assistance | 3 (20.0%) | 12 (80.0%) |
| Arts, Entertainment & Recreation | 1 (100.0%) | 0 (0.0%) |
| Accommodation & Food Services | 0 (0.0%) | 2 (100.0%) |
| Public Administration | 0 (0.0%) | 0 (0.0%) |
| Total | 63 (59.4%) | 43 (40.6%) |
Education in Sheldon
School Enrollment in Sheldon
The most common levels of schooling among the 26 students in Sheldon are high school (20 | 76.9%), middle school (4 | 15.4%), and elementary school (2 | 7.7%).
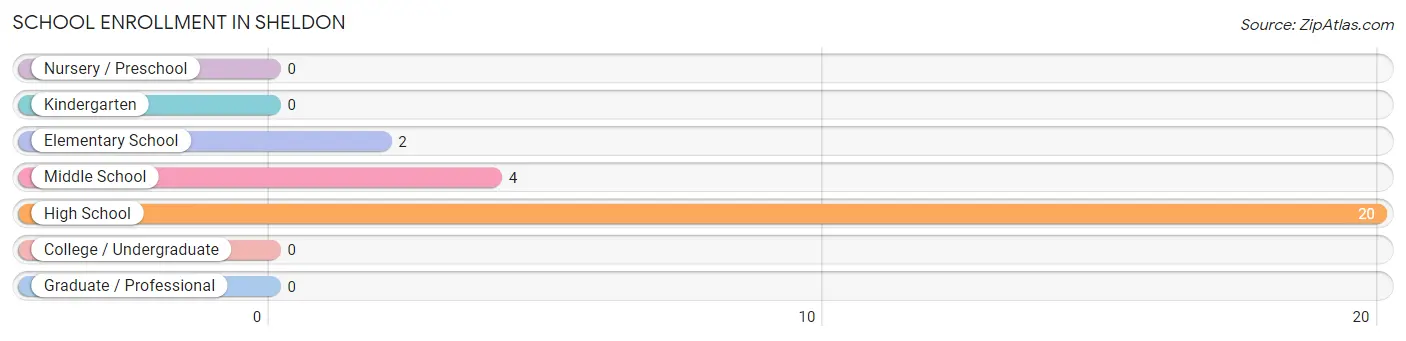
| School Level | # Students | % Students |
| Nursery / Preschool | 0 | 0.0% |
| Kindergarten | 0 | 0.0% |
| Elementary School | 2 | 7.7% |
| Middle School | 4 | 15.4% |
| High School | 20 | 76.9% |
| College / Undergraduate | 0 | 0.0% |
| Graduate / Professional | 0 | 0.0% |
| Total | 26 | 100.0% |
School Enrollment by Age by Funding Source in Sheldon
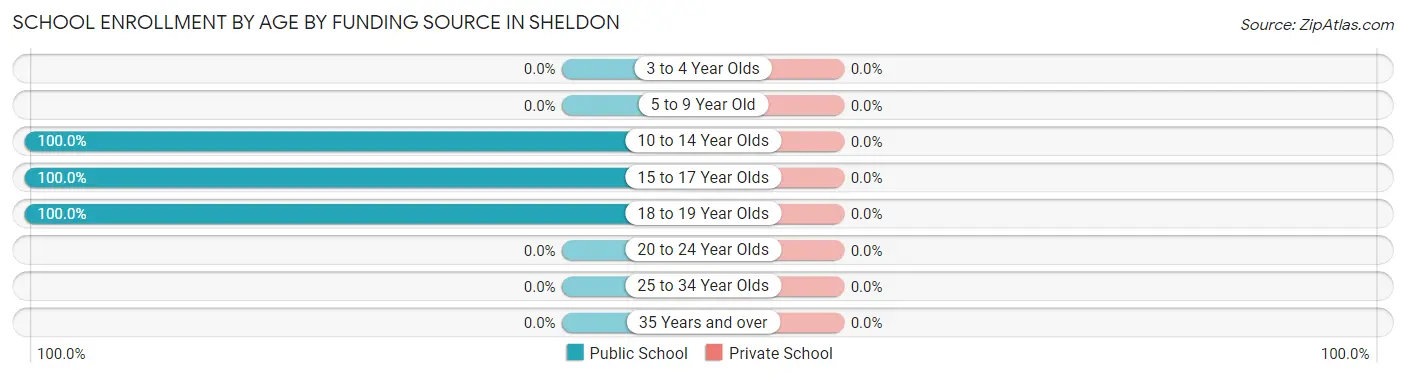
| Age Bracket | Public School | Private School |
| 3 to 4 Year Olds | 0 (0.0%) | 0 (0.0%) |
| 5 to 9 Year Old | 0 (0.0%) | 0 (0.0%) |
| 10 to 14 Year Olds | 6 (100.0%) | 0 (0.0%) |
| 15 to 17 Year Olds | 17 (100.0%) | 0 (0.0%) |
| 18 to 19 Year Olds | 3 (100.0%) | 0 (0.0%) |
| 20 to 24 Year Olds | 0 (0.0%) | 0 (0.0%) |
| 25 to 34 Year Olds | 0 (0.0%) | 0 (0.0%) |
| 35 Years and over | 0 (0.0%) | 0 (0.0%) |
| Total | 26 (100.0%) | 0 (0.0%) |
Educational Attainment by Field of Study in Sheldon
Education (9 | 64.3%), business (3 | 21.4%), psychology (1 | 7.1%), and social sciences (1 | 7.1%) are the most common fields of study among 14 individuals in Sheldon who have obtained a bachelor's degree or higher.
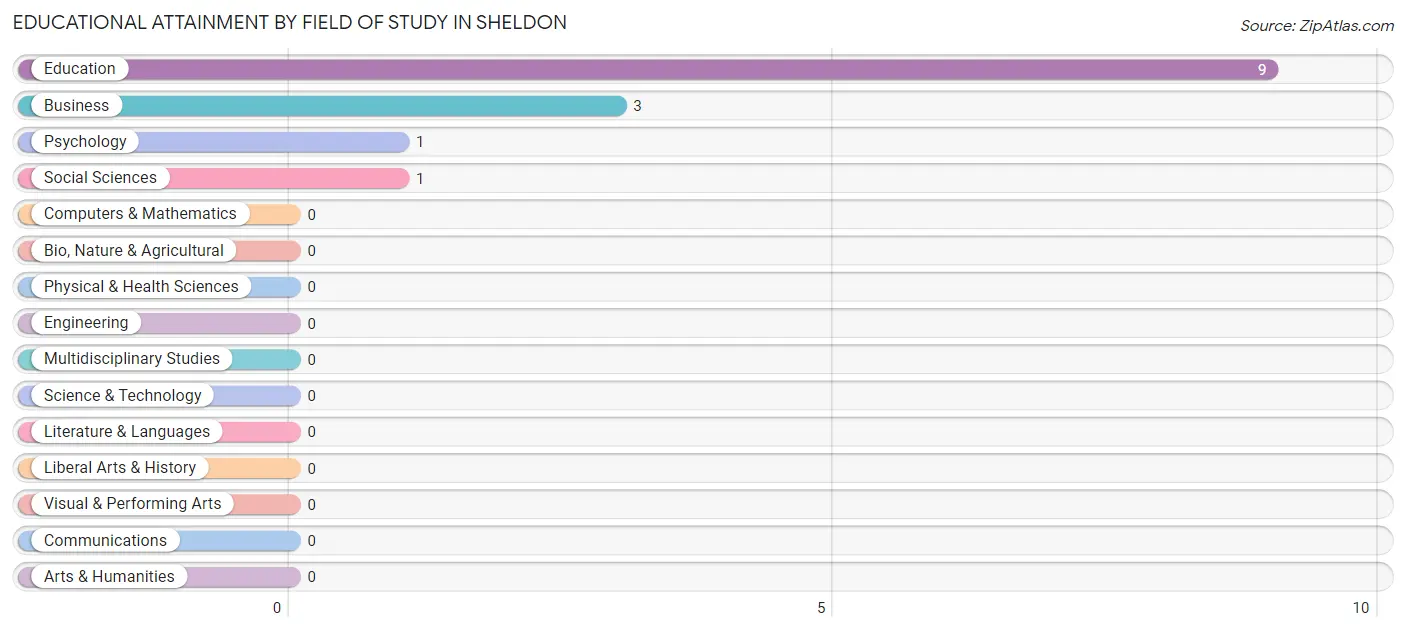
| Field of Study | # Graduates | % Graduates |
| Computers & Mathematics | 0 | 0.0% |
| Bio, Nature & Agricultural | 0 | 0.0% |
| Physical & Health Sciences | 0 | 0.0% |
| Psychology | 1 | 7.1% |
| Social Sciences | 1 | 7.1% |
| Engineering | 0 | 0.0% |
| Multidisciplinary Studies | 0 | 0.0% |
| Science & Technology | 0 | 0.0% |
| Business | 3 | 21.4% |
| Education | 9 | 64.3% |
| Literature & Languages | 0 | 0.0% |
| Liberal Arts & History | 0 | 0.0% |
| Visual & Performing Arts | 0 | 0.0% |
| Communications | 0 | 0.0% |
| Arts & Humanities | 0 | 0.0% |
| Total | 14 | 100.0% |
Transportation & Commute in Sheldon
Vehicle Availability by Sex in Sheldon
The most prevalent vehicle ownership categories in Sheldon are males with 2 vehicles (36, accounting for 57.1%) and females with 2 vehicles (13, making up 83.7%).
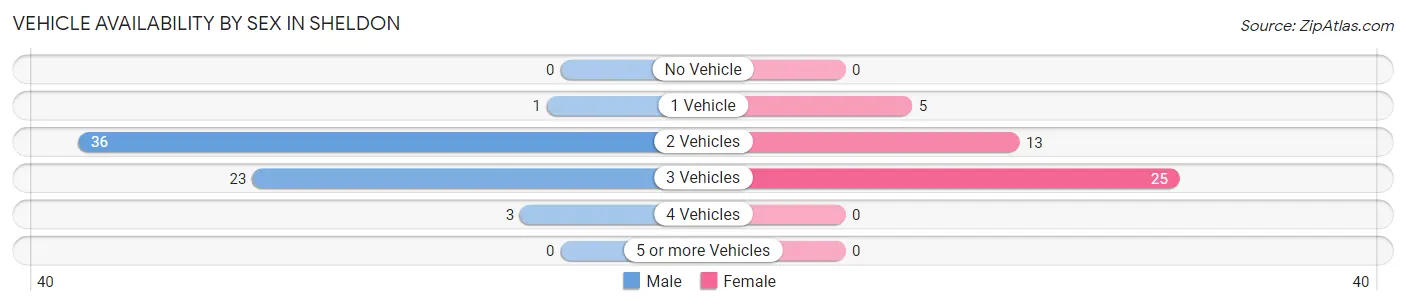
| Vehicles Available | Male | Female |
| No Vehicle | 0 (0.0%) | 0 (0.0%) |
| 1 Vehicle | 1 (1.6%) | 5 (11.6%) |
| 2 Vehicles | 36 (57.1%) | 13 (30.2%) |
| 3 Vehicles | 23 (36.5%) | 25 (58.1%) |
| 4 Vehicles | 3 (4.8%) | 0 (0.0%) |
| 5 or more Vehicles | 0 (0.0%) | 0 (0.0%) |
| Total | 63 (100.0%) | 43 (100.0%) |
Commute Time in Sheldon
The most frequently occuring commute durations in Sheldon are 10 to 14 minutes (30 commuters, 29.1%), 90 or more minutes (17 commuters, 16.5%), and 15 to 19 minutes (15 commuters, 14.6%).
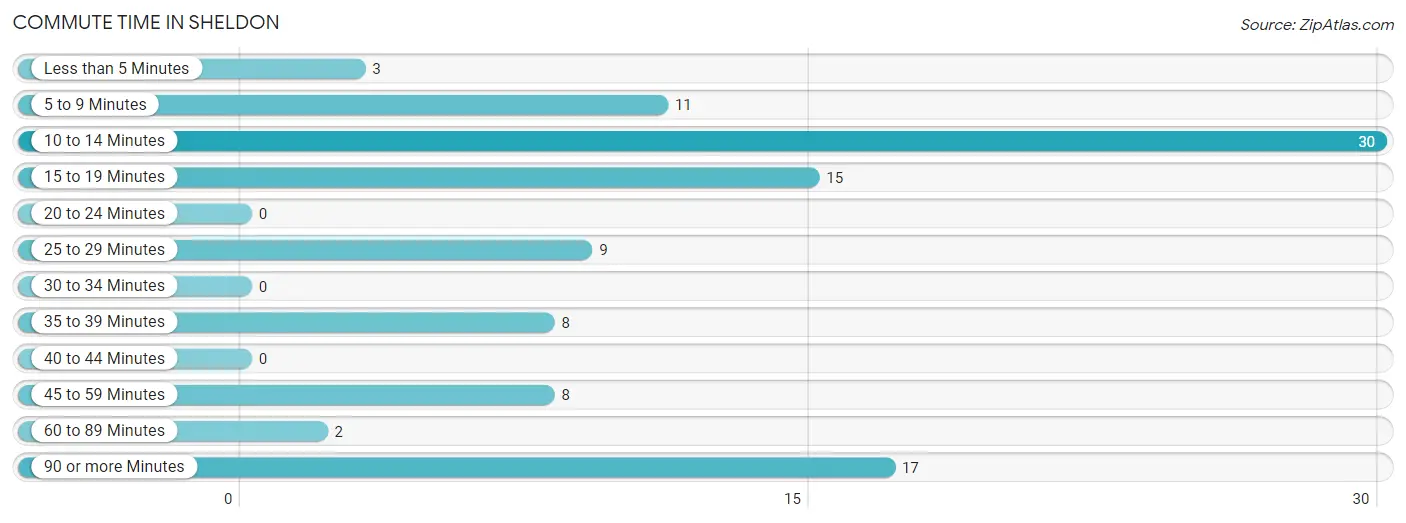
| Commute Time | # Commuters | % Commuters |
| Less than 5 Minutes | 3 | 2.9% |
| 5 to 9 Minutes | 11 | 10.7% |
| 10 to 14 Minutes | 30 | 29.1% |
| 15 to 19 Minutes | 15 | 14.6% |
| 20 to 24 Minutes | 0 | 0.0% |
| 25 to 29 Minutes | 9 | 8.7% |
| 30 to 34 Minutes | 0 | 0.0% |
| 35 to 39 Minutes | 8 | 7.8% |
| 40 to 44 Minutes | 0 | 0.0% |
| 45 to 59 Minutes | 8 | 7.8% |
| 60 to 89 Minutes | 2 | 1.9% |
| 90 or more Minutes | 17 | 16.5% |
Commute Time by Sex in Sheldon
The most common commute times in Sheldon are 10 to 14 minutes (17 commuters, 27.0%) for males and 10 to 14 minutes (13 commuters, 32.5%) for females.
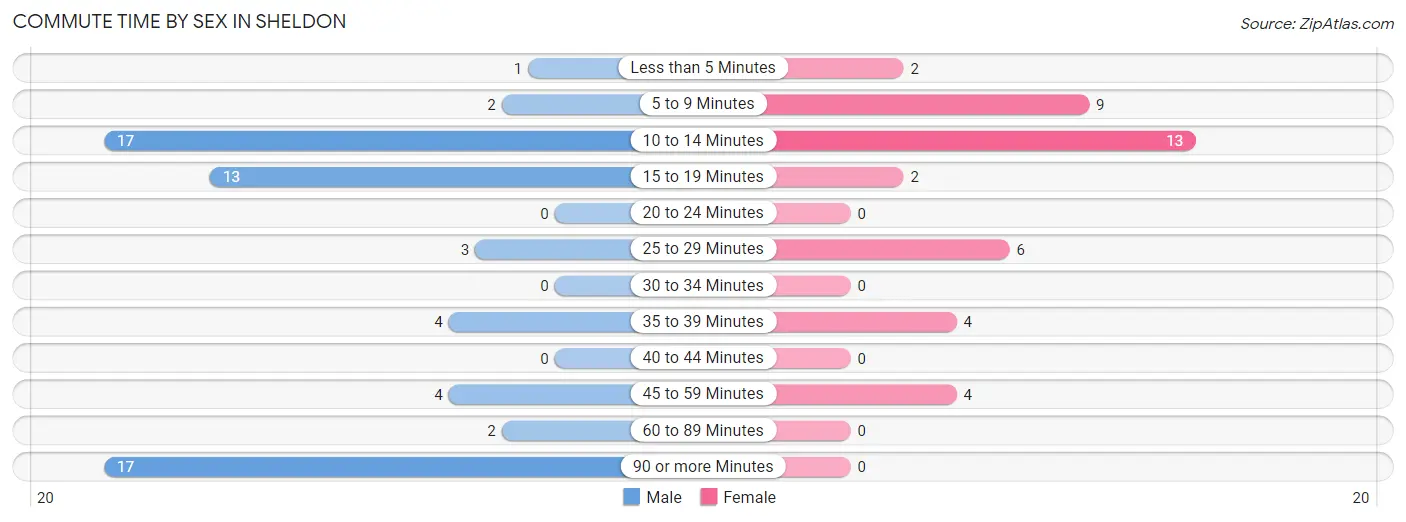
| Commute Time | Male | Female |
| Less than 5 Minutes | 1 (1.6%) | 2 (5.0%) |
| 5 to 9 Minutes | 2 (3.2%) | 9 (22.5%) |
| 10 to 14 Minutes | 17 (27.0%) | 13 (32.5%) |
| 15 to 19 Minutes | 13 (20.6%) | 2 (5.0%) |
| 20 to 24 Minutes | 0 (0.0%) | 0 (0.0%) |
| 25 to 29 Minutes | 3 (4.8%) | 6 (15.0%) |
| 30 to 34 Minutes | 0 (0.0%) | 0 (0.0%) |
| 35 to 39 Minutes | 4 (6.4%) | 4 (10.0%) |
| 40 to 44 Minutes | 0 (0.0%) | 0 (0.0%) |
| 45 to 59 Minutes | 4 (6.4%) | 4 (10.0%) |
| 60 to 89 Minutes | 2 (3.2%) | 0 (0.0%) |
| 90 or more Minutes | 17 (27.0%) | 0 (0.0%) |
Time of Departure to Work by Sex in Sheldon
The most frequent times of departure to work in Sheldon are 5:00 AM to 5:29 AM (21, 33.3%) for males and 7:00 AM to 7:29 AM (14, 35.0%) for females.
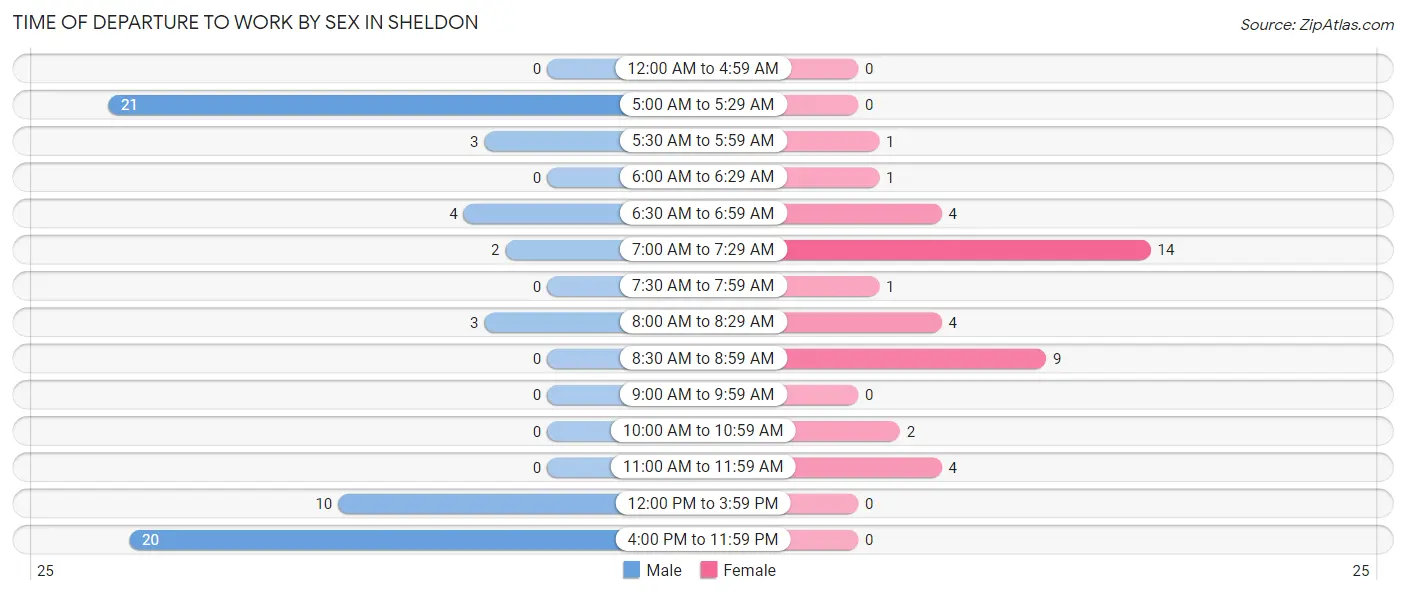
| Time of Departure | Male | Female |
| 12:00 AM to 4:59 AM | 0 (0.0%) | 0 (0.0%) |
| 5:00 AM to 5:29 AM | 21 (33.3%) | 0 (0.0%) |
| 5:30 AM to 5:59 AM | 3 (4.8%) | 1 (2.5%) |
| 6:00 AM to 6:29 AM | 0 (0.0%) | 1 (2.5%) |
| 6:30 AM to 6:59 AM | 4 (6.4%) | 4 (10.0%) |
| 7:00 AM to 7:29 AM | 2 (3.2%) | 14 (35.0%) |
| 7:30 AM to 7:59 AM | 0 (0.0%) | 1 (2.5%) |
| 8:00 AM to 8:29 AM | 3 (4.8%) | 4 (10.0%) |
| 8:30 AM to 8:59 AM | 0 (0.0%) | 9 (22.5%) |
| 9:00 AM to 9:59 AM | 0 (0.0%) | 0 (0.0%) |
| 10:00 AM to 10:59 AM | 0 (0.0%) | 2 (5.0%) |
| 11:00 AM to 11:59 AM | 0 (0.0%) | 4 (10.0%) |
| 12:00 PM to 3:59 PM | 10 (15.9%) | 0 (0.0%) |
| 4:00 PM to 11:59 PM | 20 (31.8%) | 0 (0.0%) |
| Total | 63 (100.0%) | 40 (100.0%) |
Housing Occupancy in Sheldon
Occupancy by Ownership in Sheldon
Of the total 62 dwellings in Sheldon, owner-occupied units account for 61 (98.4%), while renter-occupied units make up 1 (1.6%).
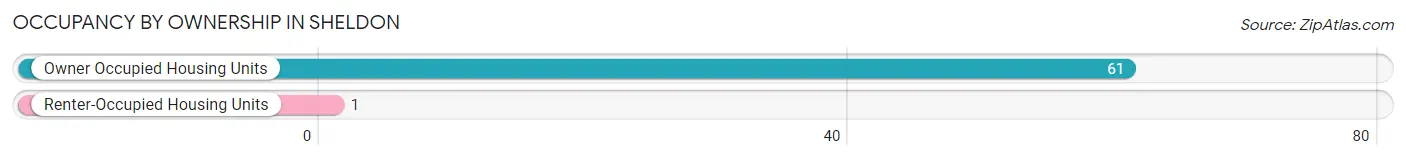
| Occupancy | # Housing Units | % Housing Units |
| Owner Occupied Housing Units | 61 | 98.4% |
| Renter-Occupied Housing Units | 1 | 1.6% |
| Total Occupied Housing Units | 62 | 100.0% |
Occupancy by Household Size in Sheldon
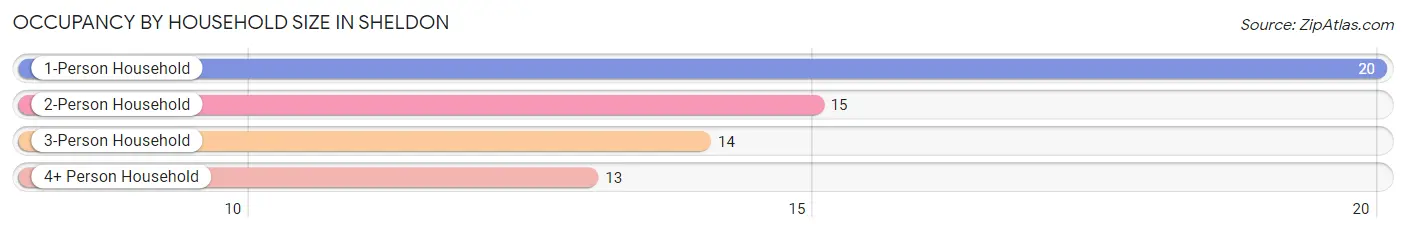
| Household Size | # Housing Units | % Housing Units |
| 1-Person Household | 20 | 32.3% |
| 2-Person Household | 15 | 24.2% |
| 3-Person Household | 14 | 22.6% |
| 4+ Person Household | 13 | 21.0% |
| Total Housing Units | 62 | 100.0% |
Occupancy by Ownership by Household Size in Sheldon
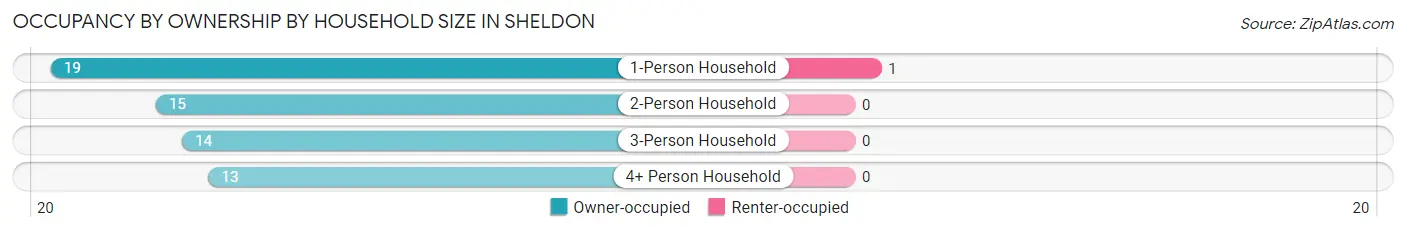
| Household Size | Owner-occupied | Renter-occupied |
| 1-Person Household | 19 (95.0%) | 1 (5.0%) |
| 2-Person Household | 15 (100.0%) | 0 (0.0%) |
| 3-Person Household | 14 (100.0%) | 0 (0.0%) |
| 4+ Person Household | 13 (100.0%) | 0 (0.0%) |
| Total Housing Units | 61 (98.4%) | 1 (1.6%) |
Occupancy by Educational Attainment in Sheldon
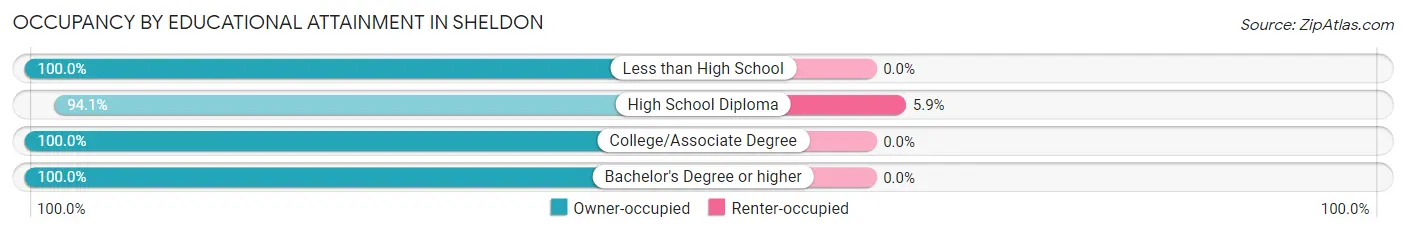
| Household Size | Owner-occupied | Renter-occupied |
| Less than High School | 6 (100.0%) | 0 (0.0%) |
| High School Diploma | 16 (94.1%) | 1 (5.9%) |
| College/Associate Degree | 26 (100.0%) | 0 (0.0%) |
| Bachelor's Degree or higher | 13 (100.0%) | 0 (0.0%) |
Occupancy by Age of Householder in Sheldon
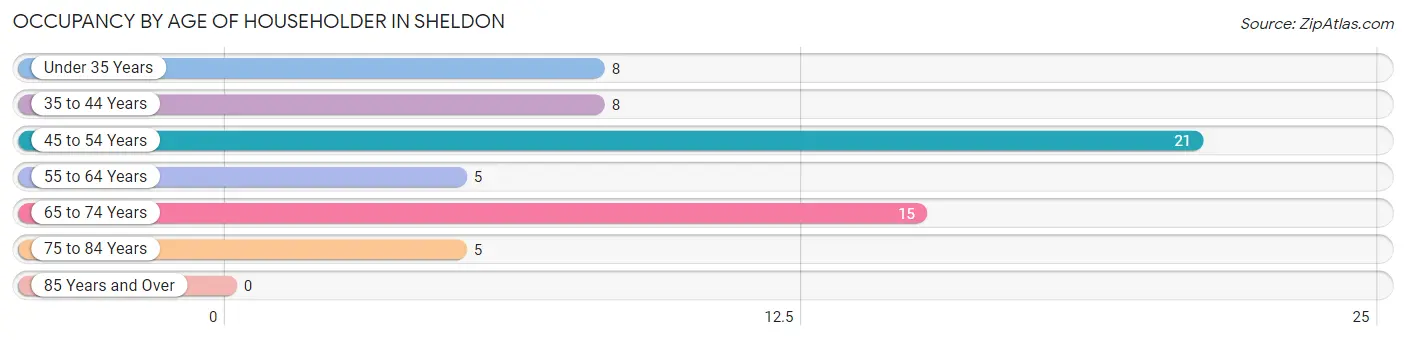
| Age Bracket | # Households | % Households |
| Under 35 Years | 8 | 12.9% |
| 35 to 44 Years | 8 | 12.9% |
| 45 to 54 Years | 21 | 33.9% |
| 55 to 64 Years | 5 | 8.1% |
| 65 to 74 Years | 15 | 24.2% |
| 75 to 84 Years | 5 | 8.1% |
| 85 Years and Over | 0 | 0.0% |
| Total | 62 | 100.0% |
Housing Finances in Sheldon
Median Income by Occupancy in Sheldon
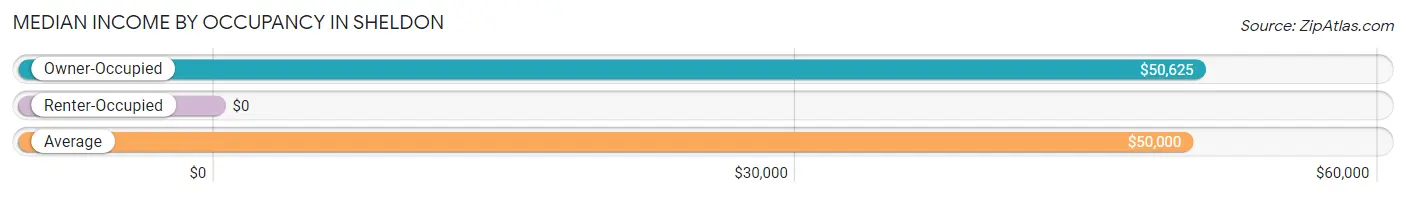
| Occupancy Type | # Households | Median Income |
| Owner-Occupied | 61 (98.4%) | $50,625 |
| Renter-Occupied | 1 (1.6%) | $0 |
| Average | 62 (100.0%) | $50,000 |
Occupancy by Householder Income Bracket in Sheldon
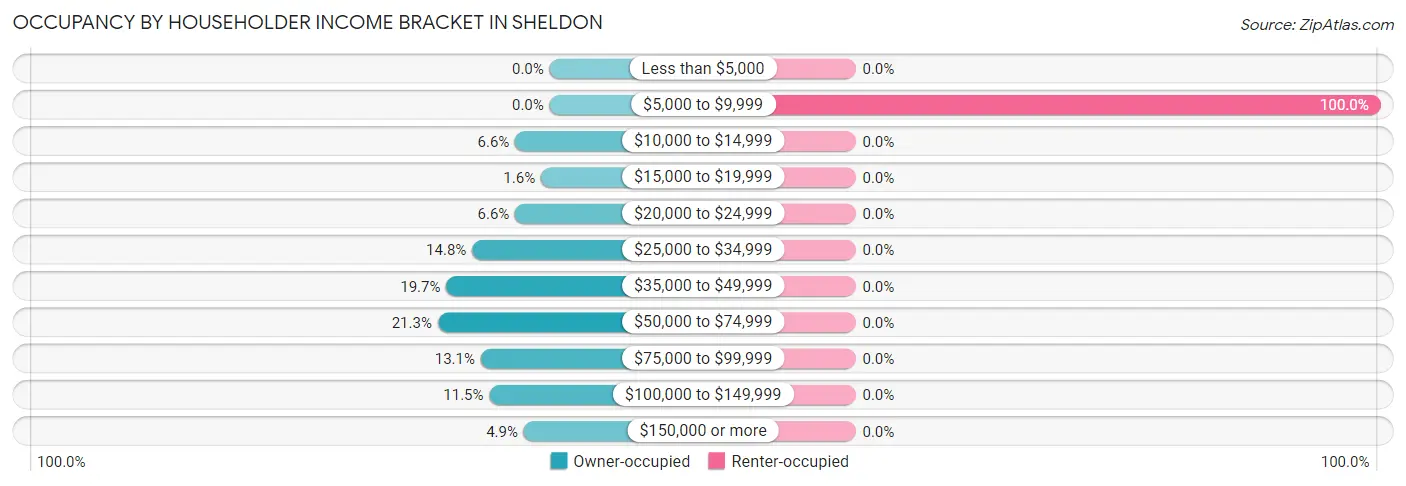
| Income Bracket | Owner-occupied | Renter-occupied |
| Less than $5,000 | 0 (0.0%) | 0 (0.0%) |
| $5,000 to $9,999 | 0 (0.0%) | 1 (100.0%) |
| $10,000 to $14,999 | 4 (6.6%) | 0 (0.0%) |
| $15,000 to $19,999 | 1 (1.6%) | 0 (0.0%) |
| $20,000 to $24,999 | 4 (6.6%) | 0 (0.0%) |
| $25,000 to $34,999 | 9 (14.7%) | 0 (0.0%) |
| $35,000 to $49,999 | 12 (19.7%) | 0 (0.0%) |
| $50,000 to $74,999 | 13 (21.3%) | 0 (0.0%) |
| $75,000 to $99,999 | 8 (13.1%) | 0 (0.0%) |
| $100,000 to $149,999 | 7 (11.5%) | 0 (0.0%) |
| $150,000 or more | 3 (4.9%) | 0 (0.0%) |
| Total | 61 (100.0%) | 1 (100.0%) |
Monthly Housing Cost Tiers in Sheldon
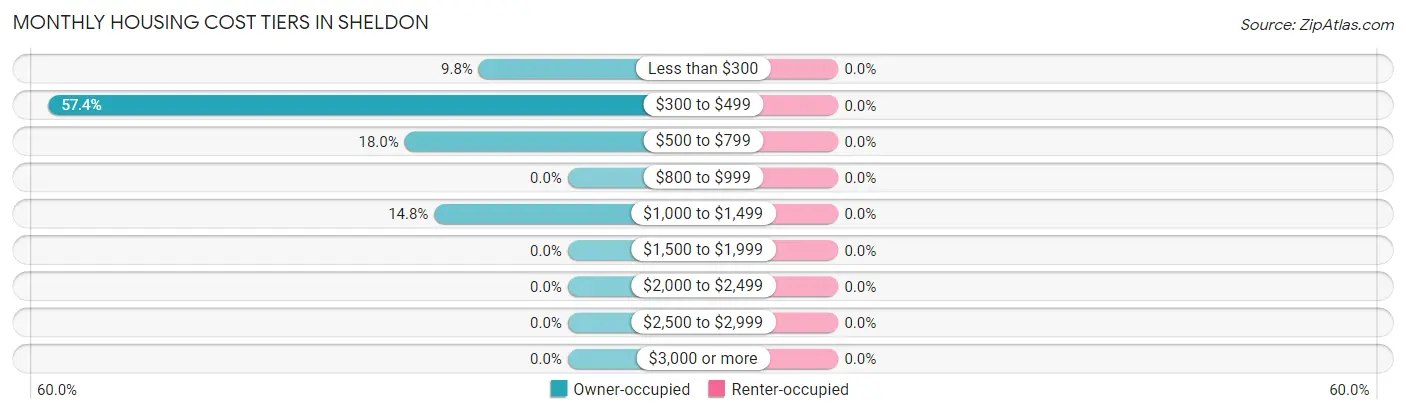
| Monthly Cost | Owner-occupied | Renter-occupied |
| Less than $300 | 6 (9.8%) | 0 (0.0%) |
| $300 to $499 | 35 (57.4%) | 0 (0.0%) |
| $500 to $799 | 11 (18.0%) | 0 (0.0%) |
| $800 to $999 | 0 (0.0%) | 0 (0.0%) |
| $1,000 to $1,499 | 9 (14.7%) | 0 (0.0%) |
| $1,500 to $1,999 | 0 (0.0%) | 0 (0.0%) |
| $2,000 to $2,499 | 0 (0.0%) | 0 (0.0%) |
| $2,500 to $2,999 | 0 (0.0%) | 0 (0.0%) |
| $3,000 or more | 0 (0.0%) | 0 (0.0%) |
| Total | 61 (100.0%) | 1 (100.0%) |
Physical Housing Characteristics in Sheldon
Housing Structures in Sheldon
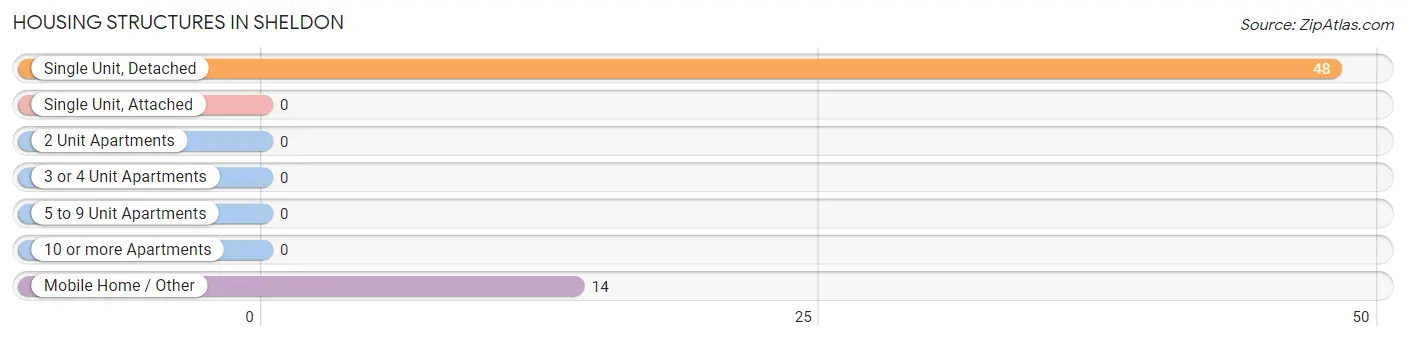
| Structure Type | # Housing Units | % Housing Units |
| Single Unit, Detached | 48 | 77.4% |
| Single Unit, Attached | 0 | 0.0% |
| 2 Unit Apartments | 0 | 0.0% |
| 3 or 4 Unit Apartments | 0 | 0.0% |
| 5 to 9 Unit Apartments | 0 | 0.0% |
| 10 or more Apartments | 0 | 0.0% |
| Mobile Home / Other | 14 | 22.6% |
| Total | 62 | 100.0% |
Housing Structures by Occupancy in Sheldon
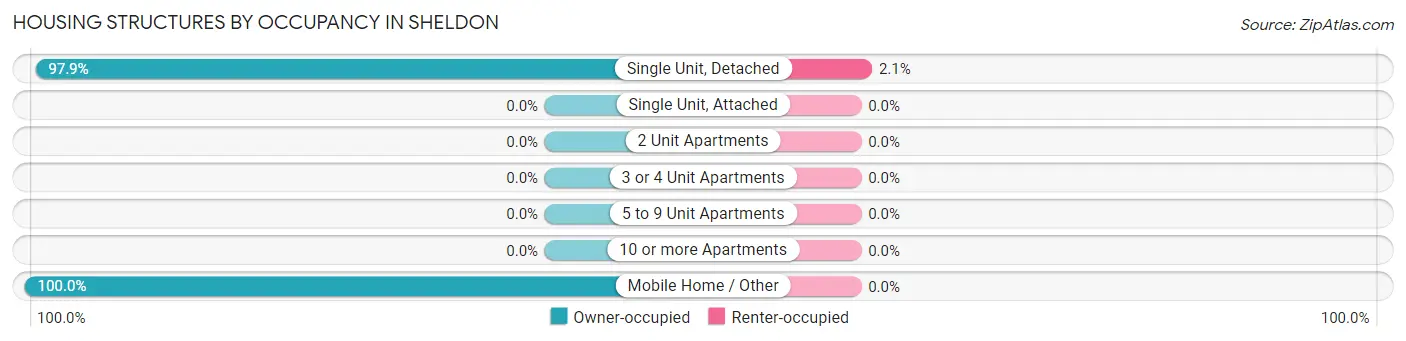
| Structure Type | Owner-occupied | Renter-occupied |
| Single Unit, Detached | 47 (97.9%) | 1 (2.1%) |
| Single Unit, Attached | 0 (0.0%) | 0 (0.0%) |
| 2 Unit Apartments | 0 (0.0%) | 0 (0.0%) |
| 3 or 4 Unit Apartments | 0 (0.0%) | 0 (0.0%) |
| 5 to 9 Unit Apartments | 0 (0.0%) | 0 (0.0%) |
| 10 or more Apartments | 0 (0.0%) | 0 (0.0%) |
| Mobile Home / Other | 14 (100.0%) | 0 (0.0%) |
| Total | 61 (98.4%) | 1 (1.6%) |
Housing Structures by Number of Rooms in Sheldon
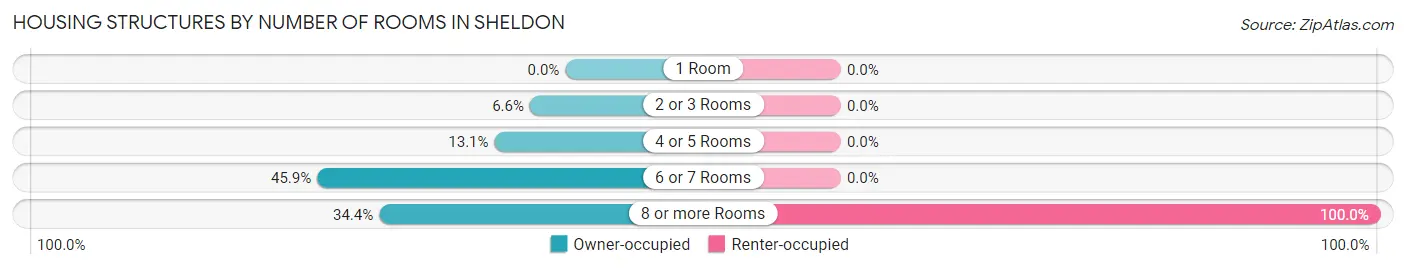
| Number of Rooms | Owner-occupied | Renter-occupied |
| 1 Room | 0 (0.0%) | 0 (0.0%) |
| 2 or 3 Rooms | 4 (6.6%) | 0 (0.0%) |
| 4 or 5 Rooms | 8 (13.1%) | 0 (0.0%) |
| 6 or 7 Rooms | 28 (45.9%) | 0 (0.0%) |
| 8 or more Rooms | 21 (34.4%) | 1 (100.0%) |
| Total | 61 (100.0%) | 1 (100.0%) |
Housing Structure by Heating Type in Sheldon
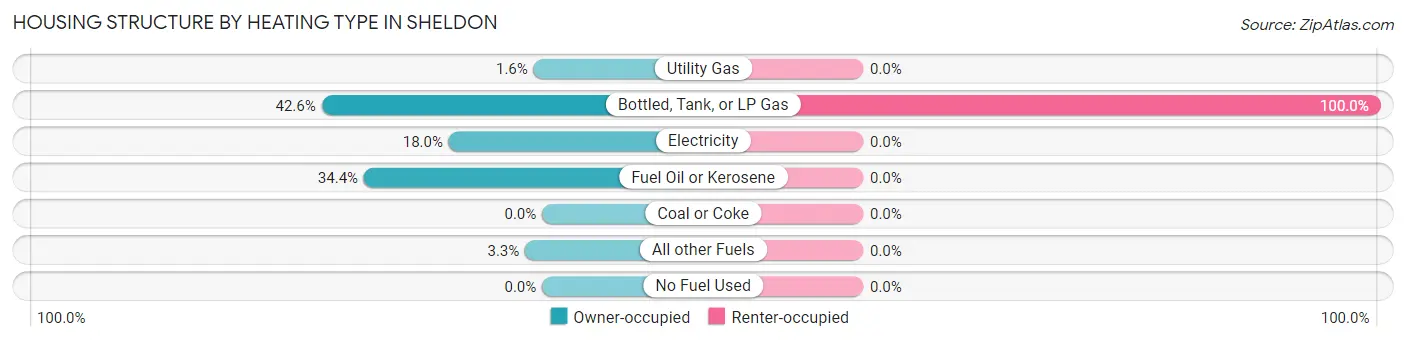
| Heating Type | Owner-occupied | Renter-occupied |
| Utility Gas | 1 (1.6%) | 0 (0.0%) |
| Bottled, Tank, or LP Gas | 26 (42.6%) | 1 (100.0%) |
| Electricity | 11 (18.0%) | 0 (0.0%) |
| Fuel Oil or Kerosene | 21 (34.4%) | 0 (0.0%) |
| Coal or Coke | 0 (0.0%) | 0 (0.0%) |
| All other Fuels | 2 (3.3%) | 0 (0.0%) |
| No Fuel Used | 0 (0.0%) | 0 (0.0%) |
| Total | 61 (100.0%) | 1 (100.0%) |
Household Vehicle Usage in Sheldon
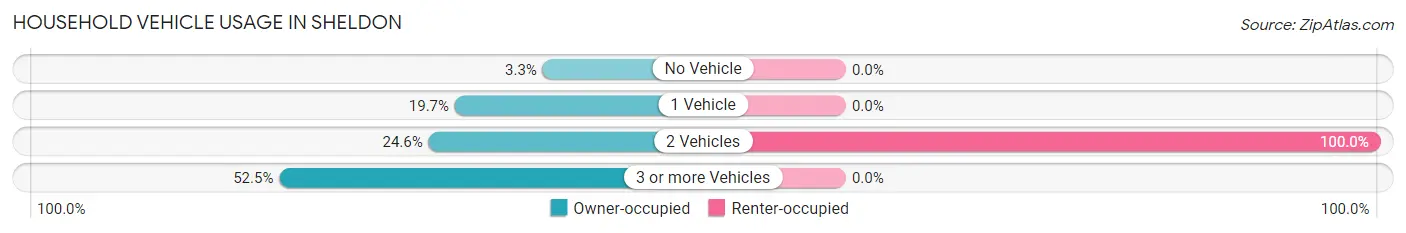
| Vehicles per Household | Owner-occupied | Renter-occupied |
| No Vehicle | 2 (3.3%) | 0 (0.0%) |
| 1 Vehicle | 12 (19.7%) | 0 (0.0%) |
| 2 Vehicles | 15 (24.6%) | 1 (100.0%) |
| 3 or more Vehicles | 32 (52.5%) | 0 (0.0%) |
| Total | 61 (100.0%) | 1 (100.0%) |
Real Estate & Mortgages in Sheldon
Real Estate and Mortgage Overview in Sheldon
| Characteristic | Without Mortgage | With Mortgage |
| Housing Units | 49 | 12 |
| Median Property Value | $49,400 | $54,000 |
| Median Household Income | $50,625 | $3 |
| Monthly Housing Costs | $403 | $0 |
| Real Estate Taxes | $620 | $0 |
Property Value by Mortgage Status in Sheldon
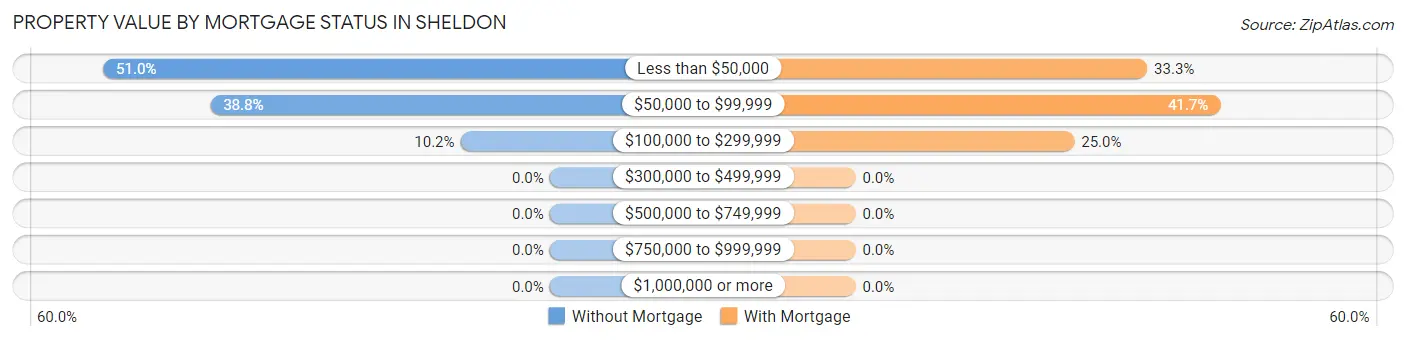
| Property Value | Without Mortgage | With Mortgage |
| Less than $50,000 | 25 (51.0%) | 4 (33.3%) |
| $50,000 to $99,999 | 19 (38.8%) | 5 (41.7%) |
| $100,000 to $299,999 | 5 (10.2%) | 3 (25.0%) |
| $300,000 to $499,999 | 0 (0.0%) | 0 (0.0%) |
| $500,000 to $749,999 | 0 (0.0%) | 0 (0.0%) |
| $750,000 to $999,999 | 0 (0.0%) | 0 (0.0%) |
| $1,000,000 or more | 0 (0.0%) | 0 (0.0%) |
| Total | 49 (100.0%) | 12 (100.0%) |
Household Income by Mortgage Status in Sheldon
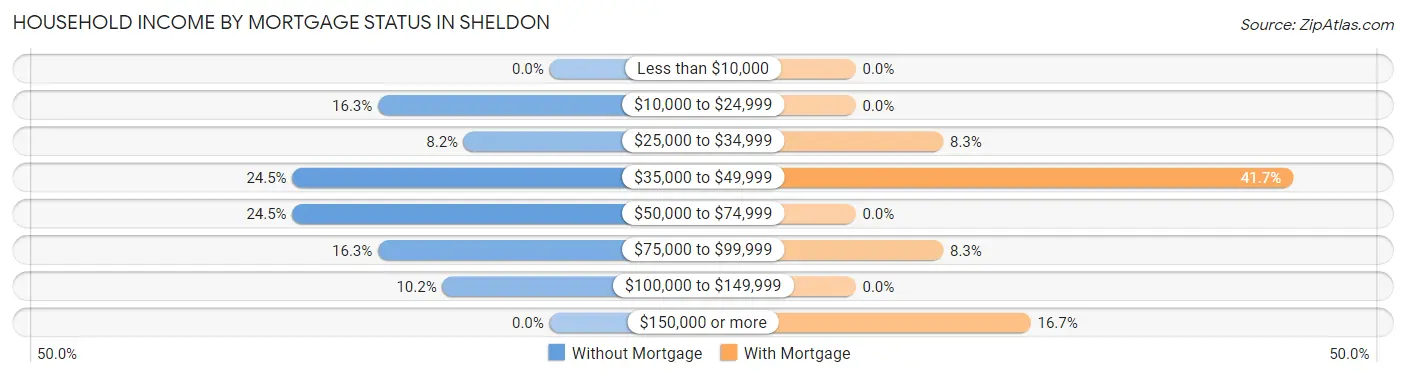
| Household Income | Without Mortgage | With Mortgage |
| Less than $10,000 | 0 (0.0%) | 0 (0.0%) |
| $10,000 to $24,999 | 8 (16.3%) | 0 (0.0%) |
| $25,000 to $34,999 | 4 (8.2%) | 1 (8.3%) |
| $35,000 to $49,999 | 12 (24.5%) | 5 (41.7%) |
| $50,000 to $74,999 | 12 (24.5%) | 0 (0.0%) |
| $75,000 to $99,999 | 8 (16.3%) | 1 (8.3%) |
| $100,000 to $149,999 | 5 (10.2%) | 0 (0.0%) |
| $150,000 or more | 0 (0.0%) | 2 (16.7%) |
| Total | 49 (100.0%) | 12 (100.0%) |
Property Value to Household Income Ratio in Sheldon
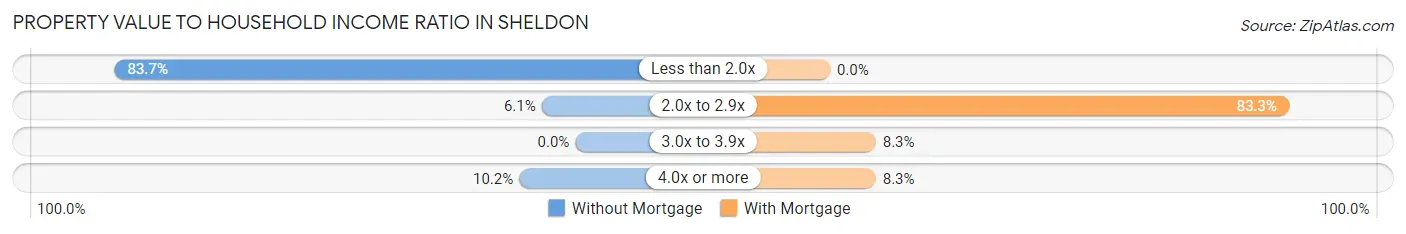
| Value-to-Income Ratio | Without Mortgage | With Mortgage |
| Less than 2.0x | 41 (83.7%) | 0 (0.0%) |
| 2.0x to 2.9x | 3 (6.1%) | 10 (83.3%) |
| 3.0x to 3.9x | 0 (0.0%) | 1 (8.3%) |
| 4.0x or more | 5 (10.2%) | 1 (8.3%) |
| Total | 49 (100.0%) | 12 (100.0%) |
Real Estate Taxes by Mortgage Status in Sheldon
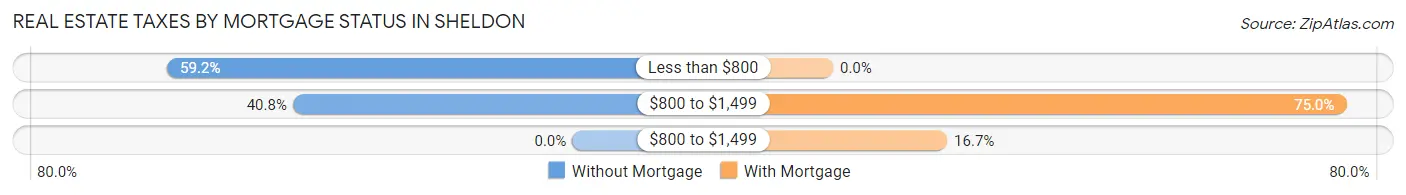
| Property Taxes | Without Mortgage | With Mortgage |
| Less than $800 | 29 (59.2%) | 0 (0.0%) |
| $800 to $1,499 | 20 (40.8%) | 9 (75.0%) |
| $800 to $1,499 | 0 (0.0%) | 2 (16.7%) |
| Total | 49 (100.0%) | 12 (100.0%) |
Health & Disability in Sheldon
Health Insurance Coverage by Age in Sheldon
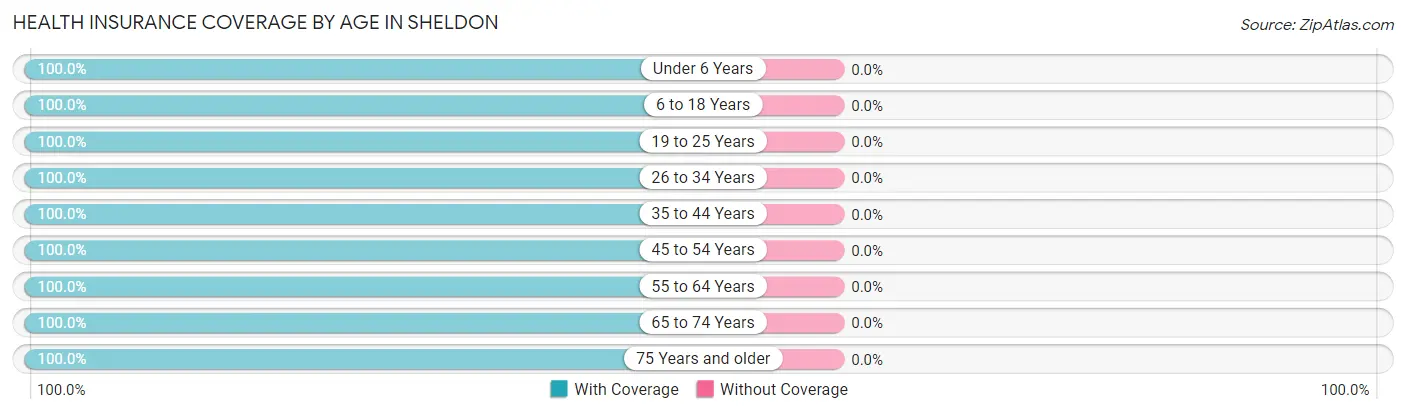
| Age Bracket | With Coverage | Without Coverage |
| Under 6 Years | 16 (100.0%) | 0 (0.0%) |
| 6 to 18 Years | 26 (100.0%) | 0 (0.0%) |
| 19 to 25 Years | 3 (100.0%) | 0 (0.0%) |
| 26 to 34 Years | 18 (100.0%) | 0 (0.0%) |
| 35 to 44 Years | 29 (100.0%) | 0 (0.0%) |
| 45 to 54 Years | 32 (100.0%) | 0 (0.0%) |
| 55 to 64 Years | 8 (100.0%) | 0 (0.0%) |
| 65 to 74 Years | 17 (100.0%) | 0 (0.0%) |
| 75 Years and older | 6 (100.0%) | 0 (0.0%) |
| Total | 155 (100.0%) | 0 (0.0%) |
Health Insurance Coverage by Citizenship Status in Sheldon
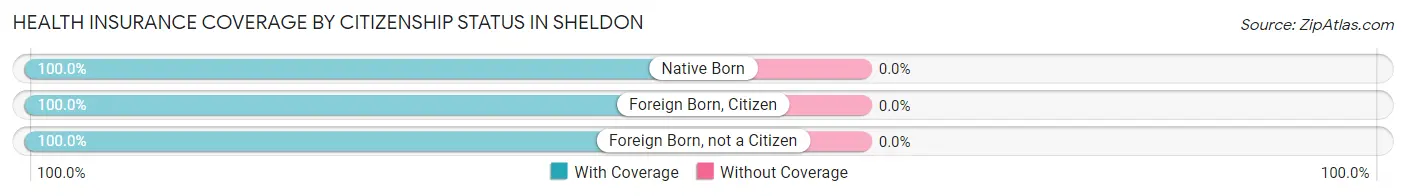
| Citizenship Status | With Coverage | Without Coverage |
| Native Born | 16 (100.0%) | 0 (0.0%) |
| Foreign Born, Citizen | 26 (100.0%) | 0 (0.0%) |
| Foreign Born, not a Citizen | 3 (100.0%) | 0 (0.0%) |
Health Insurance Coverage by Household Income in Sheldon
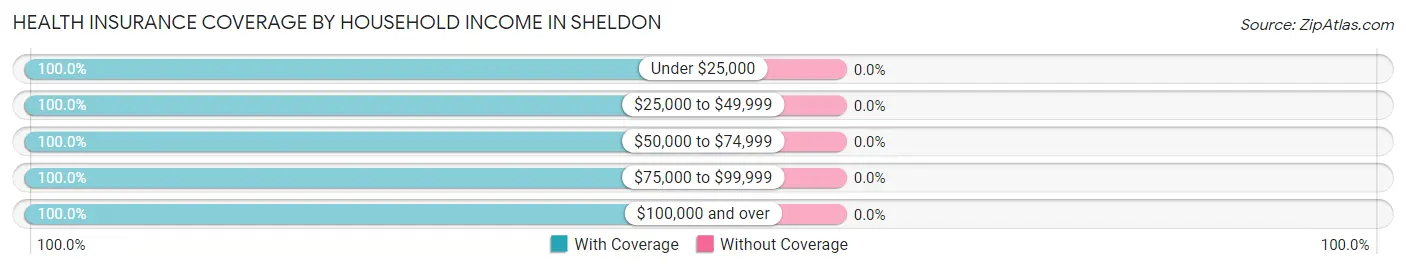
| Household Income | With Coverage | Without Coverage |
| Under $25,000 | 10 (100.0%) | 0 (0.0%) |
| $25,000 to $49,999 | 37 (100.0%) | 0 (0.0%) |
| $50,000 to $74,999 | 48 (100.0%) | 0 (0.0%) |
| $75,000 to $99,999 | 34 (100.0%) | 0 (0.0%) |
| $100,000 and over | 26 (100.0%) | 0 (0.0%) |
Public vs Private Health Insurance Coverage by Age in Sheldon
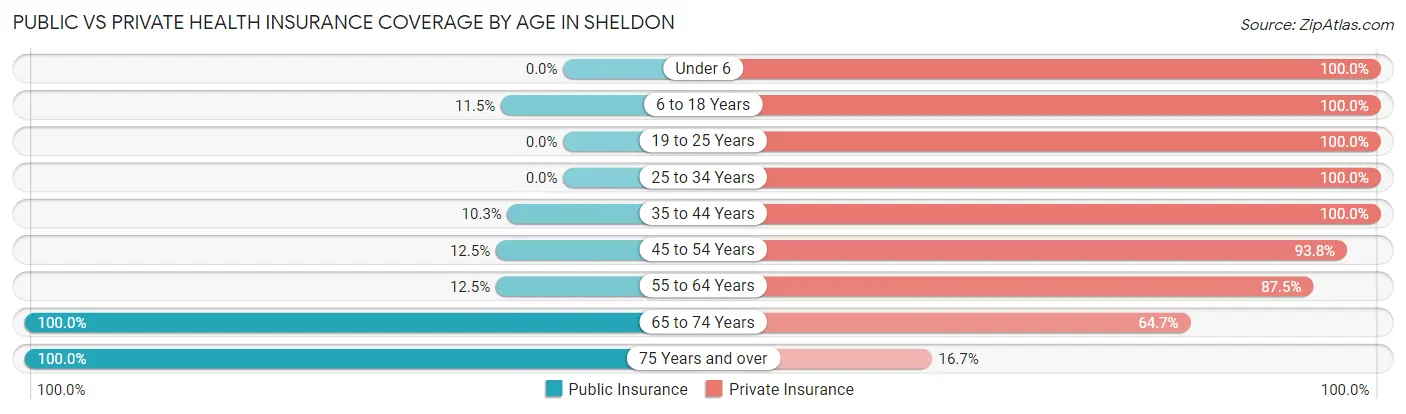
| Age Bracket | Public Insurance | Private Insurance |
| Under 6 | 0 (0.0%) | 16 (100.0%) |
| 6 to 18 Years | 3 (11.5%) | 26 (100.0%) |
| 19 to 25 Years | 0 (0.0%) | 3 (100.0%) |
| 25 to 34 Years | 0 (0.0%) | 18 (100.0%) |
| 35 to 44 Years | 3 (10.3%) | 29 (100.0%) |
| 45 to 54 Years | 4 (12.5%) | 30 (93.8%) |
| 55 to 64 Years | 1 (12.5%) | 7 (87.5%) |
| 65 to 74 Years | 17 (100.0%) | 11 (64.7%) |
| 75 Years and over | 6 (100.0%) | 1 (16.7%) |
| Total | 34 (21.9%) | 141 (91.0%) |
Disability Status by Sex by Age in Sheldon
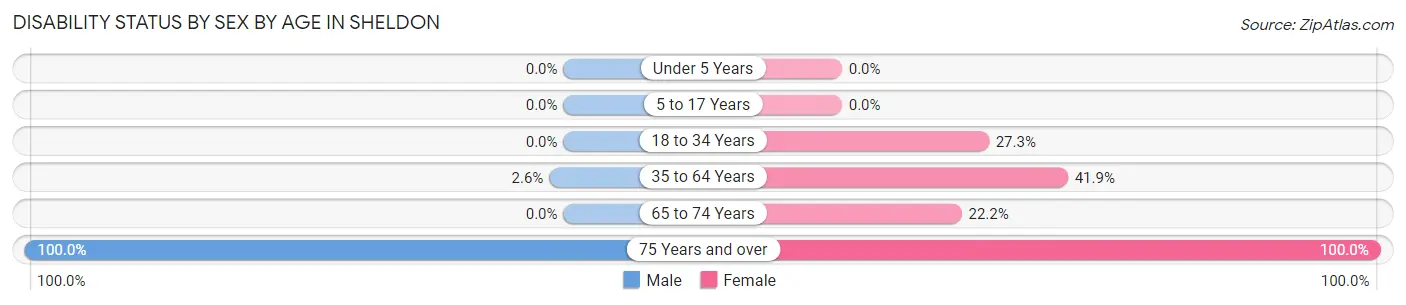
| Age Bracket | Male | Female |
| Under 5 Years | 0 (0.0%) | 0 (0.0%) |
| 5 to 17 Years | 0 (0.0%) | 0 (0.0%) |
| 18 to 34 Years | 0 (0.0%) | 3 (27.3%) |
| 35 to 64 Years | 1 (2.6%) | 13 (41.9%) |
| 65 to 74 Years | 0 (0.0%) | 2 (22.2%) |
| 75 Years and over | 3 (100.0%) | 3 (100.0%) |
Disability Class by Sex by Age in Sheldon
Disability Class: Hearing Difficulty
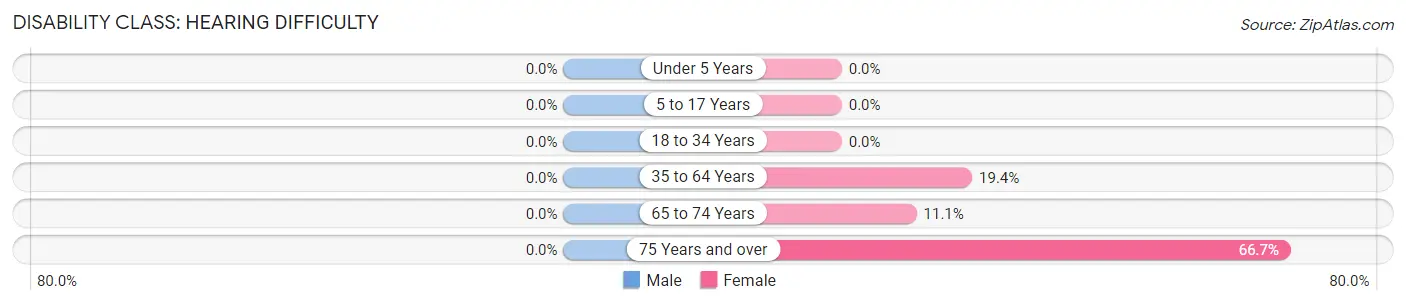
| Age Bracket | Male | Female |
| Under 5 Years | 0 (0.0%) | 0 (0.0%) |
| 5 to 17 Years | 0 (0.0%) | 0 (0.0%) |
| 18 to 34 Years | 0 (0.0%) | 0 (0.0%) |
| 35 to 64 Years | 0 (0.0%) | 6 (19.4%) |
| 65 to 74 Years | 0 (0.0%) | 1 (11.1%) |
| 75 Years and over | 0 (0.0%) | 2 (66.7%) |
Disability Class: Vision Difficulty
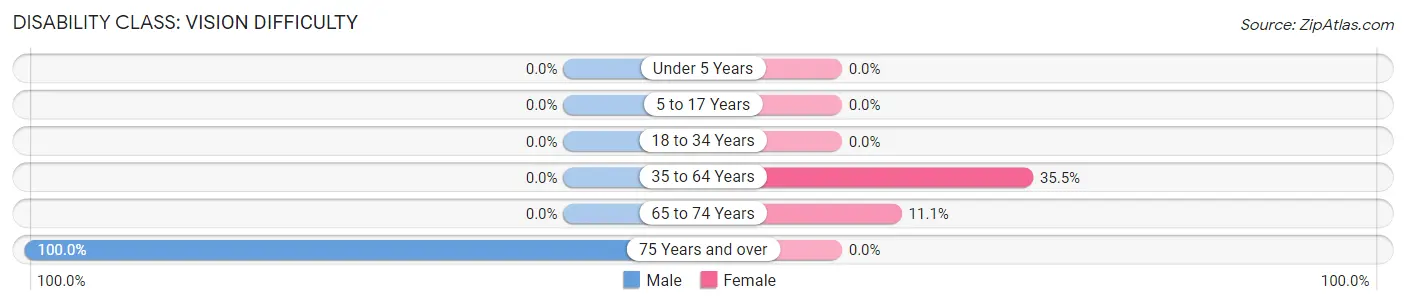
| Age Bracket | Male | Female |
| Under 5 Years | 0 (0.0%) | 0 (0.0%) |
| 5 to 17 Years | 0 (0.0%) | 0 (0.0%) |
| 18 to 34 Years | 0 (0.0%) | 0 (0.0%) |
| 35 to 64 Years | 0 (0.0%) | 11 (35.5%) |
| 65 to 74 Years | 0 (0.0%) | 1 (11.1%) |
| 75 Years and over | 3 (100.0%) | 0 (0.0%) |
Disability Class: Cognitive Difficulty
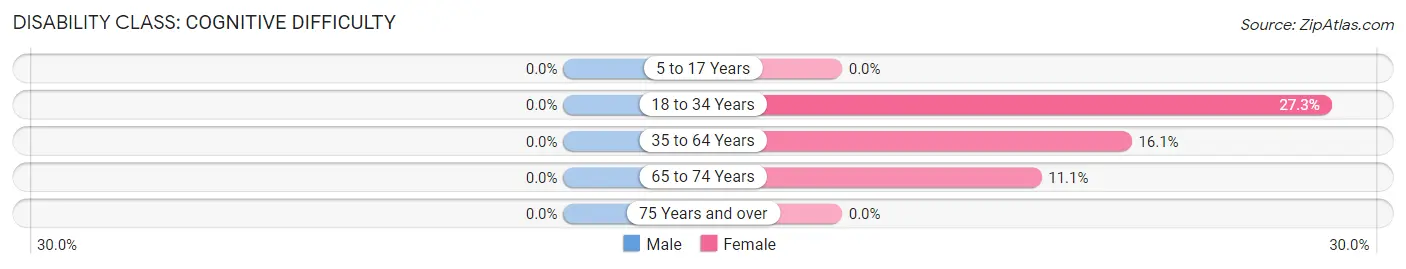
| Age Bracket | Male | Female |
| 5 to 17 Years | 0 (0.0%) | 0 (0.0%) |
| 18 to 34 Years | 0 (0.0%) | 3 (27.3%) |
| 35 to 64 Years | 0 (0.0%) | 5 (16.1%) |
| 65 to 74 Years | 0 (0.0%) | 1 (11.1%) |
| 75 Years and over | 0 (0.0%) | 0 (0.0%) |
Disability Class: Ambulatory Difficulty
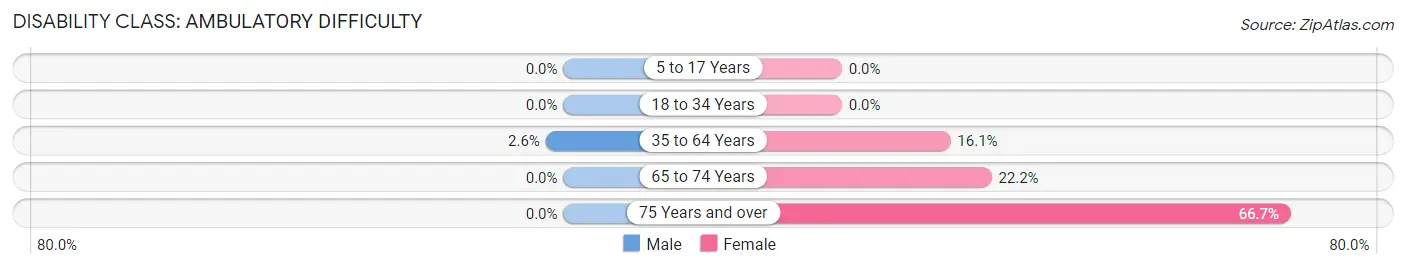
| Age Bracket | Male | Female |
| 5 to 17 Years | 0 (0.0%) | 0 (0.0%) |
| 18 to 34 Years | 0 (0.0%) | 0 (0.0%) |
| 35 to 64 Years | 1 (2.6%) | 5 (16.1%) |
| 65 to 74 Years | 0 (0.0%) | 2 (22.2%) |
| 75 Years and over | 0 (0.0%) | 2 (66.7%) |
Disability Class: Self-Care Difficulty
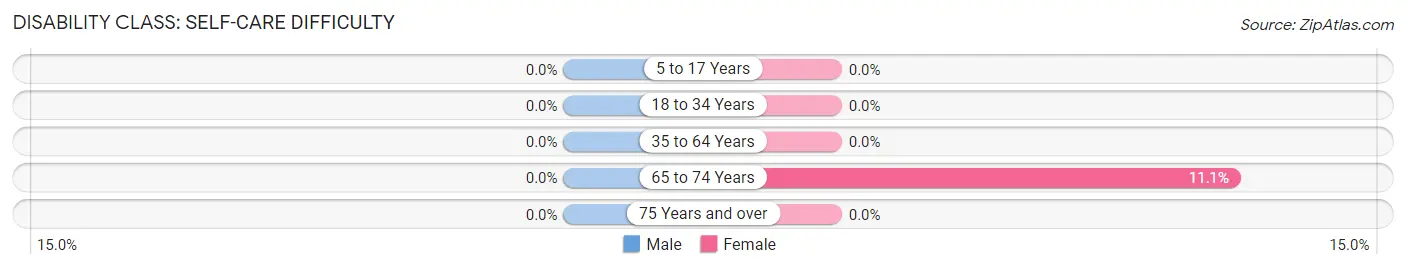
| Age Bracket | Male | Female |
| 5 to 17 Years | 0 (0.0%) | 0 (0.0%) |
| 18 to 34 Years | 0 (0.0%) | 0 (0.0%) |
| 35 to 64 Years | 0 (0.0%) | 0 (0.0%) |
| 65 to 74 Years | 0 (0.0%) | 1 (11.1%) |
| 75 Years and over | 0 (0.0%) | 0 (0.0%) |
Technology Access in Sheldon
Computing Device Access in Sheldon
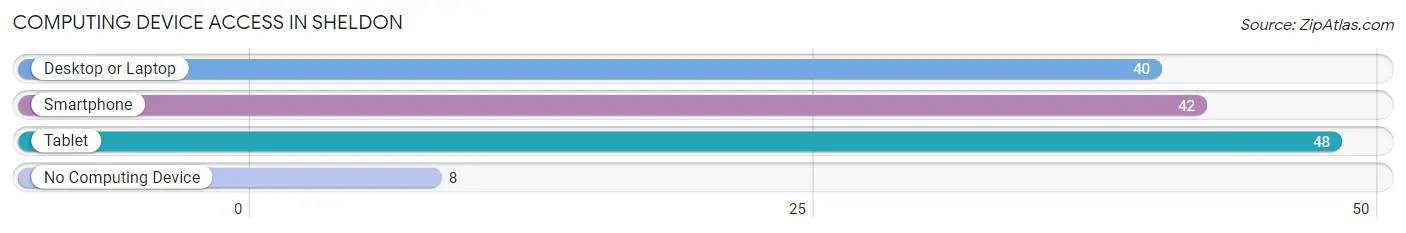
| Device Type | # Households | % Households |
| Desktop or Laptop | 40 | 64.5% |
| Smartphone | 42 | 67.7% |
| Tablet | 48 | 77.4% |
| No Computing Device | 8 | 12.9% |
| Total | 62 | 100.0% |
Internet Access in Sheldon
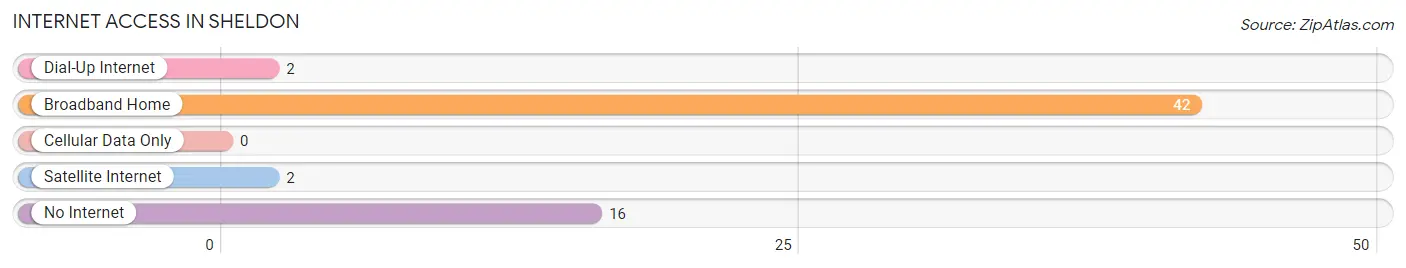
| Internet Type | # Households | % Households |
| Dial-Up Internet | 2 | 3.2% |
| Broadband Home | 42 | 67.7% |
| Cellular Data Only | 0 | 0.0% |
| Satellite Internet | 2 | 3.2% |
| No Internet | 16 | 25.8% |
| Total | 62 | 100.0% |
Sheldon Summary
Sheldon, North Dakota is a small town located in the southeastern corner of the state. It is situated in the heart of the Red River Valley, a region known for its rich agricultural heritage. The town was founded in 1883 and has a population of approximately 500 people.
Geographically, Sheldon is located in the Red River Valley, which is a flat, fertile plain that stretches from the Canadian border to the Minnesota border. The valley is bordered by the Red River of the North to the east and the Pembina River to the west. The area is known for its rich soil and abundant rainfall, making it ideal for farming and ranching. The town is situated on the banks of the Red River, and the surrounding area is characterized by rolling hills and prairies.
The economy of Sheldon is largely based on agriculture. The town is home to several large farms and ranches, as well as a number of smaller family-owned operations. The area is known for its production of wheat, corn, soybeans, and other grains. In addition, the town is home to a number of small businesses, including a grocery store, a hardware store, and a few restaurants.
Demographically, Sheldon is a predominantly white town. According to the 2010 census, the population was 97.3% white, 0.7% Native American, 0.3% Asian, and 0.7% other. The median household income in Sheldon is $41,250, and the median age is 44. The town is home to a number of churches, including the United Methodist Church, the Lutheran Church, and the Catholic Church.
Sheldon is a small town with a rich history and a strong sense of community. It is a place where people come together to celebrate their heritage and to enjoy the beauty of the Red River Valley. The town is a great place to live, work, and raise a family, and it is a great place to visit.
Common Questions
What is Per Capita Income in Sheldon?
Per Capita income in Sheldon is $25,849.
What is the Median Family Income in Sheldon?
Median Family Income in Sheldon is $55,833.
What is the Median Household income in Sheldon?
Median Household Income in Sheldon is $50,000.
What is Inequality or Gini Index in Sheldon?
Inequality or Gini Index in Sheldon is 0.35.
What is the Total Population of Sheldon?
Total Population of Sheldon is 155.
What is the Total Male Population of Sheldon?
Total Male Population of Sheldon is 93.
What is the Total Female Population of Sheldon?
Total Female Population of Sheldon is 62.
What is the Ratio of Males per 100 Females in Sheldon?
There are 150.00 Males per 100 Females in Sheldon.
What is the Ratio of Females per 100 Males in Sheldon?
There are 66.67 Females per 100 Males in Sheldon.
What is the Median Population Age in Sheldon?
Median Population Age in Sheldon is 38.9 Years.
What is the Average Family Size in Sheldon
Average Family Size in Sheldon is 3.2 People.
What is the Average Household Size in Sheldon
Average Household Size in Sheldon is 2.5 People.
How Large is the Labor Force in Sheldon?
There are 109 People in the Labor Forcein in Sheldon.
What is the Percentage of People in the Labor Force in Sheldon?
82.0% of People are in the Labor Force in Sheldon.
What is the Unemployment Rate in Sheldon?
Unemployment Rate in Sheldon is 2.8%.