New Rockford, ND Map & Demographics
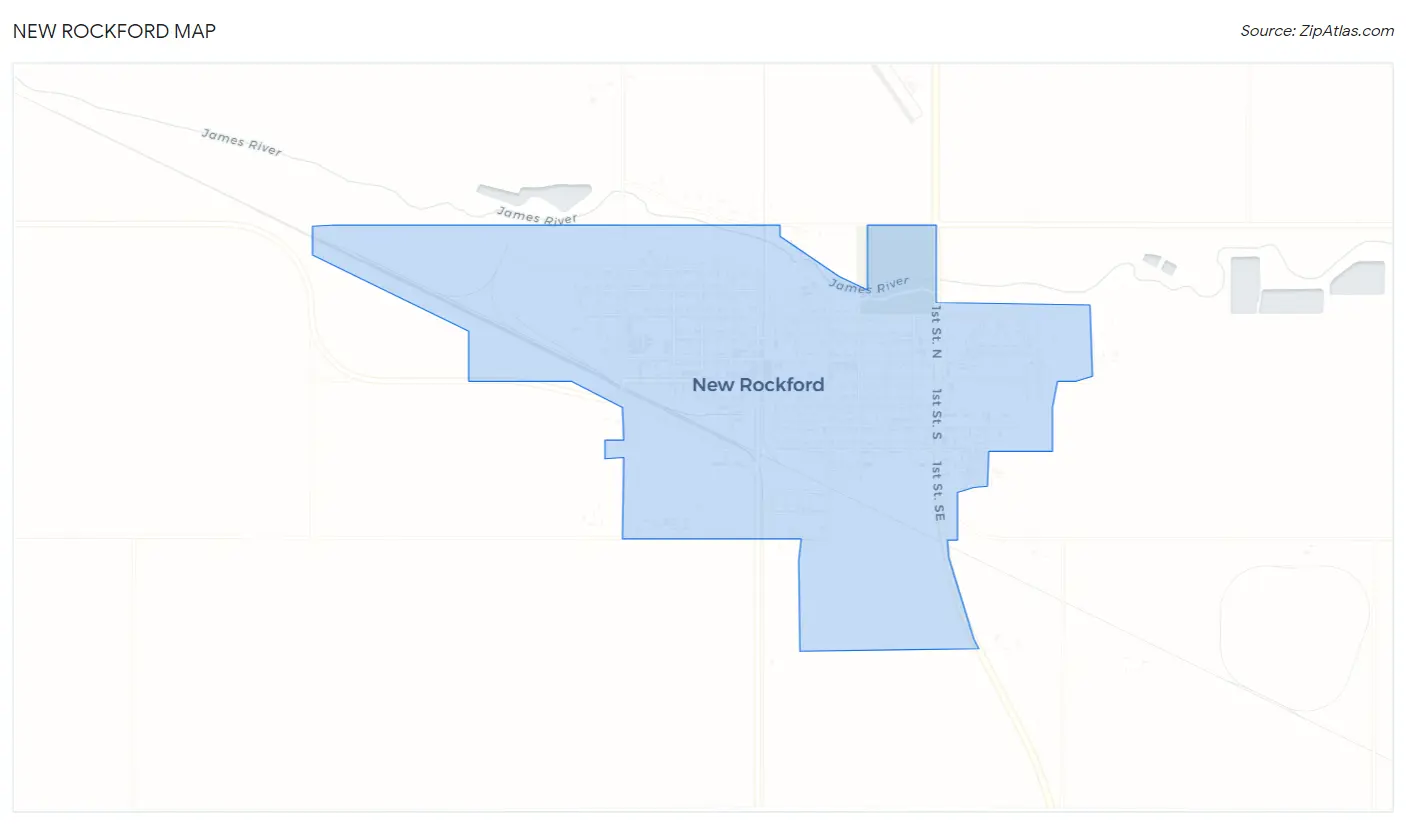
New Rockford Map
New Rockford Overview
$30,706
PER CAPITA INCOME
$75,625
AVG FAMILY INCOME
$38,393
AVG HOUSEHOLD INCOME
7.4%
WAGE / INCOME GAP [ % ]
92.6¢/ $1
WAGE / INCOME GAP [ $ ]
$12,265
FAMILY INCOME DEFICIT
0.45
INEQUALITY / GINI INDEX
1,421
TOTAL POPULATION
703
MALE POPULATION
718
FEMALE POPULATION
97.91
MALES / 100 FEMALES
102.13
FEMALES / 100 MALES
39.8
MEDIAN AGE
3.0
AVG FAMILY SIZE
2.0
AVG HOUSEHOLD SIZE
711
LABOR FORCE [ PEOPLE ]
61.6%
PERCENT IN LABOR FORCE
3.0%
UNEMPLOYMENT RATE
New Rockford Zip Codes
New Rockford Area Codes
Income in New Rockford
Income Overview in New Rockford
Per Capita Income in New Rockford is $30,706, while median incomes of families and households are $75,625 and $38,393 respectively.
| Characteristic | Number | Measure |
| Per Capita Income | 1,421 | $30,706 |
| Median Family Income | 295 | $75,625 |
| Mean Family Income | 295 | $87,743 |
| Median Household Income | 670 | $38,393 |
| Mean Household Income | 670 | $62,572 |
| Income Deficit | 295 | $12,265 |
| Wage / Income Gap (%) | 1,421 | 7.41% |
| Wage / Income Gap ($) | 1,421 | 92.59¢ per $1 |
| Gini / Inequality Index | 1,421 | 0.45 |
Earnings by Sex in New Rockford
Average Earnings in New Rockford are $35,565, $36,151 for men and $33,472 for women, a difference of 7.4%.
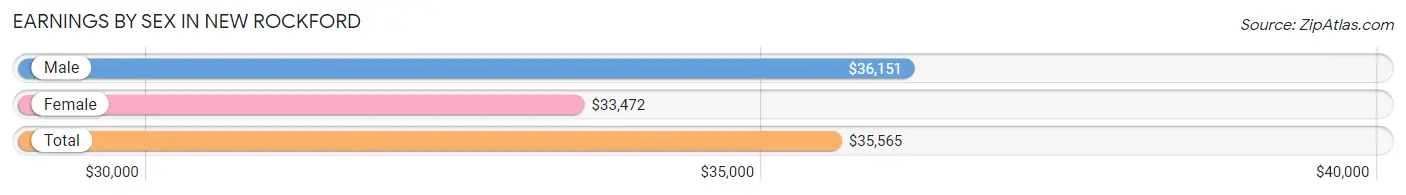
| Sex | Number | Average Earnings |
| Male | 414 (54.7%) | $36,151 |
| Female | 343 (45.3%) | $33,472 |
| Total | 757 (100.0%) | $35,565 |
Earnings by Sex by Income Bracket in New Rockford
The most common earnings brackets in New Rockford are $35,000 to $39,999 for men (63 | 15.2%) and $35,000 to $39,999 for women (51 | 14.9%).
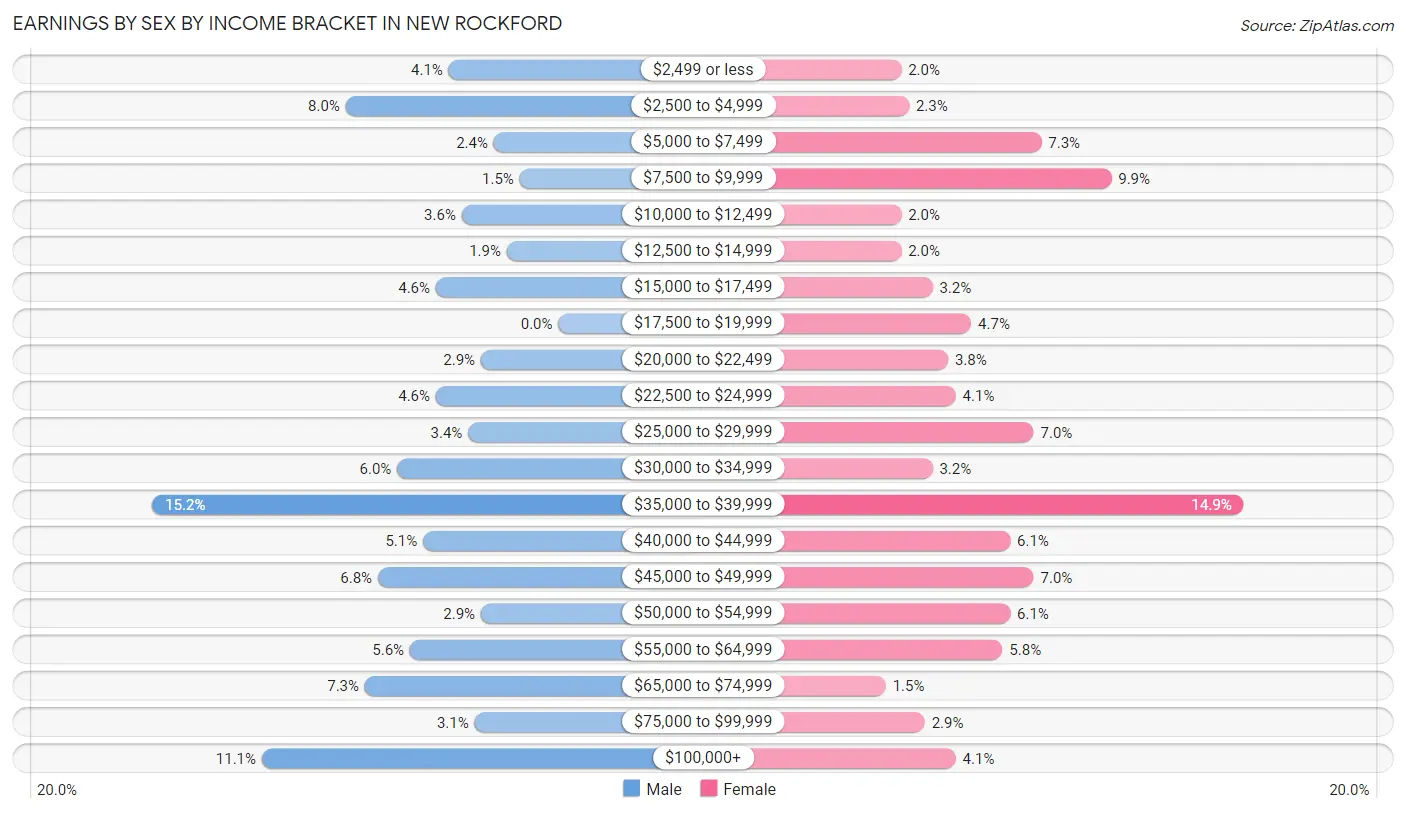
| Income | Male | Female |
| $2,499 or less | 17 (4.1%) | 7 (2.0%) |
| $2,500 to $4,999 | 33 (8.0%) | 8 (2.3%) |
| $5,000 to $7,499 | 10 (2.4%) | 25 (7.3%) |
| $7,500 to $9,999 | 6 (1.5%) | 34 (9.9%) |
| $10,000 to $12,499 | 15 (3.6%) | 7 (2.0%) |
| $12,500 to $14,999 | 8 (1.9%) | 7 (2.0%) |
| $15,000 to $17,499 | 19 (4.6%) | 11 (3.2%) |
| $17,500 to $19,999 | 0 (0.0%) | 16 (4.7%) |
| $20,000 to $22,499 | 12 (2.9%) | 13 (3.8%) |
| $22,500 to $24,999 | 19 (4.6%) | 14 (4.1%) |
| $25,000 to $29,999 | 14 (3.4%) | 24 (7.0%) |
| $30,000 to $34,999 | 25 (6.0%) | 11 (3.2%) |
| $35,000 to $39,999 | 63 (15.2%) | 51 (14.9%) |
| $40,000 to $44,999 | 21 (5.1%) | 21 (6.1%) |
| $45,000 to $49,999 | 28 (6.8%) | 24 (7.0%) |
| $50,000 to $54,999 | 12 (2.9%) | 21 (6.1%) |
| $55,000 to $64,999 | 23 (5.6%) | 20 (5.8%) |
| $65,000 to $74,999 | 30 (7.2%) | 5 (1.5%) |
| $75,000 to $99,999 | 13 (3.1%) | 10 (2.9%) |
| $100,000+ | 46 (11.1%) | 14 (4.1%) |
| Total | 414 (100.0%) | 343 (100.0%) |
Earnings by Sex by Educational Attainment in New Rockford
Average earnings in New Rockford are $37,188 for men and $35,368 for women, a difference of 4.9%. Men with an educational attainment of bachelor's degree enjoy the highest average annual earnings of $69,167, while those with less than high school education earn the least with $23,947. Women with an educational attainment of graduate degree earn the most with the average annual earnings of $51,346, while those with college or associate's degree education have the smallest earnings of $24,375.
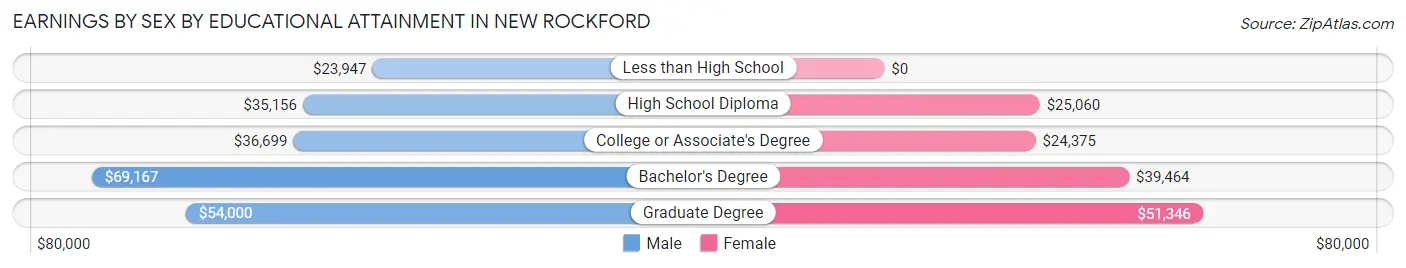
| Educational Attainment | Male Income | Female Income |
| Less than High School | $23,947 | $0 |
| High School Diploma | $35,156 | $25,060 |
| College or Associate's Degree | $36,699 | $24,375 |
| Bachelor's Degree | $69,167 | $39,464 |
| Graduate Degree | $54,000 | $51,346 |
| Total | $37,188 | $35,368 |
Family Income in New Rockford
Family Income Brackets in New Rockford
According to the New Rockford family income data, there are 64 families falling into the $100,000 to $149,999 income range, which is the most common income bracket and makes up 21.7% of all families. Conversely, the $10,000 to $14,999 income bracket is the least frequent group with only 2 families (0.7%) belonging to this category.
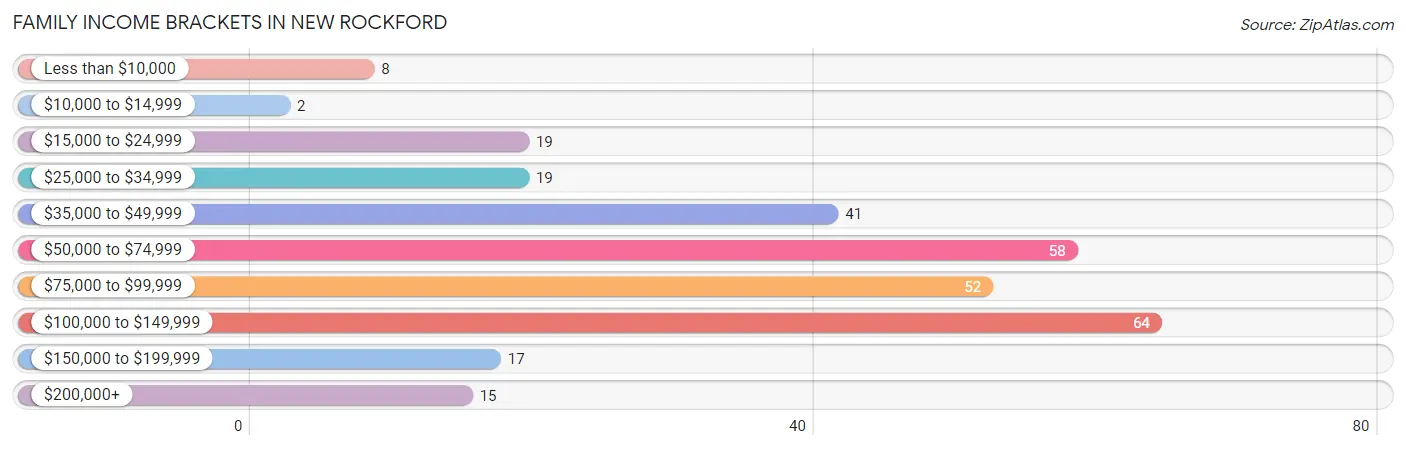
| Income Bracket | # Families | % Families |
| Less than $10,000 | 8 | 2.7% |
| $10,000 to $14,999 | 2 | 0.7% |
| $15,000 to $24,999 | 19 | 6.4% |
| $25,000 to $34,999 | 19 | 6.4% |
| $35,000 to $49,999 | 41 | 13.9% |
| $50,000 to $74,999 | 58 | 19.7% |
| $75,000 to $99,999 | 52 | 17.6% |
| $100,000 to $149,999 | 64 | 21.7% |
| $150,000 to $199,999 | 17 | 5.8% |
| $200,000+ | 15 | 5.1% |
Family Income by Famaliy Size in New Rockford
4-person families (50 | 17.0%) account for the highest median family income in New Rockford with $97,857 per family, while 2-person families (151 | 51.2%) have the highest median income of $31,979 per family member.
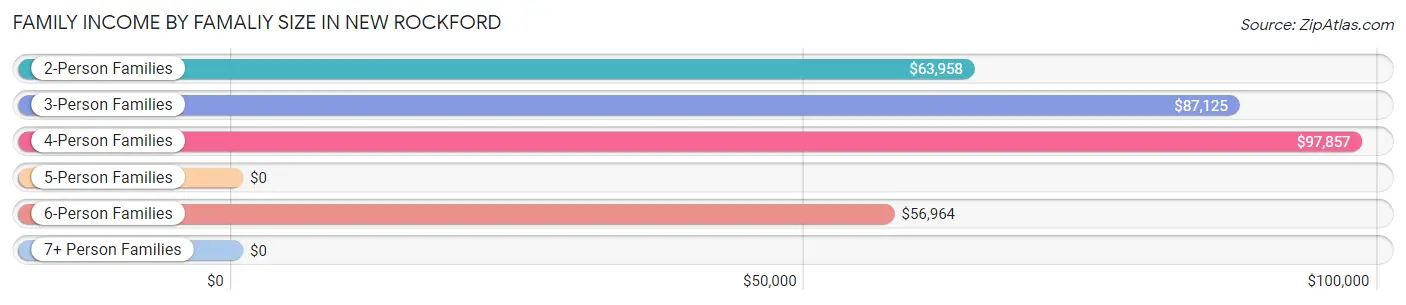
| Income Bracket | # Families | Median Income |
| 2-Person Families | 151 (51.2%) | $63,958 |
| 3-Person Families | 63 (21.4%) | $87,125 |
| 4-Person Families | 50 (17.0%) | $97,857 |
| 5-Person Families | 6 (2.0%) | $0 |
| 6-Person Families | 25 (8.5%) | $56,964 |
| 7+ Person Families | 0 (0.0%) | $0 |
| Total | 295 (100.0%) | $75,625 |
Family Income by Number of Earners in New Rockford
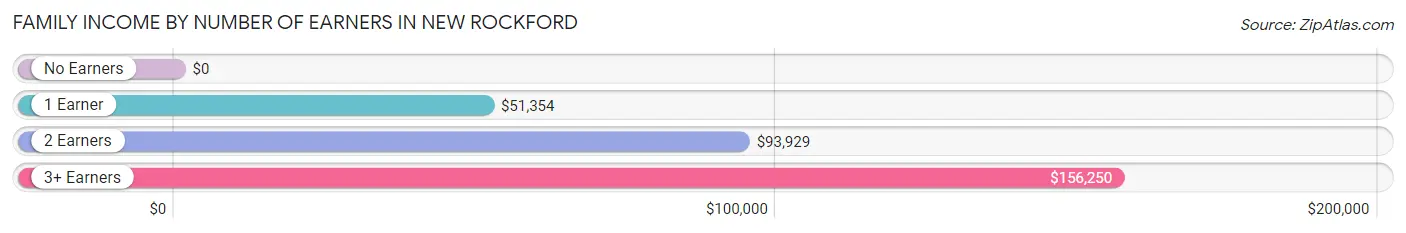
| Number of Earners | # Families | Median Income |
| No Earners | 44 (14.9%) | $0 |
| 1 Earner | 71 (24.1%) | $51,354 |
| 2 Earners | 146 (49.5%) | $93,929 |
| 3+ Earners | 34 (11.5%) | $156,250 |
| Total | 295 (100.0%) | $75,625 |
Household Income in New Rockford
Household Income Brackets in New Rockford
With 135 households falling in the category, the $35,000 to $49,999 income range is the most frequent in New Rockford, accounting for 20.2% of all households. In contrast, only 11 households (1.6%) fall into the $10,000 to $14,999 income bracket, making it the least populous group.
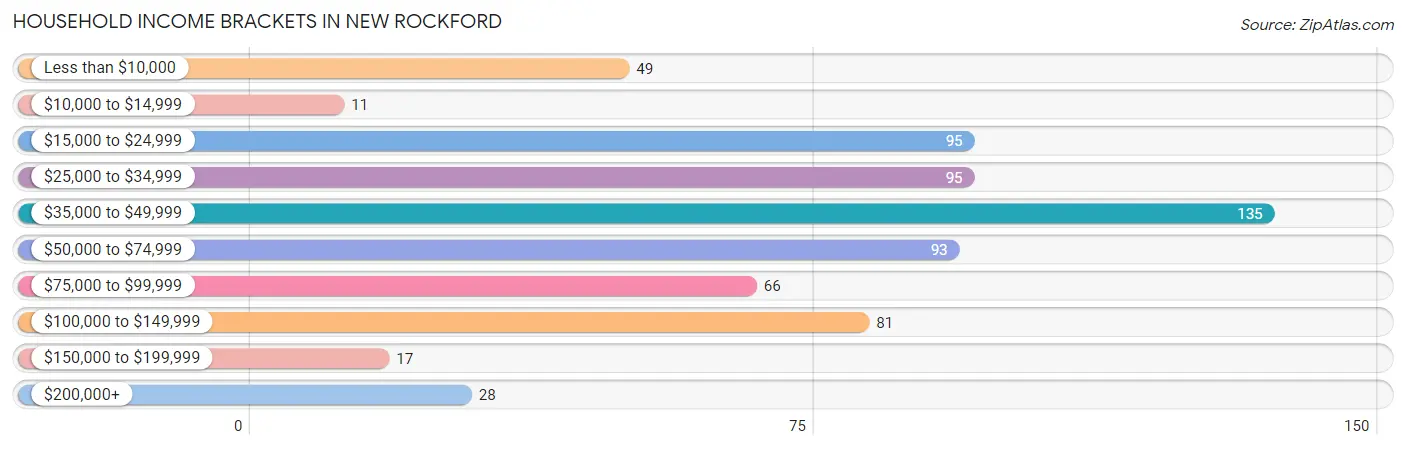
| Income Bracket | # Households | % Households |
| Less than $10,000 | 49 | 7.3% |
| $10,000 to $14,999 | 11 | 1.6% |
| $15,000 to $24,999 | 95 | 14.2% |
| $25,000 to $34,999 | 95 | 14.2% |
| $35,000 to $49,999 | 135 | 20.1% |
| $50,000 to $74,999 | 93 | 13.9% |
| $75,000 to $99,999 | 66 | 9.9% |
| $100,000 to $149,999 | 81 | 12.1% |
| $150,000 to $199,999 | 17 | 2.5% |
| $200,000+ | 28 | 4.2% |
Household Income by Householder Age in New Rockford
The median household income in New Rockford is $38,393, with the highest median household income of $79,500 found in the 45 to 64 years age bracket for the primary householder. A total of 128 households (19.1%) fall into this category. Meanwhile, the 15 to 24 years age bracket for the primary householder has the lowest median household income of $0, with 41 households (6.1%) in this group.
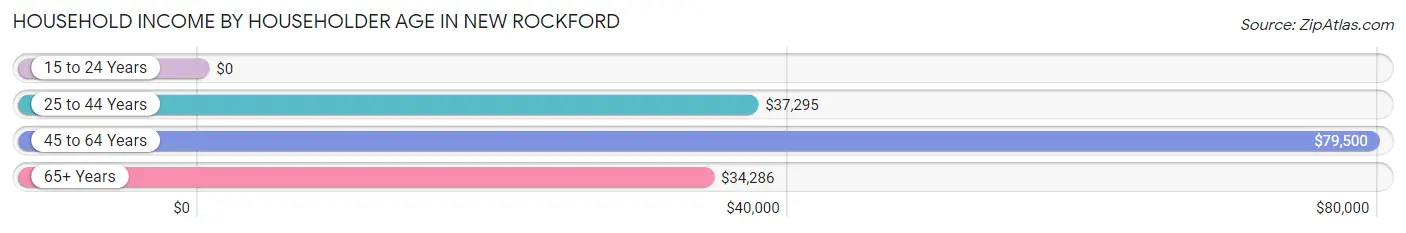
| Income Bracket | # Households | Median Income |
| 15 to 24 Years | 41 (6.1%) | $0 |
| 25 to 44 Years | 241 (36.0%) | $37,295 |
| 45 to 64 Years | 128 (19.1%) | $79,500 |
| 65+ Years | 260 (38.8%) | $34,286 |
| Total | 670 (100.0%) | $38,393 |
Poverty in New Rockford
Income Below Poverty by Sex and Age in New Rockford
With 6.5% poverty level for males and 15.3% for females among the residents of New Rockford, 16 and 17 year old males and 18 to 24 year old females are the most vulnerable to poverty, with 9 males (22.5%) and 40 females (67.8%) in their respective age groups living below the poverty level.
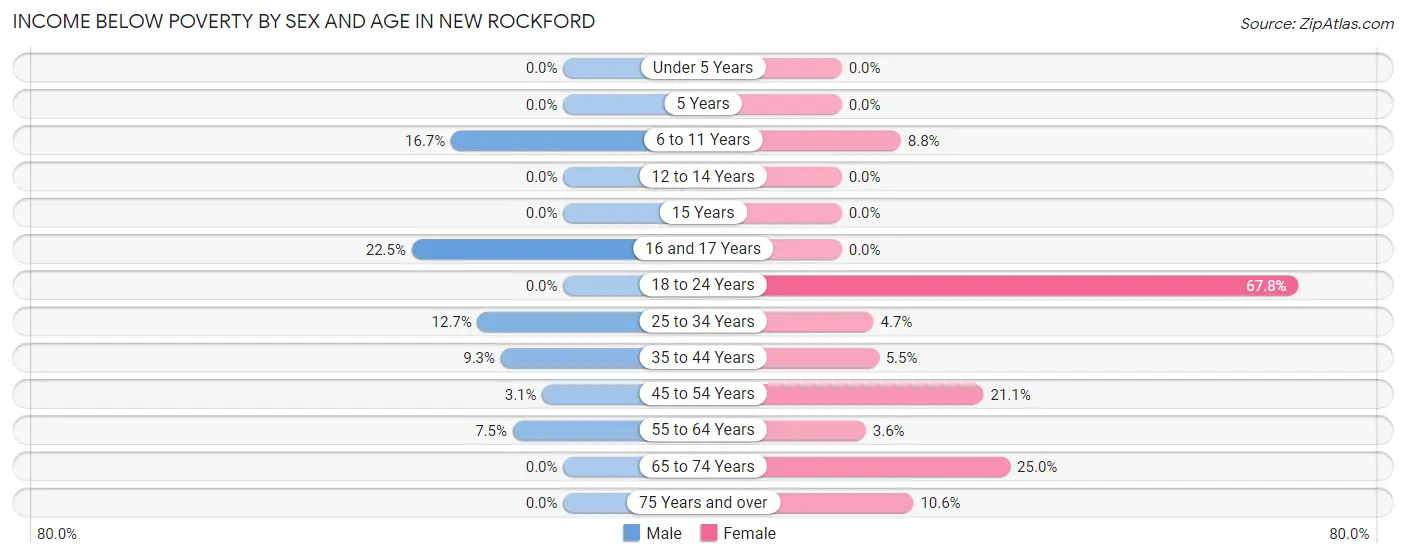
| Age Bracket | Male | Female |
| Under 5 Years | 0 (0.0%) | 0 (0.0%) |
| 5 Years | 0 (0.0%) | 0 (0.0%) |
| 6 to 11 Years | 6 (16.7%) | 5 (8.8%) |
| 12 to 14 Years | 0 (0.0%) | 0 (0.0%) |
| 15 Years | 0 (0.0%) | 0 (0.0%) |
| 16 and 17 Years | 9 (22.5%) | 0 (0.0%) |
| 18 to 24 Years | 0 (0.0%) | 40 (67.8%) |
| 25 to 34 Years | 14 (12.7%) | 4 (4.7%) |
| 35 to 44 Years | 9 (9.3%) | 4 (5.5%) |
| 45 to 54 Years | 2 (3.1%) | 16 (21.0%) |
| 55 to 64 Years | 3 (7.5%) | 2 (3.6%) |
| 65 to 74 Years | 0 (0.0%) | 21 (25.0%) |
| 75 Years and over | 0 (0.0%) | 10 (10.6%) |
| Total | 43 (6.5%) | 102 (15.3%) |
Income Above Poverty by Sex and Age in New Rockford
According to the poverty statistics in New Rockford, males aged under 5 years and females aged under 5 years are the age groups that are most secure financially, with 100.0% of males and 100.0% of females in these age groups living above the poverty line.
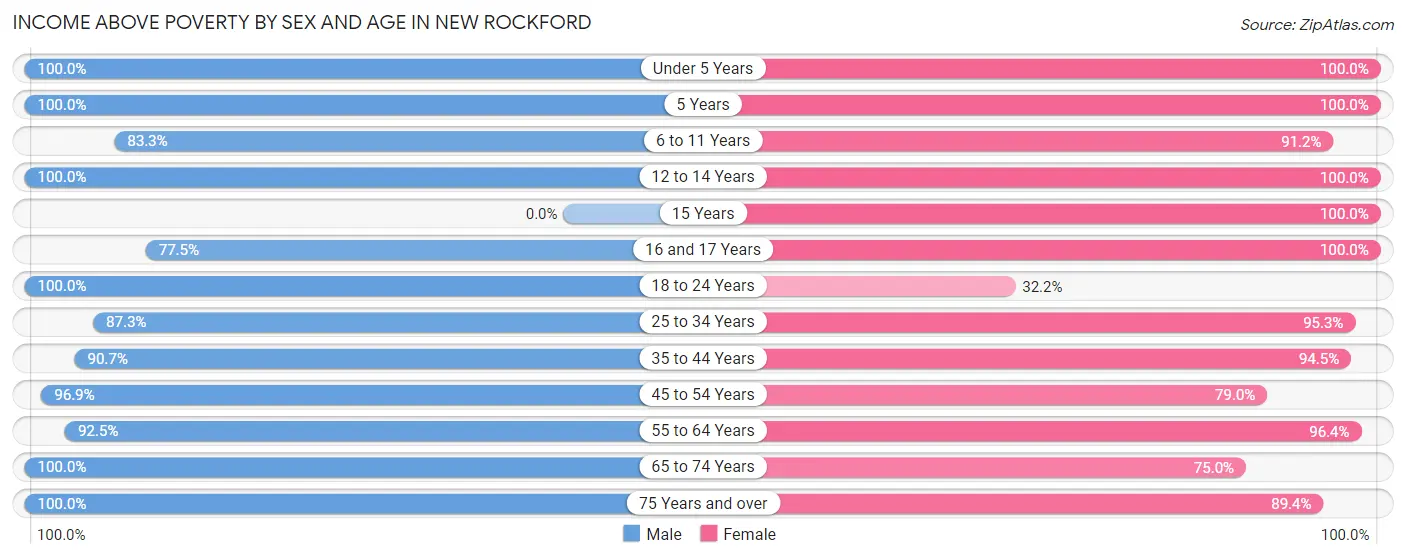
| Age Bracket | Male | Female |
| Under 5 Years | 58 (100.0%) | 49 (100.0%) |
| 5 Years | 5 (100.0%) | 12 (100.0%) |
| 6 to 11 Years | 30 (83.3%) | 52 (91.2%) |
| 12 to 14 Years | 16 (100.0%) | 7 (100.0%) |
| 15 Years | 0 (0.0%) | 11 (100.0%) |
| 16 and 17 Years | 31 (77.5%) | 2 (100.0%) |
| 18 to 24 Years | 43 (100.0%) | 19 (32.2%) |
| 25 to 34 Years | 96 (87.3%) | 81 (95.3%) |
| 35 to 44 Years | 88 (90.7%) | 69 (94.5%) |
| 45 to 54 Years | 62 (96.9%) | 60 (78.9%) |
| 55 to 64 Years | 37 (92.5%) | 54 (96.4%) |
| 65 to 74 Years | 79 (100.0%) | 63 (75.0%) |
| 75 Years and over | 75 (100.0%) | 84 (89.4%) |
| Total | 620 (93.5%) | 563 (84.7%) |
Income Below Poverty Among Married-Couple Families in New Rockford
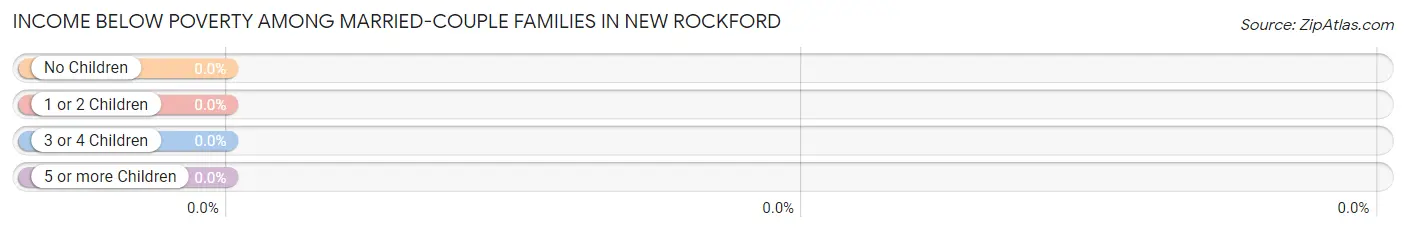
| Children | Above Poverty | Below Poverty |
| No Children | 133 (100.0%) | 0 (0.0%) |
| 1 or 2 Children | 84 (100.0%) | 0 (0.0%) |
| 3 or 4 Children | 31 (100.0%) | 0 (0.0%) |
| 5 or more Children | 0 (0.0%) | 0 (0.0%) |
| Total | 248 (100.0%) | 0 (0.0%) |
Income Below Poverty Among Single-Parent Households in New Rockford
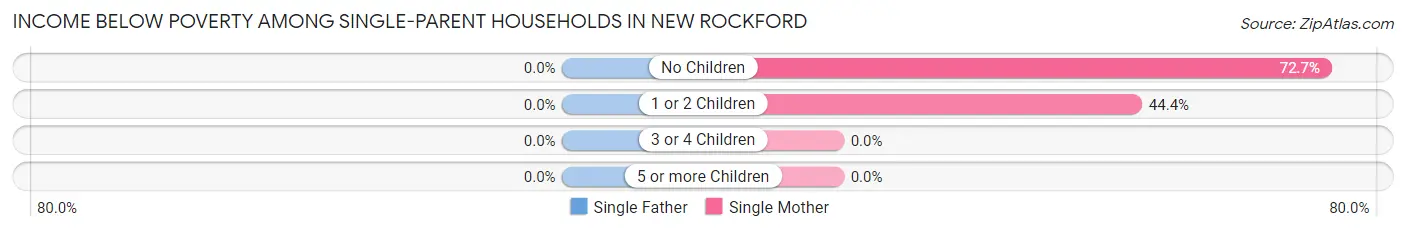
| Children | Single Father | Single Mother |
| No Children | 0 (0.0%) | 8 (72.7%) |
| 1 or 2 Children | 0 (0.0%) | 12 (44.4%) |
| 3 or 4 Children | 0 (0.0%) | 0 (0.0%) |
| 5 or more Children | 0 (0.0%) | 0 (0.0%) |
| Total | 0 (0.0%) | 20 (52.6%) |
Income Below Poverty Among Married-Couple vs Single-Parent Households in New Rockford
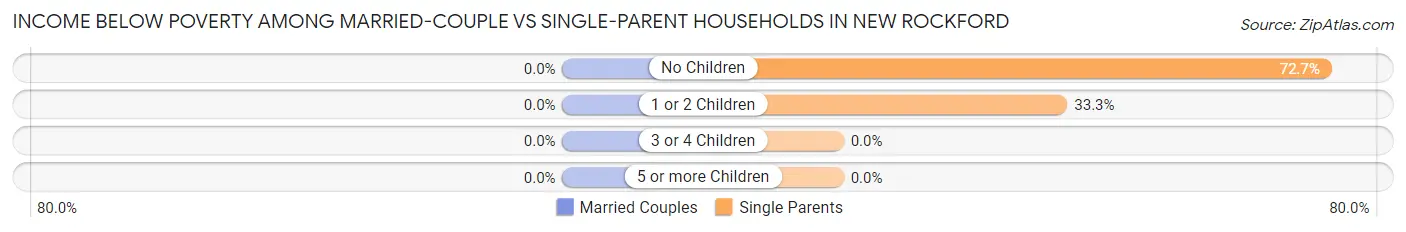
| Children | Married-Couple Families | Single-Parent Households |
| No Children | 0 (0.0%) | 8 (72.7%) |
| 1 or 2 Children | 0 (0.0%) | 12 (33.3%) |
| 3 or 4 Children | 0 (0.0%) | 0 (0.0%) |
| 5 or more Children | 0 (0.0%) | 0 (0.0%) |
| Total | 0 (0.0%) | 20 (42.5%) |
Race in New Rockford
The most populous races in New Rockford are White / Caucasian (1,309 | 92.1%), Two or more Races (69 | 4.9%), and Hispanic or Latino (63 | 4.4%).
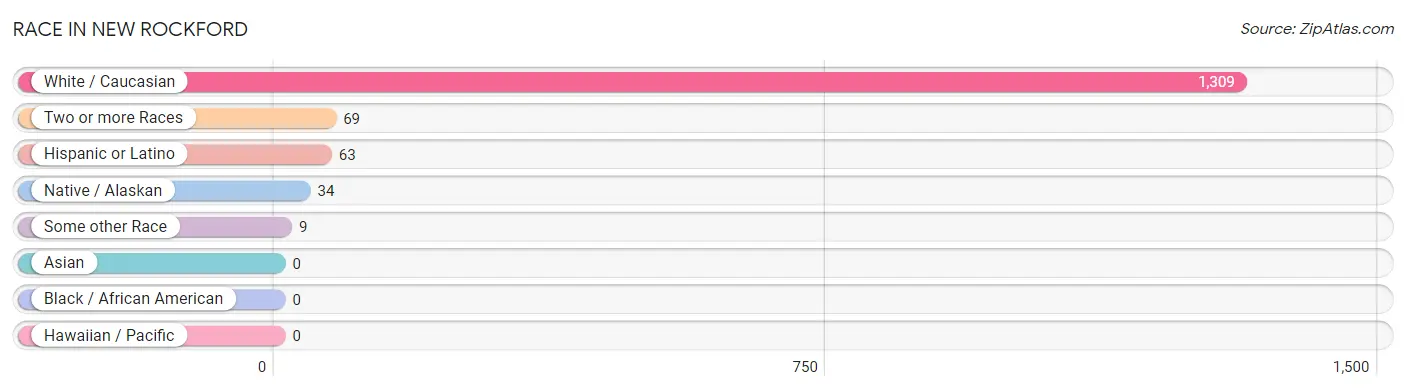
| Race | # Population | % Population |
| Asian | 0 | 0.0% |
| Black / African American | 0 | 0.0% |
| Hawaiian / Pacific | 0 | 0.0% |
| Hispanic or Latino | 63 | 4.4% |
| Native / Alaskan | 34 | 2.4% |
| White / Caucasian | 1,309 | 92.1% |
| Two or more Races | 69 | 4.9% |
| Some other Race | 9 | 0.6% |
| Total | 1,421 | 100.0% |
Ancestry in New Rockford
The most populous ancestries reported in New Rockford are German (670 | 47.1%), Norwegian (418 | 29.4%), Irish (165 | 11.6%), English (80 | 5.6%), and American (69 | 4.9%), together accounting for 98.7% of all New Rockford residents.
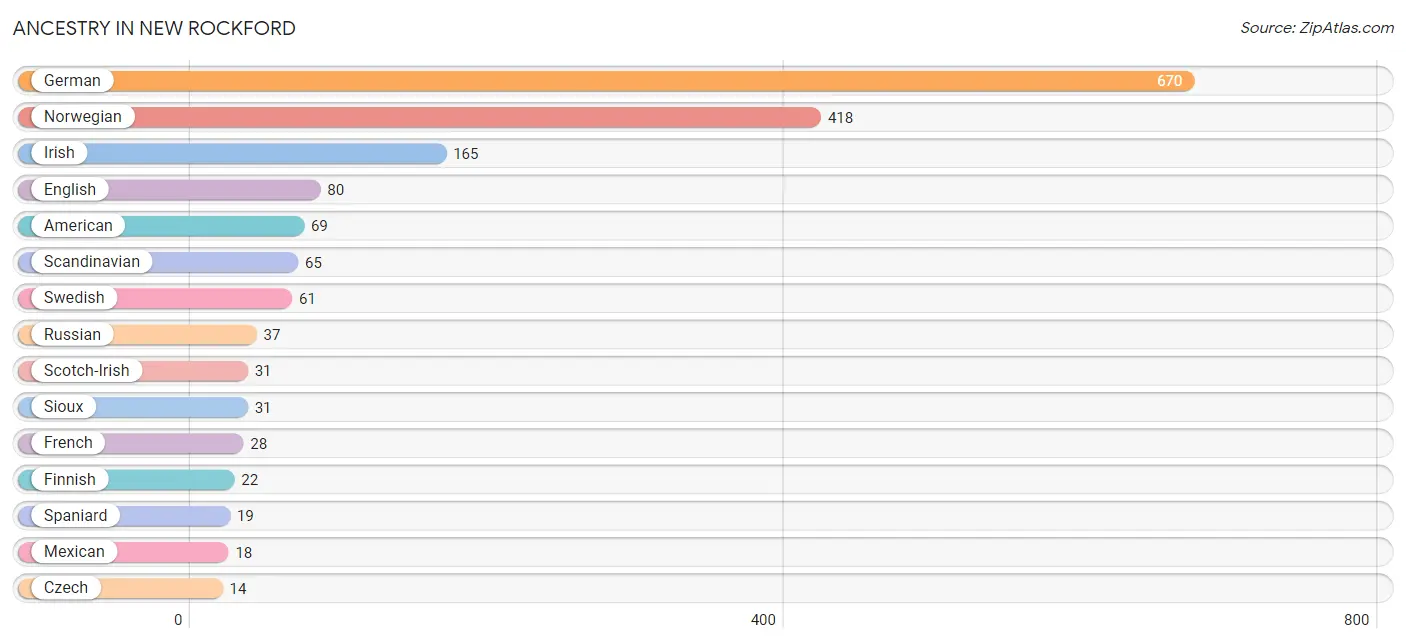
| Ancestry | # Population | % Population |
| American | 69 | 4.9% |
| British | 12 | 0.8% |
| Chippewa | 7 | 0.5% |
| Colombian | 11 | 0.8% |
| Czech | 14 | 1.0% |
| Danish | 2 | 0.1% |
| Dominican | 3 | 0.2% |
| Dutch | 7 | 0.5% |
| Eastern European | 5 | 0.4% |
| English | 80 | 5.6% |
| European | 10 | 0.7% |
| Finnish | 22 | 1.5% |
| French | 28 | 2.0% |
| German | 670 | 47.1% |
| German Russian | 3 | 0.2% |
| Irish | 165 | 11.6% |
| Italian | 5 | 0.4% |
| Luxembourger | 2 | 0.1% |
| Mexican | 18 | 1.3% |
| Norwegian | 418 | 29.4% |
| Polish | 2 | 0.1% |
| Portuguese | 9 | 0.6% |
| Russian | 37 | 2.6% |
| Scandinavian | 65 | 4.6% |
| Scotch-Irish | 31 | 2.2% |
| Scottish | 9 | 0.6% |
| Sioux | 31 | 2.2% |
| South American | 11 | 0.8% |
| Spaniard | 19 | 1.3% |
| Spanish | 12 | 0.8% |
| Swedish | 61 | 4.3% |
| Swiss | 8 | 0.6% |
| Welsh | 12 | 0.8% | View All 33 Rows |
Immigrants in New Rockford
The most numerous immigrant groups reported in New Rockford came from Colombia (11 | 0.8%), Latin America (11 | 0.8%), and South America (11 | 0.8%), together accounting for 2.3% of all New Rockford residents.
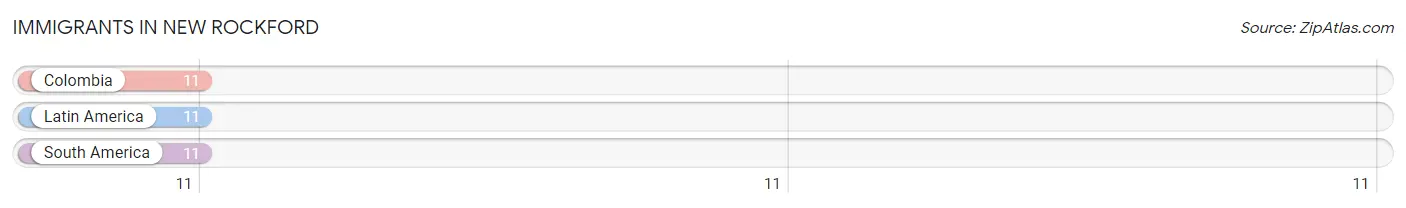
| Immigration Origin | # Population | % Population |
| Colombia | 11 | 0.8% |
| Latin America | 11 | 0.8% |
| South America | 11 | 0.8% | View All 3 Rows |
Sex and Age in New Rockford
Sex and Age in New Rockford
The most populous age groups in New Rockford are 25 to 29 Years (78 | 11.1%) for men and 25 to 29 Years (61 | 8.5%) for women.
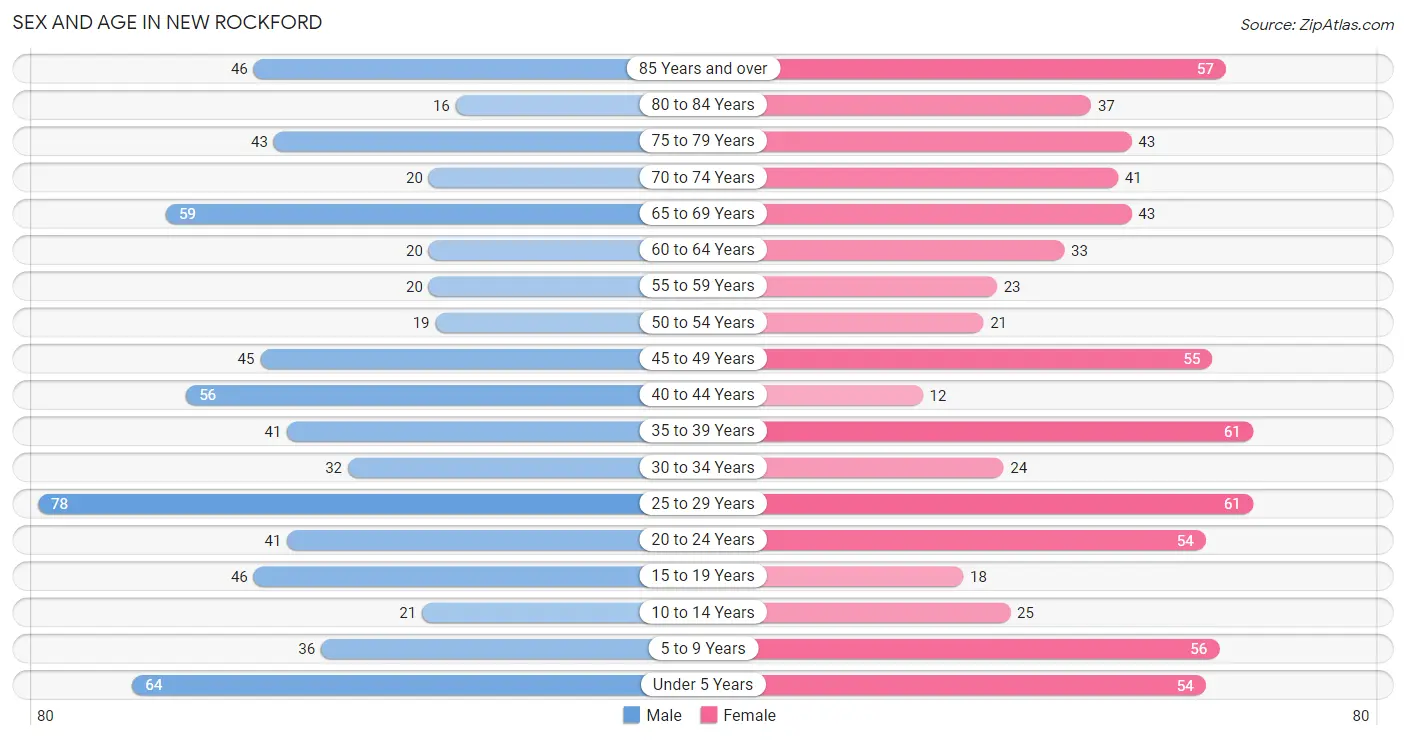
| Age Bracket | Male | Female |
| Under 5 Years | 64 (9.1%) | 54 (7.5%) |
| 5 to 9 Years | 36 (5.1%) | 56 (7.8%) |
| 10 to 14 Years | 21 (3.0%) | 25 (3.5%) |
| 15 to 19 Years | 46 (6.5%) | 18 (2.5%) |
| 20 to 24 Years | 41 (5.8%) | 54 (7.5%) |
| 25 to 29 Years | 78 (11.1%) | 61 (8.5%) |
| 30 to 34 Years | 32 (4.5%) | 24 (3.3%) |
| 35 to 39 Years | 41 (5.8%) | 61 (8.5%) |
| 40 to 44 Years | 56 (8.0%) | 12 (1.7%) |
| 45 to 49 Years | 45 (6.4%) | 55 (7.7%) |
| 50 to 54 Years | 19 (2.7%) | 21 (2.9%) |
| 55 to 59 Years | 20 (2.8%) | 23 (3.2%) |
| 60 to 64 Years | 20 (2.8%) | 33 (4.6%) |
| 65 to 69 Years | 59 (8.4%) | 43 (6.0%) |
| 70 to 74 Years | 20 (2.8%) | 41 (5.7%) |
| 75 to 79 Years | 43 (6.1%) | 43 (6.0%) |
| 80 to 84 Years | 16 (2.3%) | 37 (5.1%) |
| 85 Years and over | 46 (6.5%) | 57 (7.9%) |
| Total | 703 (100.0%) | 718 (100.0%) |
Families and Households in New Rockford
Median Family Size in New Rockford
The median family size in New Rockford is 3.03 persons per family, with married-couple families (248 | 84.1%) accounting for the largest median family size of 3.09 persons per family. On the other hand, single male/father families (9 | 3.0%) represent the smallest median family size with 2.33 persons per family.
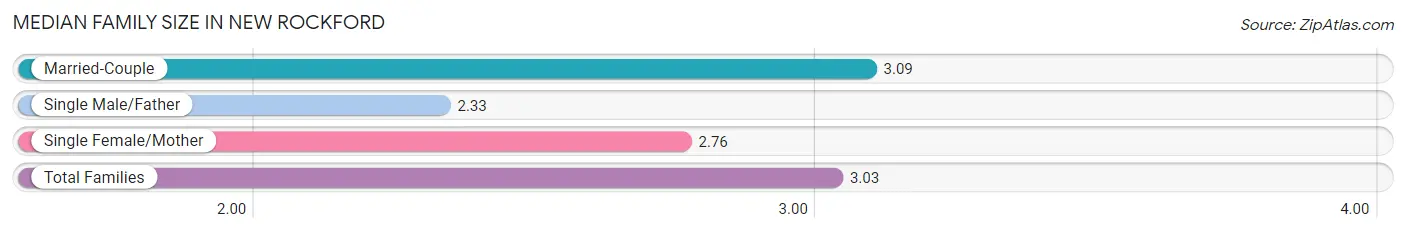
| Family Type | # Families | Family Size |
| Married-Couple | 248 (84.1%) | 3.09 |
| Single Male/Father | 9 (3.0%) | 2.33 |
| Single Female/Mother | 38 (12.9%) | 2.76 |
| Total Families | 295 (100.0%) | 3.03 |
Median Household Size in New Rockford
The median household size in New Rockford is 1.98 persons per household, with married-couple households (248 | 37.0%) accounting for the largest median household size of 3.11 persons per household. non-family households (375 | 56.0%) represent the smallest median household size with 1.11 persons per household.
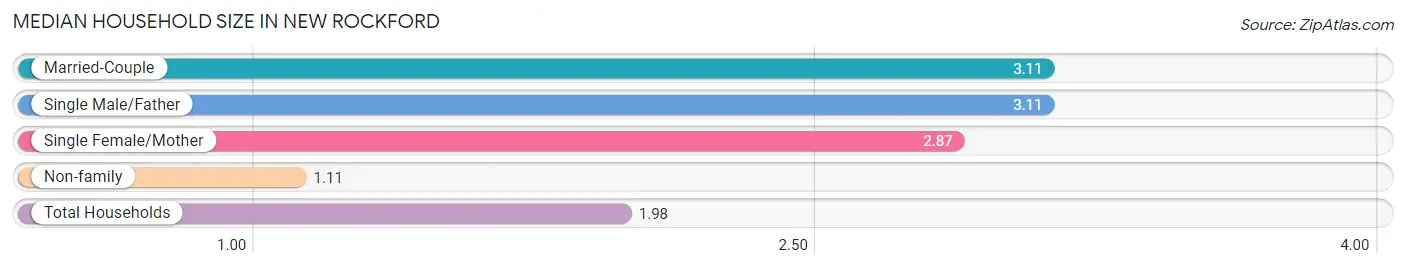
| Household Type | # Households | Household Size |
| Married-Couple | 248 (37.0%) | 3.11 |
| Single Male/Father | 9 (1.3%) | 3.11 |
| Single Female/Mother | 38 (5.7%) | 2.87 |
| Non-family | 375 (56.0%) | 1.11 |
| Total Households | 670 (100.0%) | 1.98 |
Household Size by Marriage Status in New Rockford
Out of a total of 670 households in New Rockford, 295 (44.0%) are family households, while 375 (56.0%) are nonfamily households. The most numerous type of family households are 2-person households, comprising 150, and the most common type of nonfamily households are 1-person households, comprising 344.
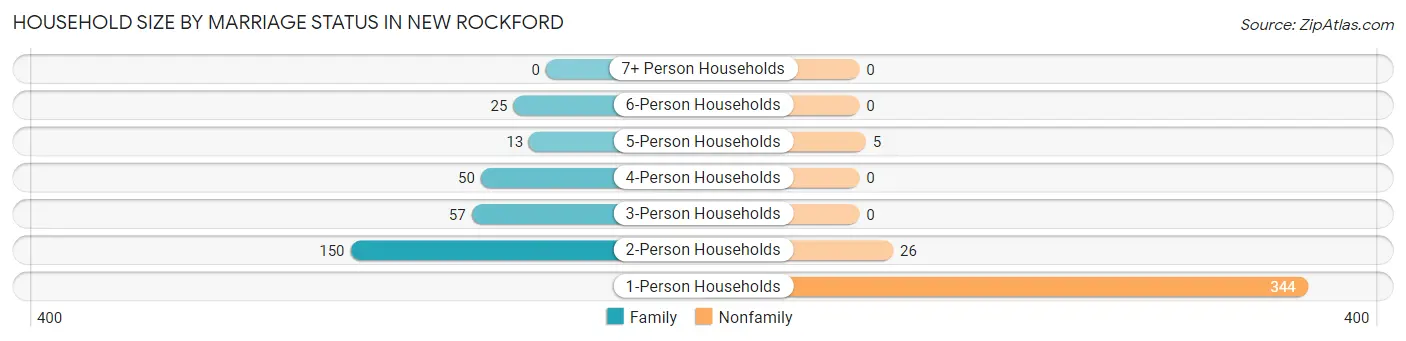
| Household Size | Family Households | Nonfamily Households |
| 1-Person Households | - | 344 (51.3%) |
| 2-Person Households | 150 (22.4%) | 26 (3.9%) |
| 3-Person Households | 57 (8.5%) | 0 (0.0%) |
| 4-Person Households | 50 (7.5%) | 0 (0.0%) |
| 5-Person Households | 13 (1.9%) | 5 (0.7%) |
| 6-Person Households | 25 (3.7%) | 0 (0.0%) |
| 7+ Person Households | 0 (0.0%) | 0 (0.0%) |
| Total | 295 (44.0%) | 375 (56.0%) |
Female Fertility in New Rockford
Fertility by Age in New Rockford
Average fertility rate in New Rockford is 81.0 births per 1,000 women. Women in the age bracket of 20 to 34 years have the highest fertility rate with 122.0 births per 1,000 women. Women in the age bracket of 20 to 34 years acount for 70.8% of all women with births.
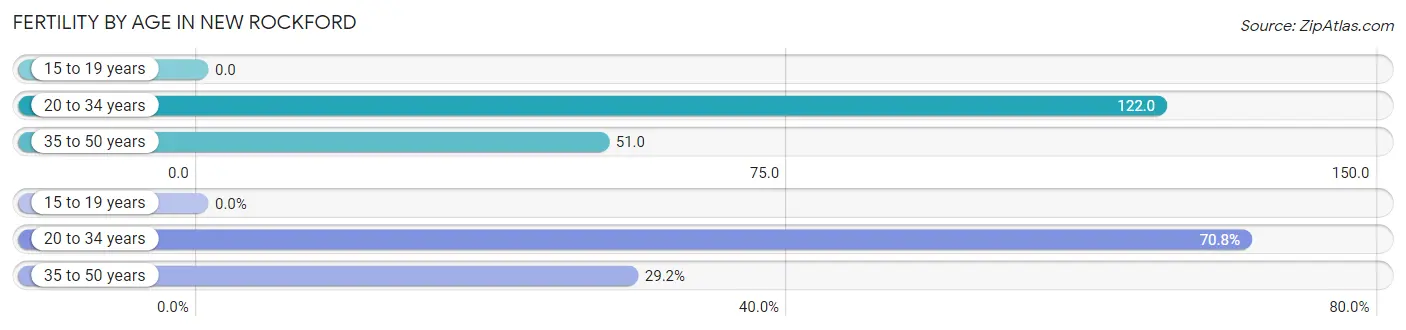
| Age Bracket | Women with Births | Births / 1,000 Women |
| 15 to 19 years | 0 (0.0%) | 0.0 |
| 20 to 34 years | 17 (70.8%) | 122.0 |
| 35 to 50 years | 7 (29.2%) | 51.0 |
| Total | 24 (100.0%) | 81.0 |
Fertility by Age by Marriage Status in New Rockford
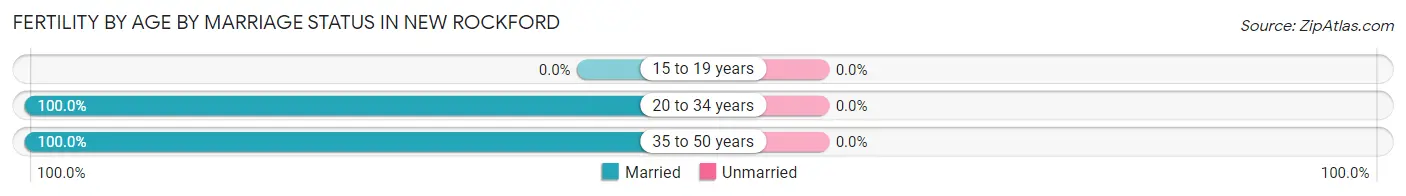
| Age Bracket | Married | Unmarried |
| 15 to 19 years | 0 (0.0%) | 0 (0.0%) |
| 20 to 34 years | 17 (100.0%) | 0 (0.0%) |
| 35 to 50 years | 7 (100.0%) | 0 (0.0%) |
| Total | 24 (100.0%) | 0 (0.0%) |
Fertility by Education in New Rockford
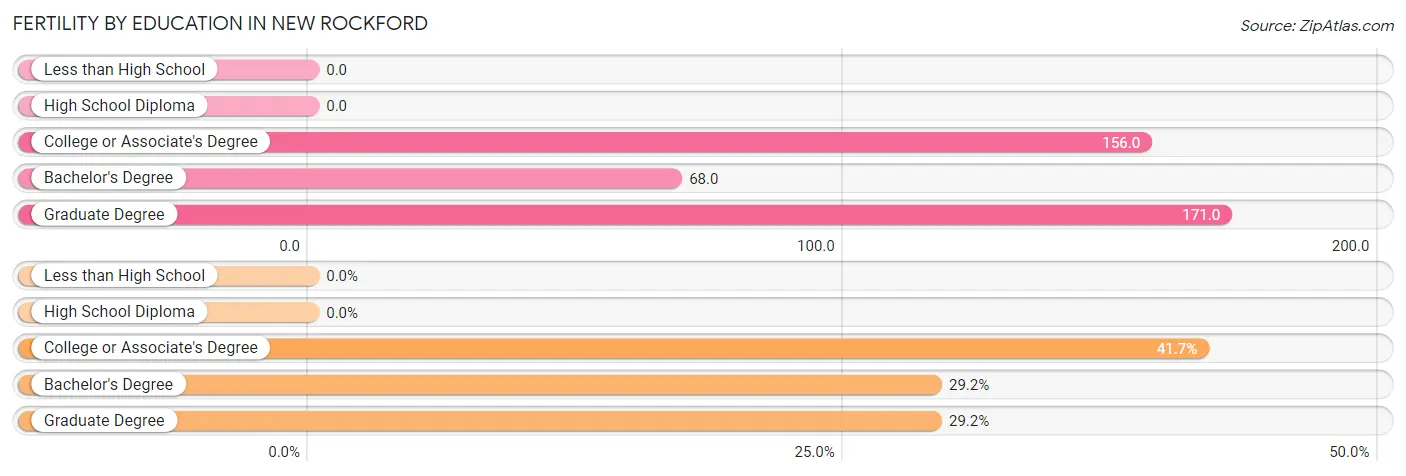
| Educational Attainment | Women with Births | Births / 1,000 Women |
| Less than High School | 0 (0.0%) | 0.0 |
| High School Diploma | 0 (0.0%) | 0.0 |
| College or Associate's Degree | 10 (41.7%) | 156.0 |
| Bachelor's Degree | 7 (29.2%) | 68.0 |
| Graduate Degree | 7 (29.2%) | 171.0 |
| Total | 24 (100.0%) | 81.0 |
Fertility by Education by Marriage Status in New Rockford
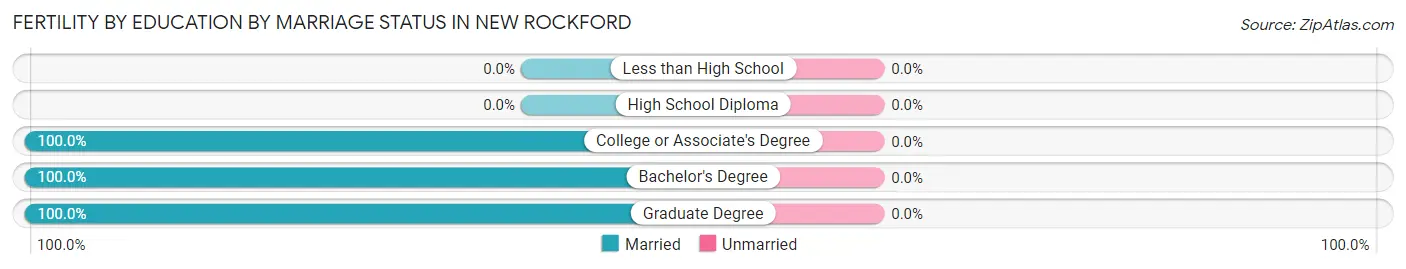
| Educational Attainment | Married | Unmarried |
| Less than High School | 0 (0.0%) | 0 (0.0%) |
| High School Diploma | 0 (0.0%) | 0 (0.0%) |
| College or Associate's Degree | 10 (100.0%) | 0 (0.0%) |
| Bachelor's Degree | 7 (100.0%) | 0 (0.0%) |
| Graduate Degree | 7 (100.0%) | 0 (0.0%) |
| Total | 24 (100.0%) | 0 (0.0%) |
Employment Characteristics in New Rockford
Employment by Class of Employer in New Rockford
Among the 686 employed individuals in New Rockford, private company employees (332 | 48.4%), local government employees (113 | 16.5%), and not-for-profit organizations (102 | 14.9%) make up the most common classes of employment.
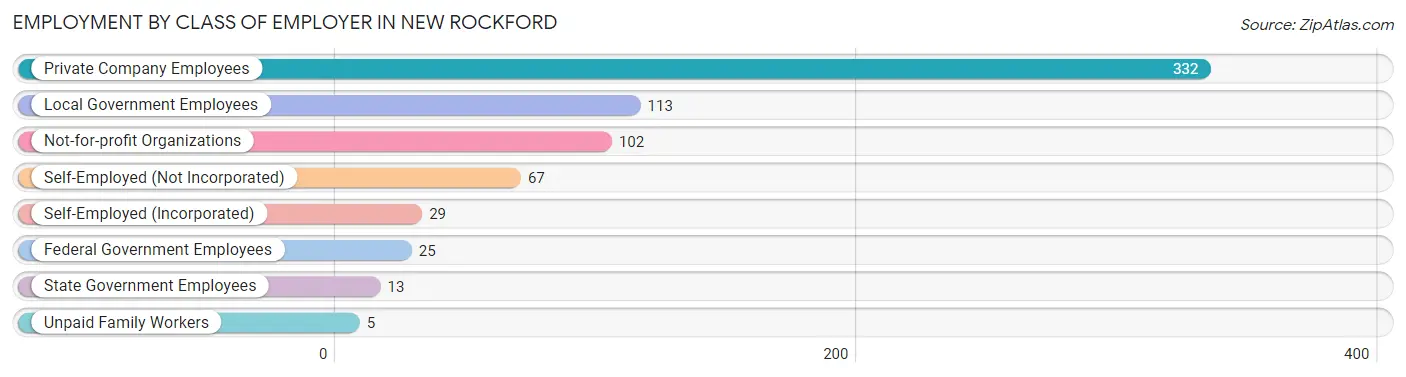
| Employer Class | # Employees | % Employees |
| Private Company Employees | 332 | 48.4% |
| Self-Employed (Incorporated) | 29 | 4.2% |
| Self-Employed (Not Incorporated) | 67 | 9.8% |
| Not-for-profit Organizations | 102 | 14.9% |
| Local Government Employees | 113 | 16.5% |
| State Government Employees | 13 | 1.9% |
| Federal Government Employees | 25 | 3.6% |
| Unpaid Family Workers | 5 | 0.7% |
| Total | 686 | 100.0% |
Employment Status by Age in New Rockford
According to the labor force statistics for New Rockford, out of the total population over 16 years of age (1,154), 61.6% or 711 individuals are in the labor force, with 3.0% or 21 of them unemployed. The age group with the highest labor force participation rate is 45 to 54 years, with 95.7% or 134 individuals in the labor force. Within the labor force, the 55 to 59 years age range has the highest percentage of unemployed individuals, with 19.5% or 8 of them being unemployed.
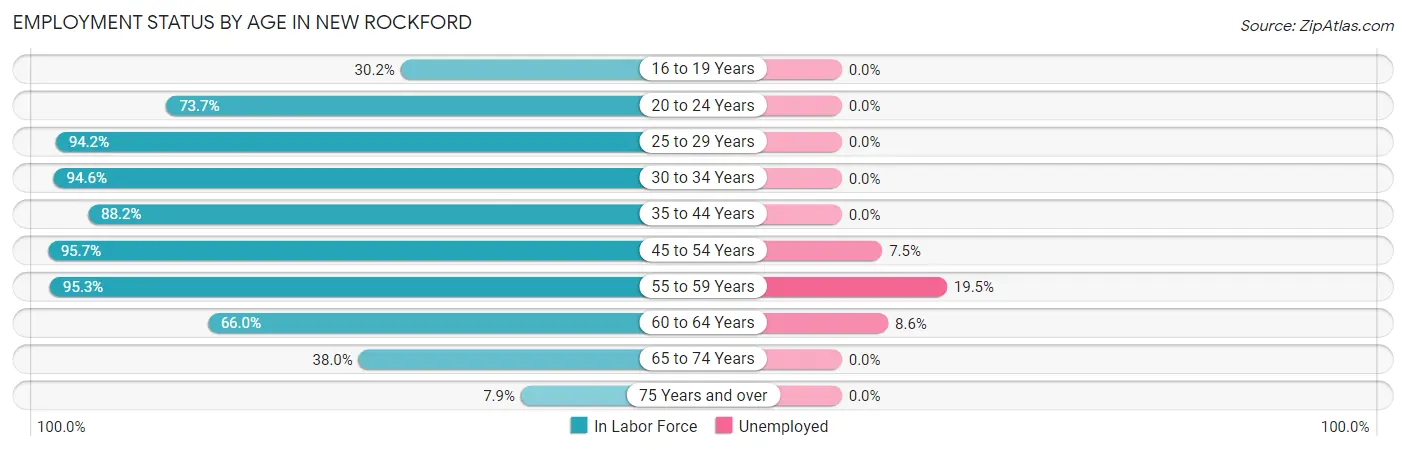
| Age Bracket | In Labor Force | Unemployed |
| 16 to 19 Years | 16 (30.2%) | 0 (0.0%) |
| 20 to 24 Years | 70 (73.7%) | 0 (0.0%) |
| 25 to 29 Years | 131 (94.2%) | 0 (0.0%) |
| 30 to 34 Years | 53 (94.6%) | 0 (0.0%) |
| 35 to 44 Years | 150 (88.2%) | 0 (0.0%) |
| 45 to 54 Years | 134 (95.7%) | 10 (7.5%) |
| 55 to 59 Years | 41 (95.3%) | 8 (19.5%) |
| 60 to 64 Years | 35 (66.0%) | 3 (8.6%) |
| 65 to 74 Years | 62 (38.0%) | 0 (0.0%) |
| 75 Years and over | 19 (7.9%) | 0 (0.0%) |
| Total | 711 (61.6%) | 21 (3.0%) |
Employment Status by Educational Attainment in New Rockford
According to labor force statistics for New Rockford, 90.5% of individuals (544) out of the total population between 25 and 64 years of age (601) are in the labor force, with 3.9% or 21 of them being unemployed. The group with the highest labor force participation rate are those with the educational attainment of bachelor's degree or higher, with 99.0% or 197 individuals in the labor force. Within the labor force, individuals with bachelor's degree or higher education have the highest percentage of unemployment, with 5.6% or 11 of them being unemployed.
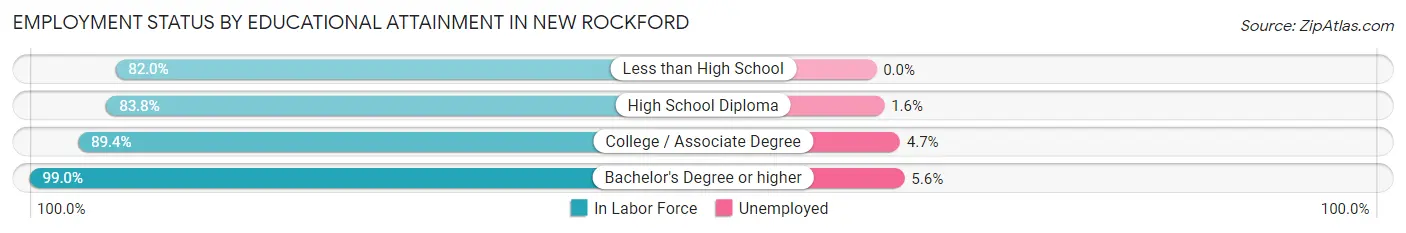
| Educational Attainment | In Labor Force | Unemployed |
| Less than High School | 41 (82.0%) | 0 (0.0%) |
| High School Diploma | 129 (83.8%) | 2 (1.6%) |
| College / Associate Degree | 177 (89.4%) | 9 (4.7%) |
| Bachelor's Degree or higher | 197 (99.0%) | 11 (5.6%) |
| Total | 544 (90.5%) | 23 (3.9%) |
Employment Occupations by Sex in New Rockford
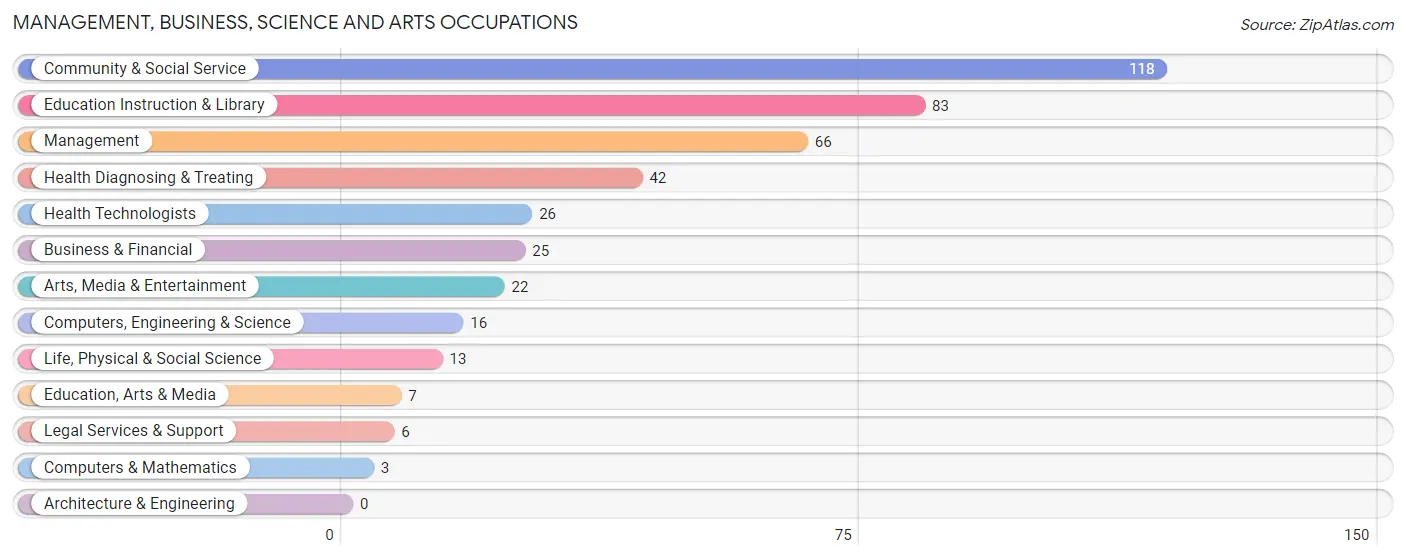
Management, Business, Science and Arts Occupations
The most common Management, Business, Science and Arts occupations in New Rockford are Community & Social Service (118 | 17.2%), Education Instruction & Library (83 | 12.1%), Management (66 | 9.6%), Health Diagnosing & Treating (42 | 6.1%), and Health Technologists (26 | 3.8%).
Management, Business, Science and Arts Occupations by Sex
Within the Management, Business, Science and Arts occupations in New Rockford, the most male-oriented occupations are Computers, Engineering & Science (100.0%), Computers & Mathematics (100.0%), and Life, Physical & Social Science (100.0%), while the most female-oriented occupations are Legal Services & Support (100.0%), Education Instruction & Library (95.2%), and Community & Social Service (88.1%).
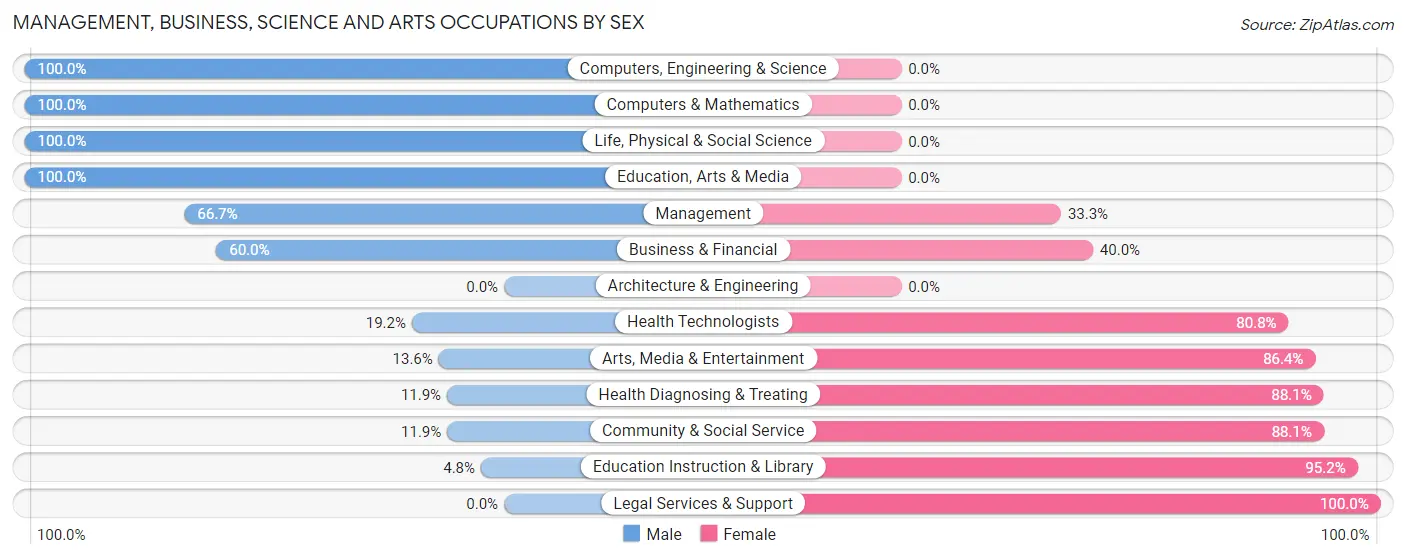
| Occupation | Male | Female |
| Management | 44 (66.7%) | 22 (33.3%) |
| Business & Financial | 15 (60.0%) | 10 (40.0%) |
| Computers, Engineering & Science | 16 (100.0%) | 0 (0.0%) |
| Computers & Mathematics | 3 (100.0%) | 0 (0.0%) |
| Architecture & Engineering | 0 (0.0%) | 0 (0.0%) |
| Life, Physical & Social Science | 13 (100.0%) | 0 (0.0%) |
| Community & Social Service | 14 (11.9%) | 104 (88.1%) |
| Education, Arts & Media | 7 (100.0%) | 0 (0.0%) |
| Legal Services & Support | 0 (0.0%) | 6 (100.0%) |
| Education Instruction & Library | 4 (4.8%) | 79 (95.2%) |
| Arts, Media & Entertainment | 3 (13.6%) | 19 (86.4%) |
| Health Diagnosing & Treating | 5 (11.9%) | 37 (88.1%) |
| Health Technologists | 5 (19.2%) | 21 (80.8%) |
| Total (Category) | 94 (35.2%) | 173 (64.8%) |
| Total (Overall) | 369 (53.9%) | 316 (46.1%) |
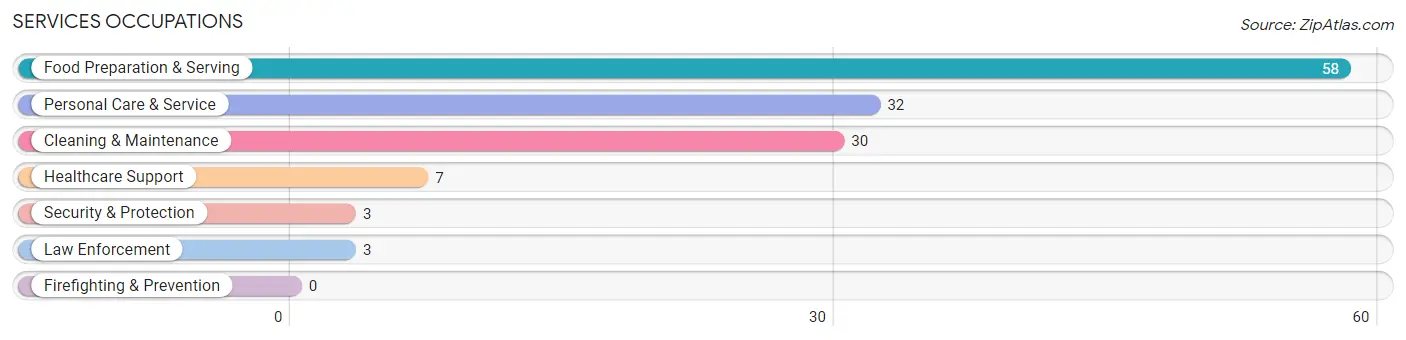
Services Occupations
The most common Services occupations in New Rockford are Food Preparation & Serving (58 | 8.5%), Personal Care & Service (32 | 4.7%), Cleaning & Maintenance (30 | 4.4%), Healthcare Support (7 | 1.0%), and Security & Protection (3 | 0.4%).
Services Occupations by Sex
Within the Services occupations in New Rockford, the most male-oriented occupations are Security & Protection (100.0%), Law Enforcement (100.0%), and Cleaning & Maintenance (46.7%), while the most female-oriented occupations are Healthcare Support (100.0%), Personal Care & Service (81.2%), and Food Preparation & Serving (56.9%).
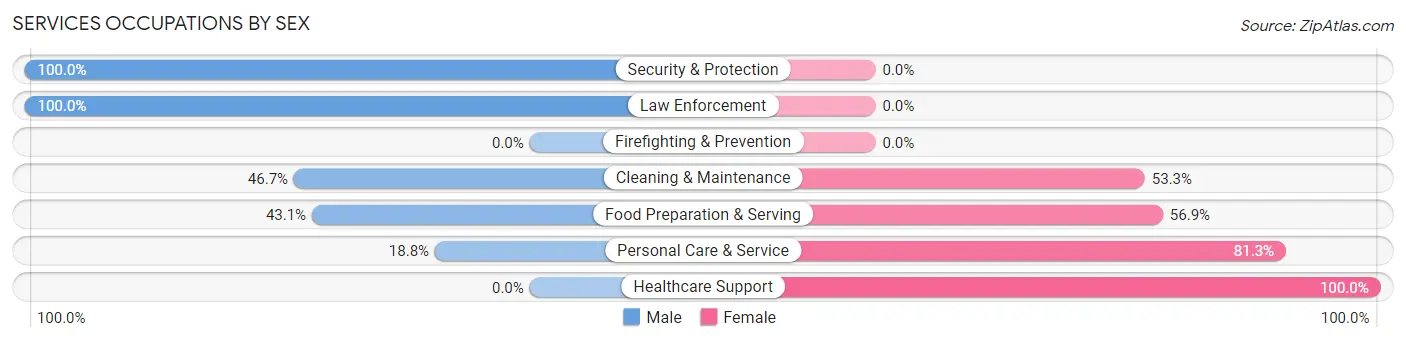
| Occupation | Male | Female |
| Healthcare Support | 0 (0.0%) | 7 (100.0%) |
| Security & Protection | 3 (100.0%) | 0 (0.0%) |
| Firefighting & Prevention | 0 (0.0%) | 0 (0.0%) |
| Law Enforcement | 3 (100.0%) | 0 (0.0%) |
| Food Preparation & Serving | 25 (43.1%) | 33 (56.9%) |
| Cleaning & Maintenance | 14 (46.7%) | 16 (53.3%) |
| Personal Care & Service | 6 (18.8%) | 26 (81.2%) |
| Total (Category) | 48 (36.9%) | 82 (63.1%) |
| Total (Overall) | 369 (53.9%) | 316 (46.1%) |
Sales and Office Occupations
The most common Sales and Office occupations in New Rockford are Office & Administration (97 | 14.2%), and Sales & Related (34 | 5.0%).

Sales and Office Occupations by Sex

| Occupation | Male | Female |
| Sales & Related | 34 (100.0%) | 0 (0.0%) |
| Office & Administration | 47 (48.4%) | 50 (51.5%) |
| Total (Category) | 81 (61.8%) | 50 (38.2%) |
| Total (Overall) | 369 (53.9%) | 316 (46.1%) |
Natural Resources, Construction and Maintenance Occupations
The most common Natural Resources, Construction and Maintenance occupations in New Rockford are Construction & Extraction (33 | 4.8%), Installation, Maintenance & Repair (22 | 3.2%), and Farming, Fishing & Forestry (15 | 2.2%).

Natural Resources, Construction and Maintenance Occupations by Sex
| Occupation | Male | Female |
| Farming, Fishing & Forestry | 15 (100.0%) | 0 (0.0%) |
| Construction & Extraction | 33 (100.0%) | 0 (0.0%) |
| Installation, Maintenance & Repair | 22 (100.0%) | 0 (0.0%) |
| Total (Category) | 70 (100.0%) | 0 (0.0%) |
| Total (Overall) | 369 (53.9%) | 316 (46.1%) |
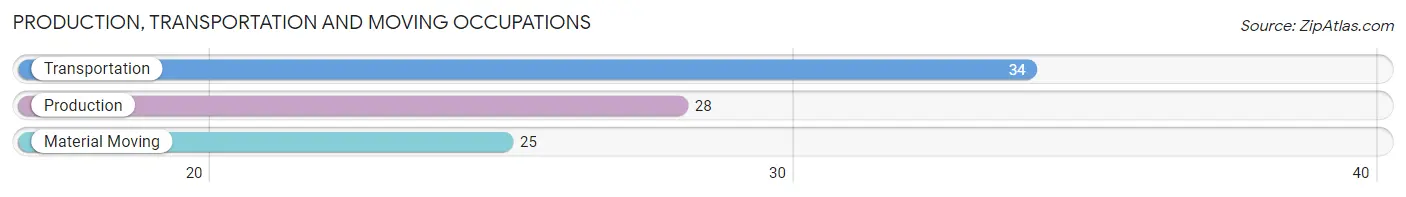
Production, Transportation and Moving Occupations
The most common Production, Transportation and Moving occupations in New Rockford are Transportation (34 | 5.0%), Production (28 | 4.1%), and Material Moving (25 | 3.6%).
Production, Transportation and Moving Occupations by Sex
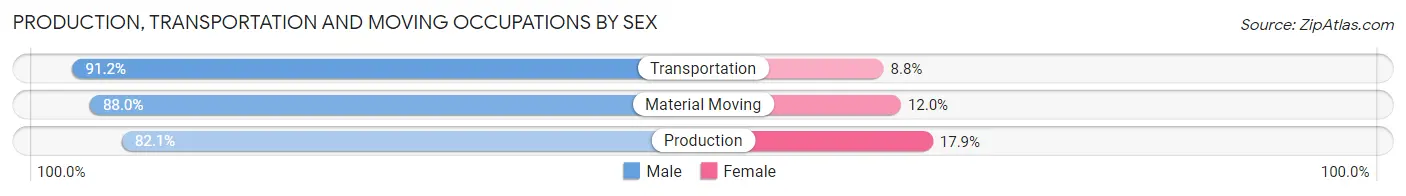
| Occupation | Male | Female |
| Production | 23 (82.1%) | 5 (17.9%) |
| Transportation | 31 (91.2%) | 3 (8.8%) |
| Material Moving | 22 (88.0%) | 3 (12.0%) |
| Total (Category) | 76 (87.4%) | 11 (12.6%) |
| Total (Overall) | 369 (53.9%) | 316 (46.1%) |
Employment Industries by Sex in New Rockford
Employment Industries in New Rockford
The major employment industries in New Rockford include Health Care & Social Assistance (115 | 16.8%), Educational Services (98 | 14.3%), Manufacturing (76 | 11.1%), Retail Trade (73 | 10.7%), and Construction (55 | 8.0%).
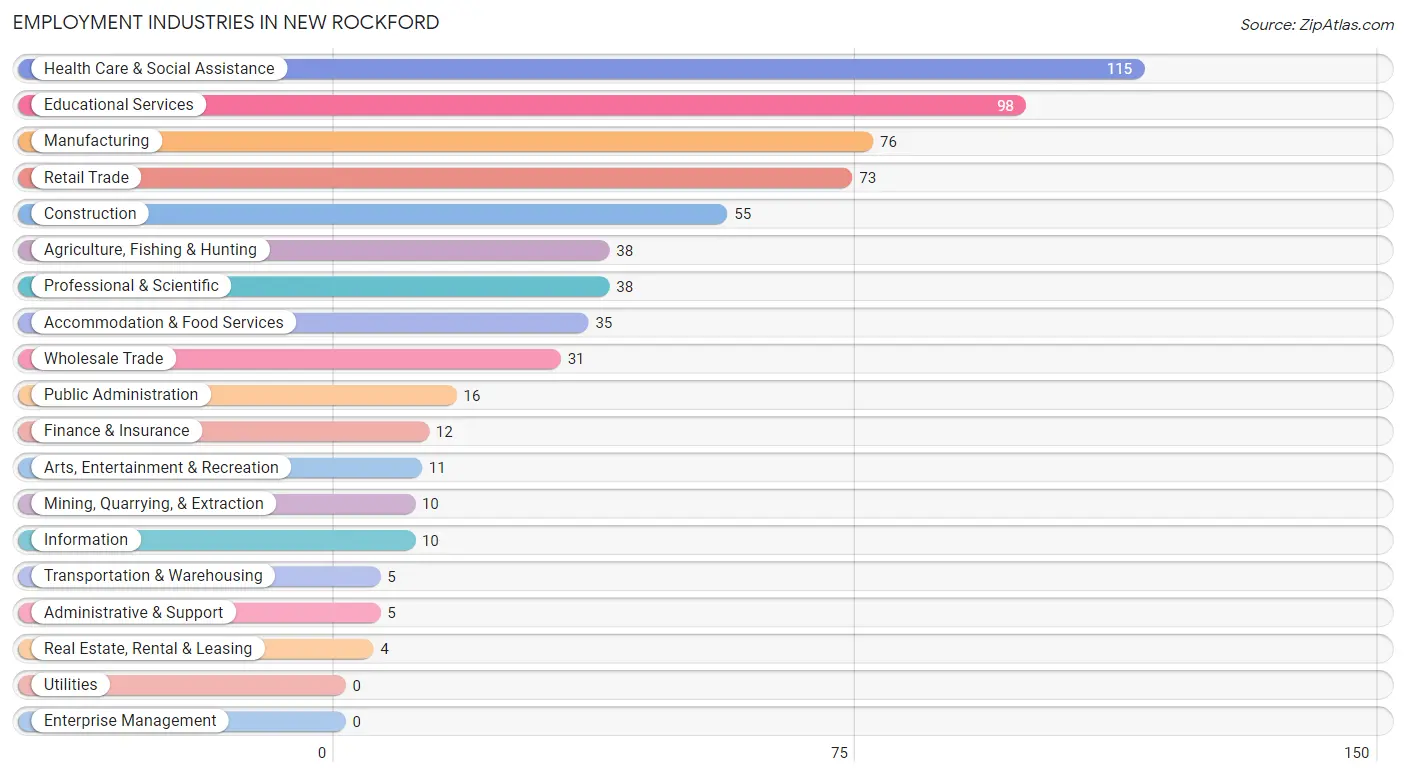
Employment Industries by Sex in New Rockford
The New Rockford industries that see more men than women are Mining, Quarrying, & Extraction (100.0%), Real Estate, Rental & Leasing (100.0%), and Arts, Entertainment & Recreation (100.0%), whereas the industries that tend to have a higher number of women are Information (100.0%), Educational Services (87.8%), and Finance & Insurance (83.3%).
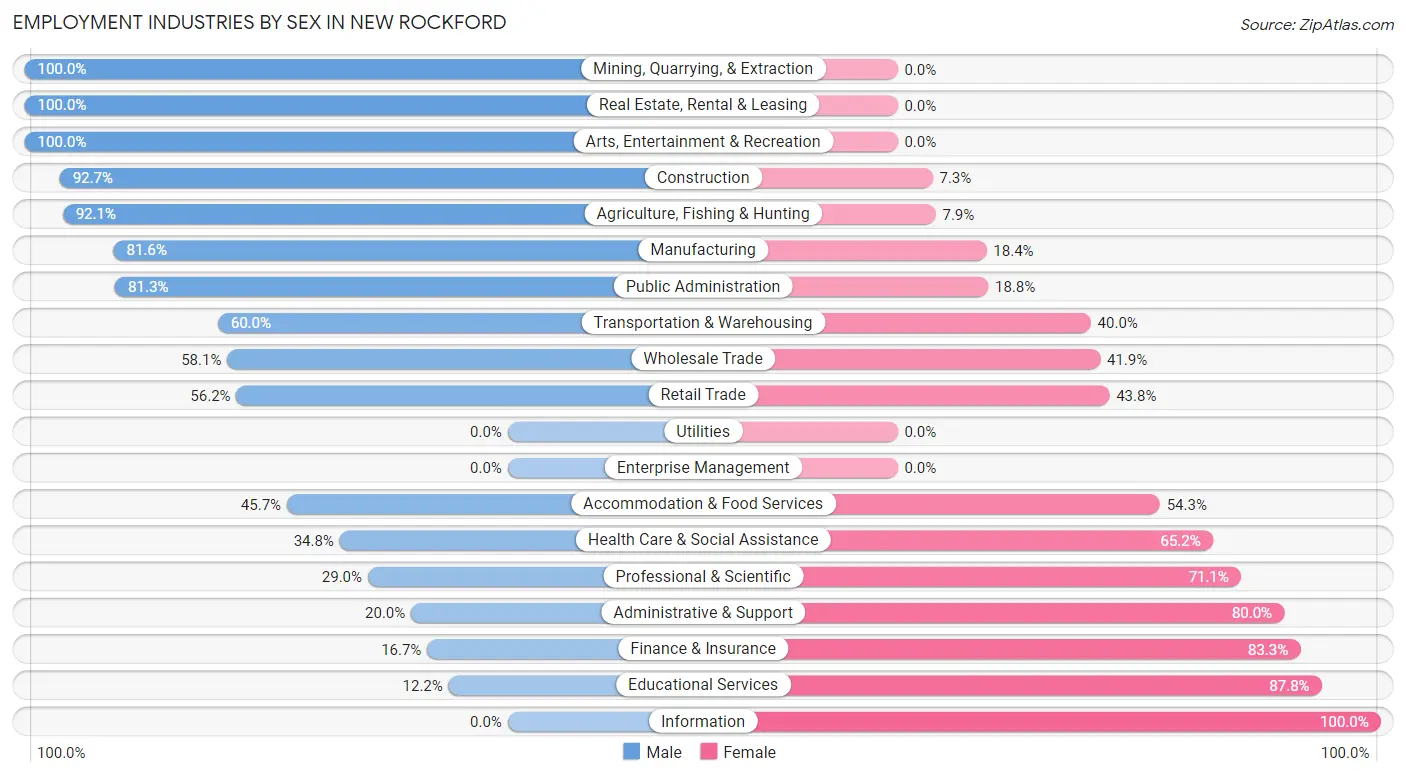
| Industry | Male | Female |
| Agriculture, Fishing & Hunting | 35 (92.1%) | 3 (7.9%) |
| Mining, Quarrying, & Extraction | 10 (100.0%) | 0 (0.0%) |
| Construction | 51 (92.7%) | 4 (7.3%) |
| Manufacturing | 62 (81.6%) | 14 (18.4%) |
| Wholesale Trade | 18 (58.1%) | 13 (41.9%) |
| Retail Trade | 41 (56.2%) | 32 (43.8%) |
| Transportation & Warehousing | 3 (60.0%) | 2 (40.0%) |
| Utilities | 0 (0.0%) | 0 (0.0%) |
| Information | 0 (0.0%) | 10 (100.0%) |
| Finance & Insurance | 2 (16.7%) | 10 (83.3%) |
| Real Estate, Rental & Leasing | 4 (100.0%) | 0 (0.0%) |
| Professional & Scientific | 11 (28.9%) | 27 (71.1%) |
| Enterprise Management | 0 (0.0%) | 0 (0.0%) |
| Administrative & Support | 1 (20.0%) | 4 (80.0%) |
| Educational Services | 12 (12.2%) | 86 (87.8%) |
| Health Care & Social Assistance | 40 (34.8%) | 75 (65.2%) |
| Arts, Entertainment & Recreation | 11 (100.0%) | 0 (0.0%) |
| Accommodation & Food Services | 16 (45.7%) | 19 (54.3%) |
| Public Administration | 13 (81.2%) | 3 (18.8%) |
| Total | 369 (53.9%) | 316 (46.1%) |
Education in New Rockford
School Enrollment in New Rockford
The most common levels of schooling among the 223 students in New Rockford are high school (76 | 34.1%), elementary school (73 | 32.7%), and middle school (23 | 10.3%).
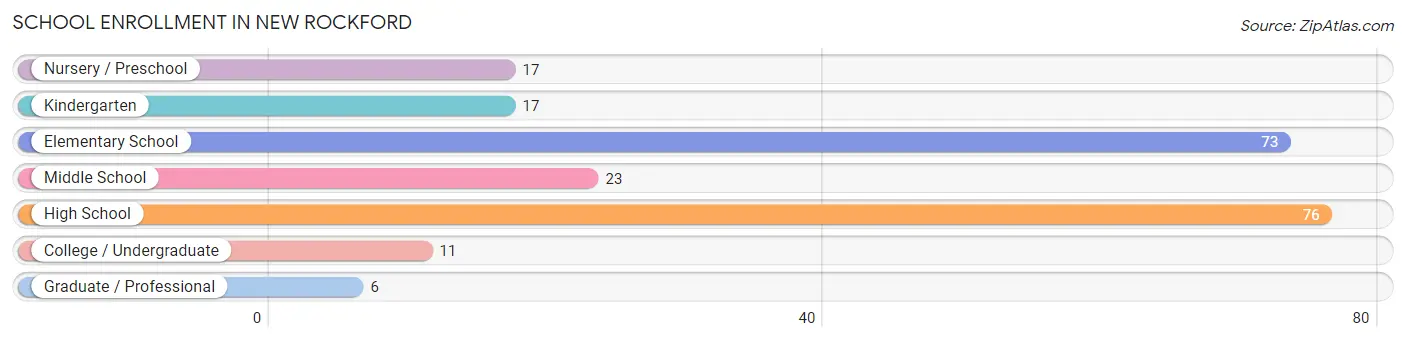
| School Level | # Students | % Students |
| Nursery / Preschool | 17 | 7.6% |
| Kindergarten | 17 | 7.6% |
| Elementary School | 73 | 32.7% |
| Middle School | 23 | 10.3% |
| High School | 76 | 34.1% |
| College / Undergraduate | 11 | 4.9% |
| Graduate / Professional | 6 | 2.7% |
| Total | 223 | 100.0% |
School Enrollment by Age by Funding Source in New Rockford
Out of a total of 223 students who are enrolled in schools in New Rockford, 20 (9.0%) attend a private institution, while the remaining 203 (91.0%) are enrolled in public schools. The age group of 20 to 24 year olds has the highest likelihood of being enrolled in private schools, with 4 (100.0% in the age bracket) enrolled. Conversely, the age group of 5 to 9 year old has the lowest likelihood of being enrolled in a private school, with 92 (100.0% in the age bracket) attending a public institution.
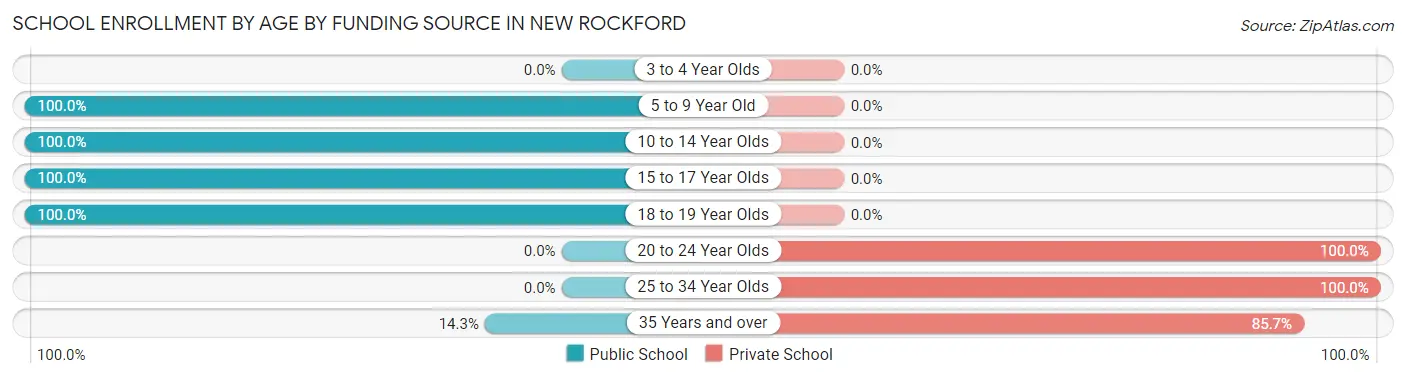
| Age Bracket | Public School | Private School |
| 3 to 4 Year Olds | 0 (0.0%) | 0 (0.0%) |
| 5 to 9 Year Old | 92 (100.0%) | 0 (0.0%) |
| 10 to 14 Year Olds | 46 (100.0%) | 0 (0.0%) |
| 15 to 17 Year Olds | 53 (100.0%) | 0 (0.0%) |
| 18 to 19 Year Olds | 11 (100.0%) | 0 (0.0%) |
| 20 to 24 Year Olds | 0 (0.0%) | 4 (100.0%) |
| 25 to 34 Year Olds | 0 (0.0%) | 10 (100.0%) |
| 35 Years and over | 1 (14.3%) | 6 (85.7%) |
| Total | 203 (91.0%) | 20 (9.0%) |
Educational Attainment by Field of Study in New Rockford
Education (96 | 28.6%), science & technology (46 | 13.7%), business (32 | 9.5%), social sciences (30 | 8.9%), and bio, nature & agricultural (28 | 8.3%) are the most common fields of study among 336 individuals in New Rockford who have obtained a bachelor's degree or higher.
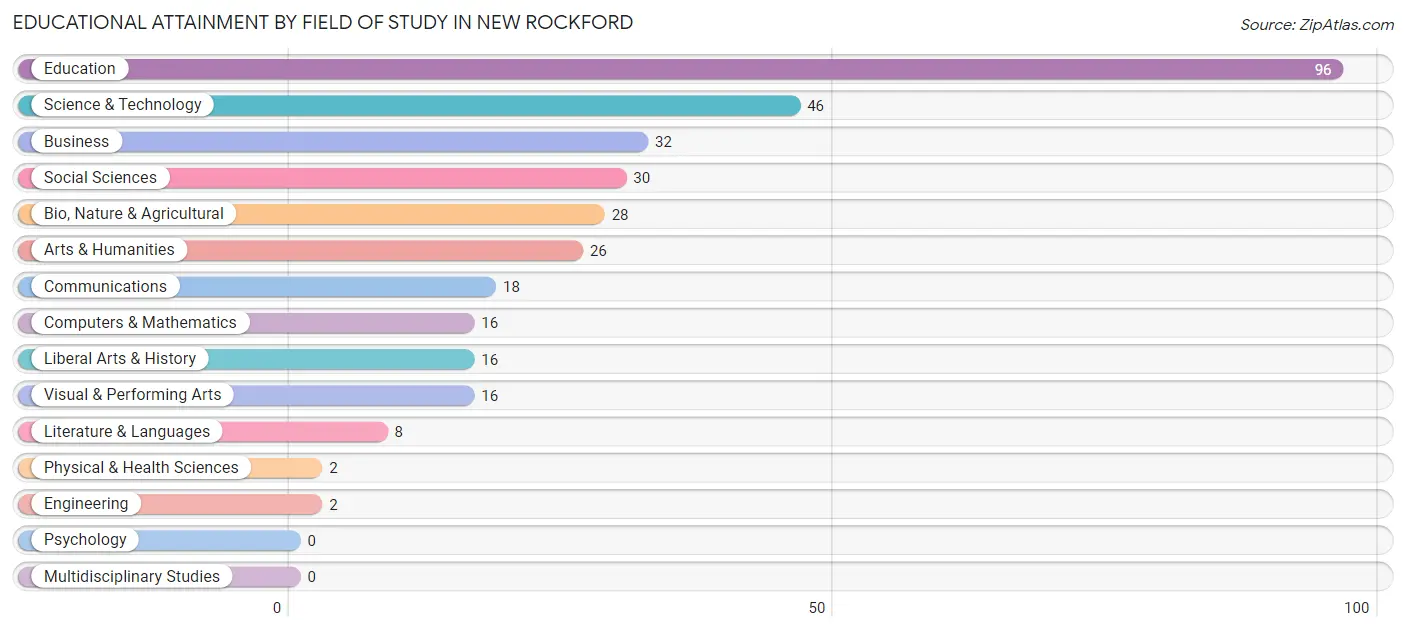
| Field of Study | # Graduates | % Graduates |
| Computers & Mathematics | 16 | 4.8% |
| Bio, Nature & Agricultural | 28 | 8.3% |
| Physical & Health Sciences | 2 | 0.6% |
| Psychology | 0 | 0.0% |
| Social Sciences | 30 | 8.9% |
| Engineering | 2 | 0.6% |
| Multidisciplinary Studies | 0 | 0.0% |
| Science & Technology | 46 | 13.7% |
| Business | 32 | 9.5% |
| Education | 96 | 28.6% |
| Literature & Languages | 8 | 2.4% |
| Liberal Arts & History | 16 | 4.8% |
| Visual & Performing Arts | 16 | 4.8% |
| Communications | 18 | 5.4% |
| Arts & Humanities | 26 | 7.7% |
| Total | 336 | 100.0% |
Transportation & Commute in New Rockford
Vehicle Availability by Sex in New Rockford
The most prevalent vehicle ownership categories in New Rockford are males with 2 vehicles (132, accounting for 35.9%) and females with 2 vehicles (81, making up 41.8%).
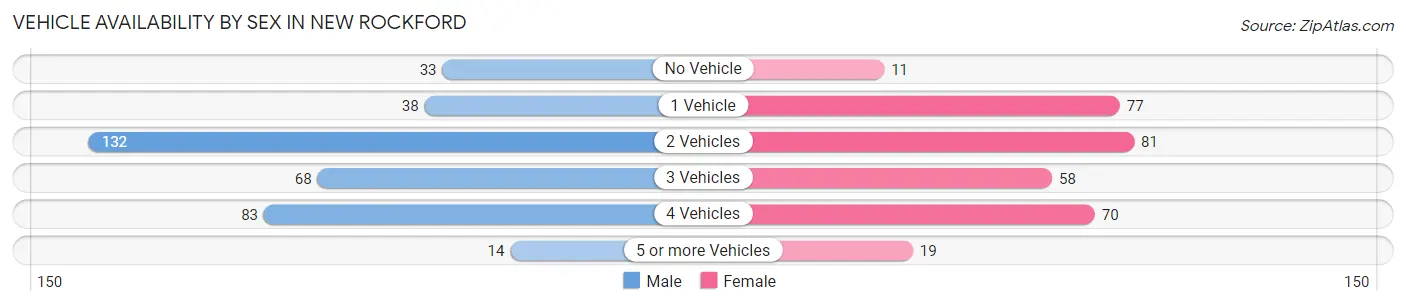
| Vehicles Available | Male | Female |
| No Vehicle | 33 (9.0%) | 11 (3.5%) |
| 1 Vehicle | 38 (10.3%) | 77 (24.4%) |
| 2 Vehicles | 132 (35.9%) | 81 (25.6%) |
| 3 Vehicles | 68 (18.5%) | 58 (18.3%) |
| 4 Vehicles | 83 (22.6%) | 70 (22.2%) |
| 5 or more Vehicles | 14 (3.8%) | 19 (6.0%) |
| Total | 368 (100.0%) | 316 (100.0%) |
Commute Time in New Rockford
The most frequently occuring commute durations in New Rockford are less than 5 minutes (220 commuters, 32.5%), 5 to 9 minutes (176 commuters, 26.0%), and 10 to 14 minutes (114 commuters, 16.9%).
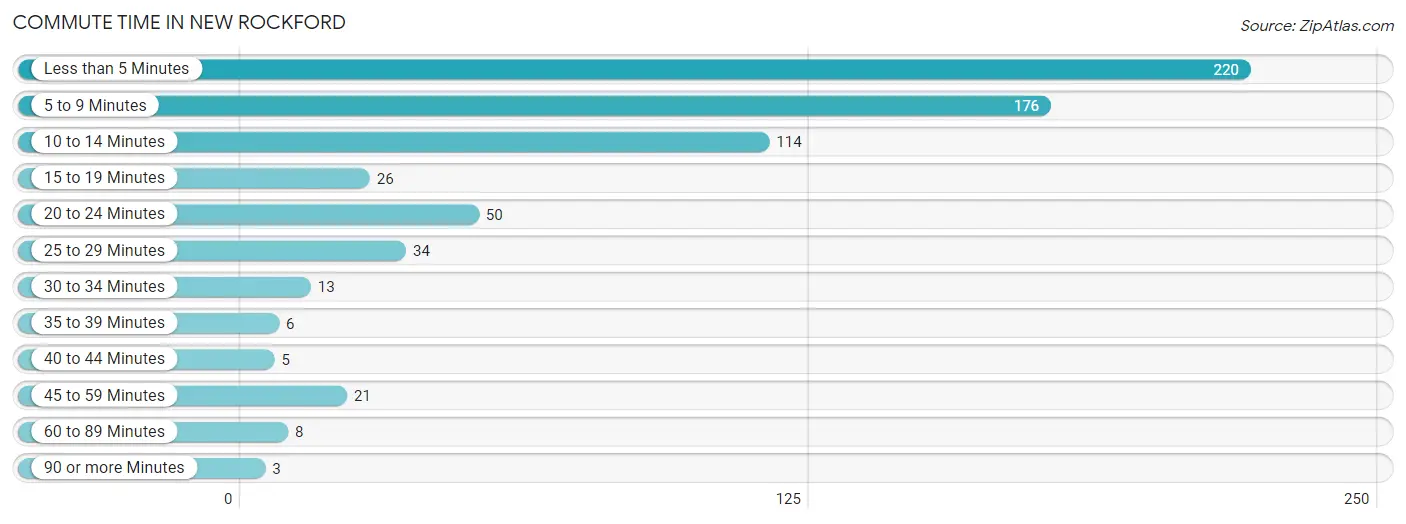
| Commute Time | # Commuters | % Commuters |
| Less than 5 Minutes | 220 | 32.5% |
| 5 to 9 Minutes | 176 | 26.0% |
| 10 to 14 Minutes | 114 | 16.9% |
| 15 to 19 Minutes | 26 | 3.8% |
| 20 to 24 Minutes | 50 | 7.4% |
| 25 to 29 Minutes | 34 | 5.0% |
| 30 to 34 Minutes | 13 | 1.9% |
| 35 to 39 Minutes | 6 | 0.9% |
| 40 to 44 Minutes | 5 | 0.7% |
| 45 to 59 Minutes | 21 | 3.1% |
| 60 to 89 Minutes | 8 | 1.2% |
| 90 or more Minutes | 3 | 0.4% |
Commute Time by Sex in New Rockford
The most common commute times in New Rockford are less than 5 minutes (100 commuters, 27.3%) for males and less than 5 minutes (120 commuters, 38.7%) for females.
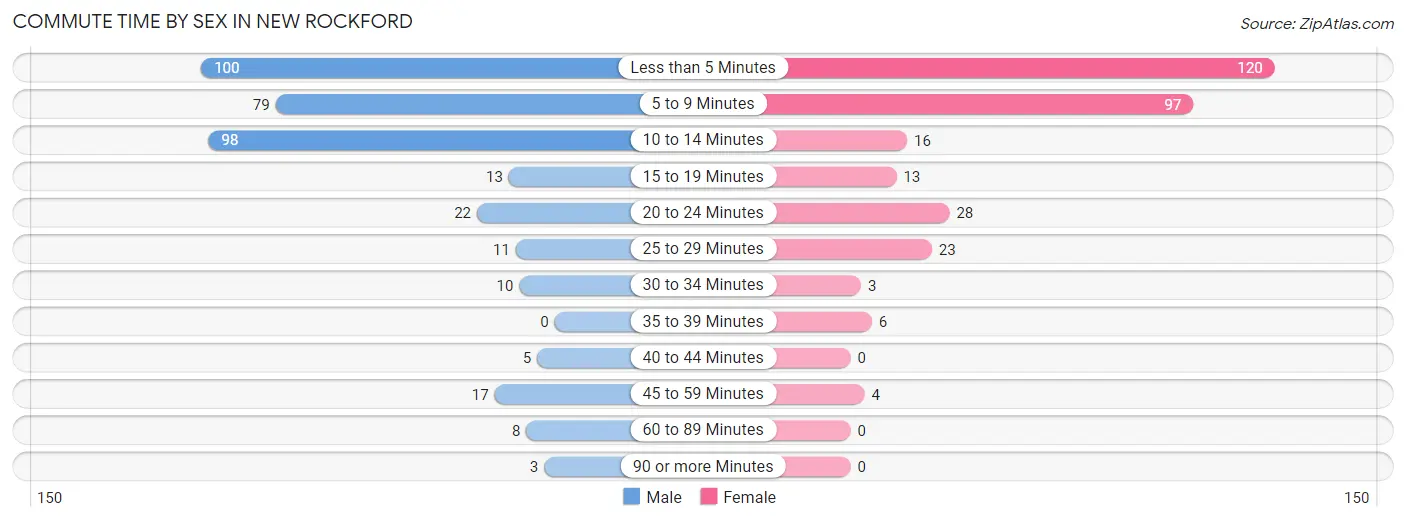
| Commute Time | Male | Female |
| Less than 5 Minutes | 100 (27.3%) | 120 (38.7%) |
| 5 to 9 Minutes | 79 (21.6%) | 97 (31.3%) |
| 10 to 14 Minutes | 98 (26.8%) | 16 (5.2%) |
| 15 to 19 Minutes | 13 (3.5%) | 13 (4.2%) |
| 20 to 24 Minutes | 22 (6.0%) | 28 (9.0%) |
| 25 to 29 Minutes | 11 (3.0%) | 23 (7.4%) |
| 30 to 34 Minutes | 10 (2.7%) | 3 (1.0%) |
| 35 to 39 Minutes | 0 (0.0%) | 6 (1.9%) |
| 40 to 44 Minutes | 5 (1.4%) | 0 (0.0%) |
| 45 to 59 Minutes | 17 (4.6%) | 4 (1.3%) |
| 60 to 89 Minutes | 8 (2.2%) | 0 (0.0%) |
| 90 or more Minutes | 3 (0.8%) | 0 (0.0%) |
Time of Departure to Work by Sex in New Rockford
The most frequent times of departure to work in New Rockford are 8:00 AM to 8:29 AM (88, 24.0%) for males and 7:30 AM to 7:59 AM (76, 24.5%) for females.
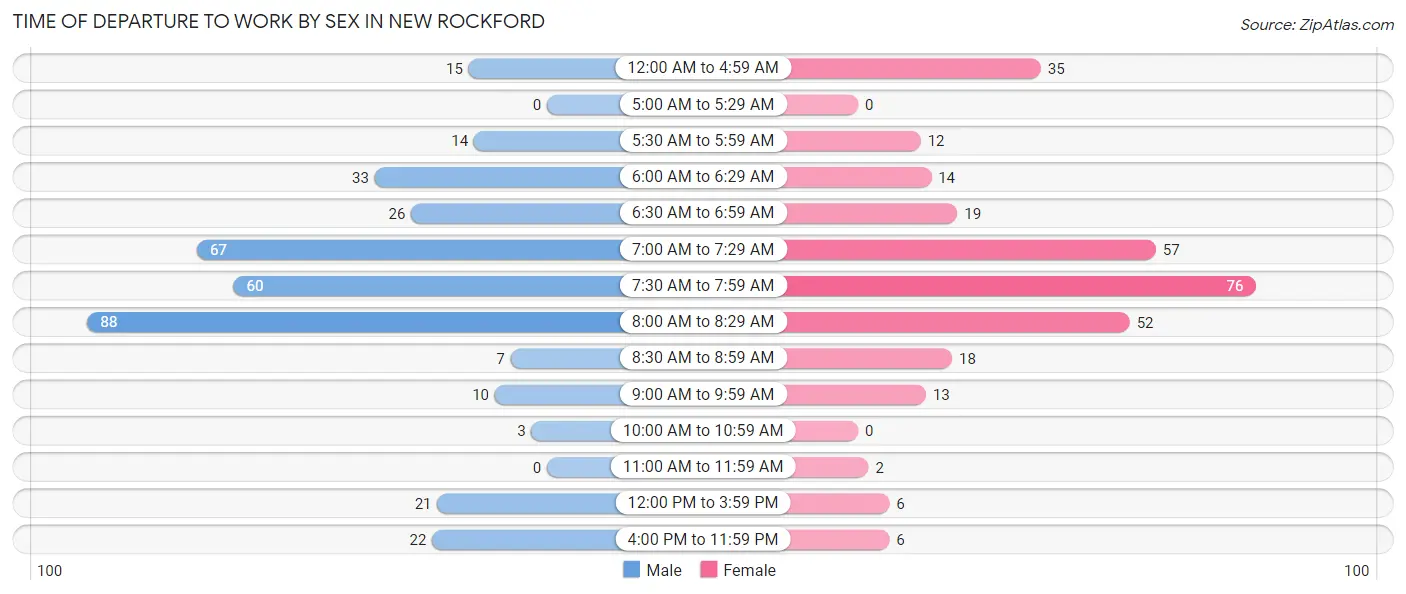
| Time of Departure | Male | Female |
| 12:00 AM to 4:59 AM | 15 (4.1%) | 35 (11.3%) |
| 5:00 AM to 5:29 AM | 0 (0.0%) | 0 (0.0%) |
| 5:30 AM to 5:59 AM | 14 (3.8%) | 12 (3.9%) |
| 6:00 AM to 6:29 AM | 33 (9.0%) | 14 (4.5%) |
| 6:30 AM to 6:59 AM | 26 (7.1%) | 19 (6.1%) |
| 7:00 AM to 7:29 AM | 67 (18.3%) | 57 (18.4%) |
| 7:30 AM to 7:59 AM | 60 (16.4%) | 76 (24.5%) |
| 8:00 AM to 8:29 AM | 88 (24.0%) | 52 (16.8%) |
| 8:30 AM to 8:59 AM | 7 (1.9%) | 18 (5.8%) |
| 9:00 AM to 9:59 AM | 10 (2.7%) | 13 (4.2%) |
| 10:00 AM to 10:59 AM | 3 (0.8%) | 0 (0.0%) |
| 11:00 AM to 11:59 AM | 0 (0.0%) | 2 (0.6%) |
| 12:00 PM to 3:59 PM | 21 (5.7%) | 6 (1.9%) |
| 4:00 PM to 11:59 PM | 22 (6.0%) | 6 (1.9%) |
| Total | 366 (100.0%) | 310 (100.0%) |
Housing Occupancy in New Rockford
Occupancy by Ownership in New Rockford
Of the total 670 dwellings in New Rockford, owner-occupied units account for 387 (57.8%), while renter-occupied units make up 283 (42.2%).
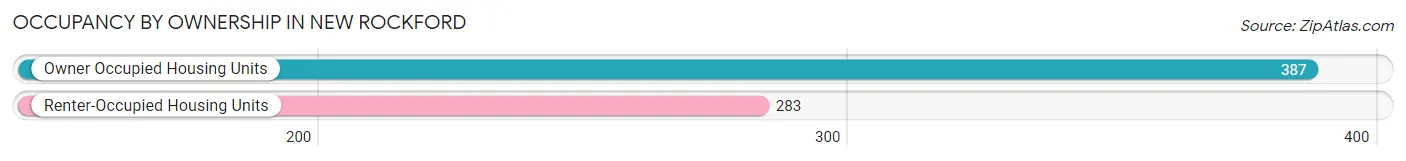
| Occupancy | # Housing Units | % Housing Units |
| Owner Occupied Housing Units | 387 | 57.8% |
| Renter-Occupied Housing Units | 283 | 42.2% |
| Total Occupied Housing Units | 670 | 100.0% |
Occupancy by Household Size in New Rockford
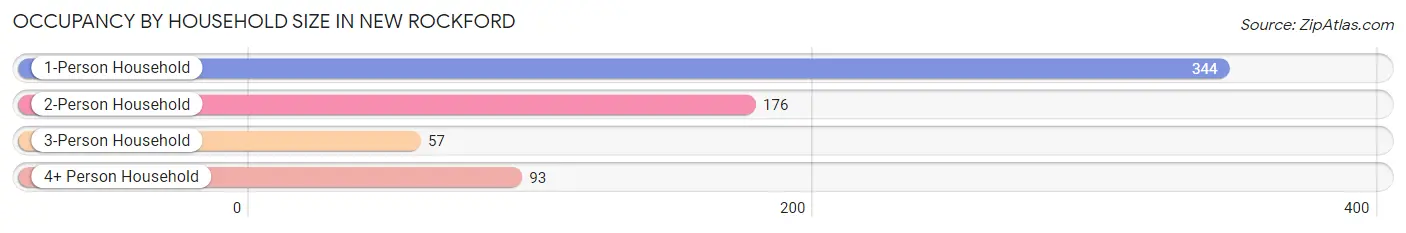
| Household Size | # Housing Units | % Housing Units |
| 1-Person Household | 344 | 51.3% |
| 2-Person Household | 176 | 26.3% |
| 3-Person Household | 57 | 8.5% |
| 4+ Person Household | 93 | 13.9% |
| Total Housing Units | 670 | 100.0% |
Occupancy by Ownership by Household Size in New Rockford
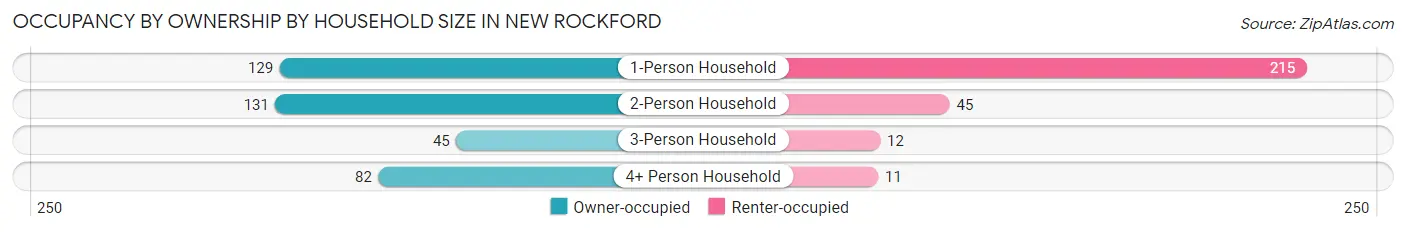
| Household Size | Owner-occupied | Renter-occupied |
| 1-Person Household | 129 (37.5%) | 215 (62.5%) |
| 2-Person Household | 131 (74.4%) | 45 (25.6%) |
| 3-Person Household | 45 (78.9%) | 12 (21.0%) |
| 4+ Person Household | 82 (88.2%) | 11 (11.8%) |
| Total Housing Units | 387 (57.8%) | 283 (42.2%) |
Occupancy by Educational Attainment in New Rockford
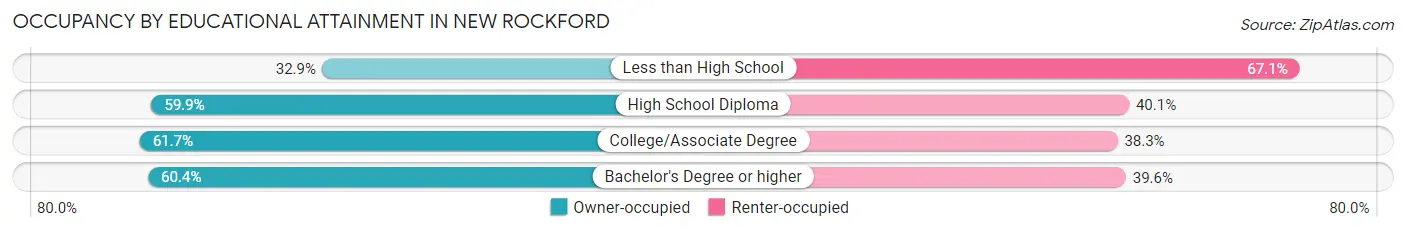
| Household Size | Owner-occupied | Renter-occupied |
| Less than High School | 23 (32.9%) | 47 (67.1%) |
| High School Diploma | 124 (59.9%) | 83 (40.1%) |
| College/Associate Degree | 121 (61.7%) | 75 (38.3%) |
| Bachelor's Degree or higher | 119 (60.4%) | 78 (39.6%) |
Occupancy by Age of Householder in New Rockford
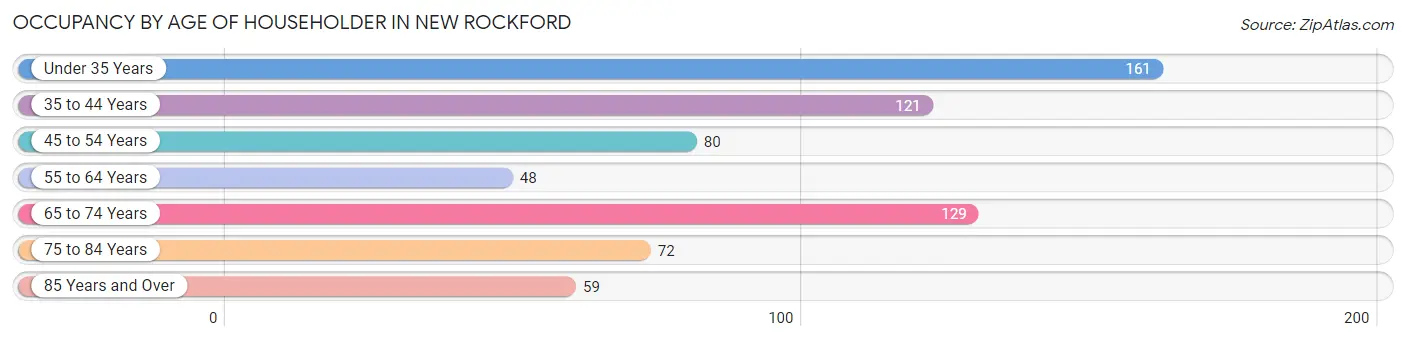
| Age Bracket | # Households | % Households |
| Under 35 Years | 161 | 24.0% |
| 35 to 44 Years | 121 | 18.1% |
| 45 to 54 Years | 80 | 11.9% |
| 55 to 64 Years | 48 | 7.2% |
| 65 to 74 Years | 129 | 19.3% |
| 75 to 84 Years | 72 | 10.7% |
| 85 Years and Over | 59 | 8.8% |
| Total | 670 | 100.0% |
Housing Finances in New Rockford
Median Income by Occupancy in New Rockford
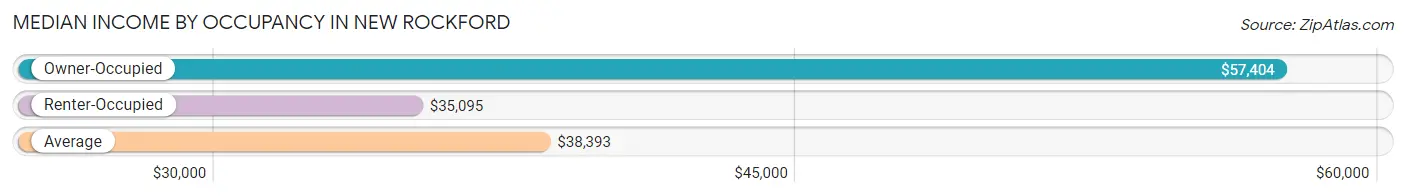
| Occupancy Type | # Households | Median Income |
| Owner-Occupied | 387 (57.8%) | $57,404 |
| Renter-Occupied | 283 (42.2%) | $35,095 |
| Average | 670 (100.0%) | $38,393 |
Occupancy by Householder Income Bracket in New Rockford
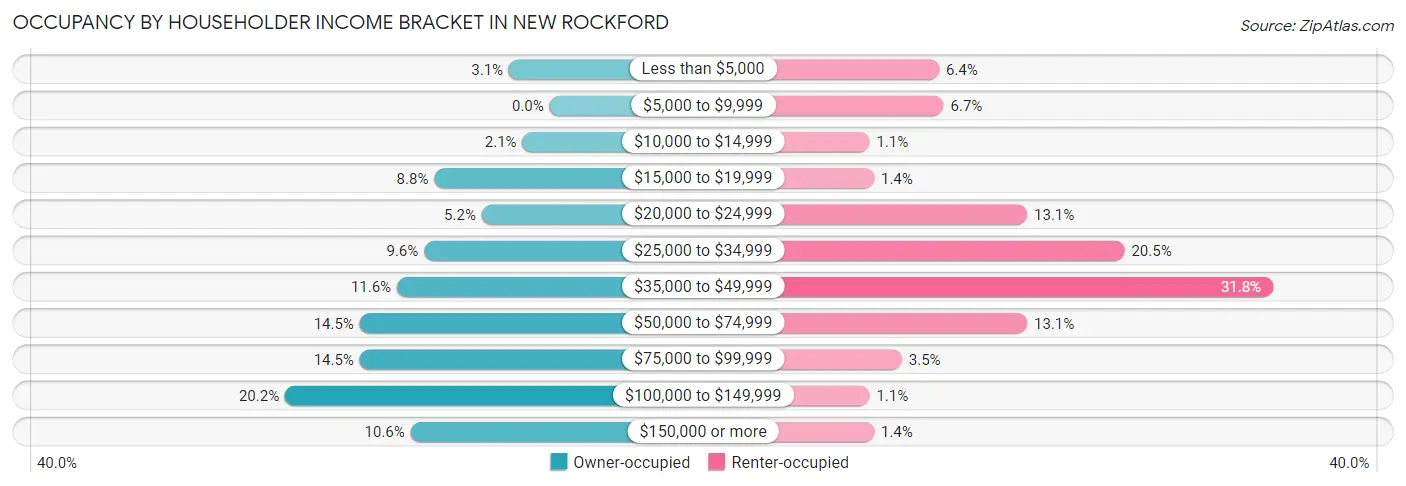
| Income Bracket | Owner-occupied | Renter-occupied |
| Less than $5,000 | 12 (3.1%) | 18 (6.4%) |
| $5,000 to $9,999 | 0 (0.0%) | 19 (6.7%) |
| $10,000 to $14,999 | 8 (2.1%) | 3 (1.1%) |
| $15,000 to $19,999 | 34 (8.8%) | 4 (1.4%) |
| $20,000 to $24,999 | 20 (5.2%) | 37 (13.1%) |
| $25,000 to $34,999 | 37 (9.6%) | 58 (20.5%) |
| $35,000 to $49,999 | 45 (11.6%) | 90 (31.8%) |
| $50,000 to $74,999 | 56 (14.5%) | 37 (13.1%) |
| $75,000 to $99,999 | 56 (14.5%) | 10 (3.5%) |
| $100,000 to $149,999 | 78 (20.2%) | 3 (1.1%) |
| $150,000 or more | 41 (10.6%) | 4 (1.4%) |
| Total | 387 (100.0%) | 283 (100.0%) |
Monthly Housing Cost Tiers in New Rockford
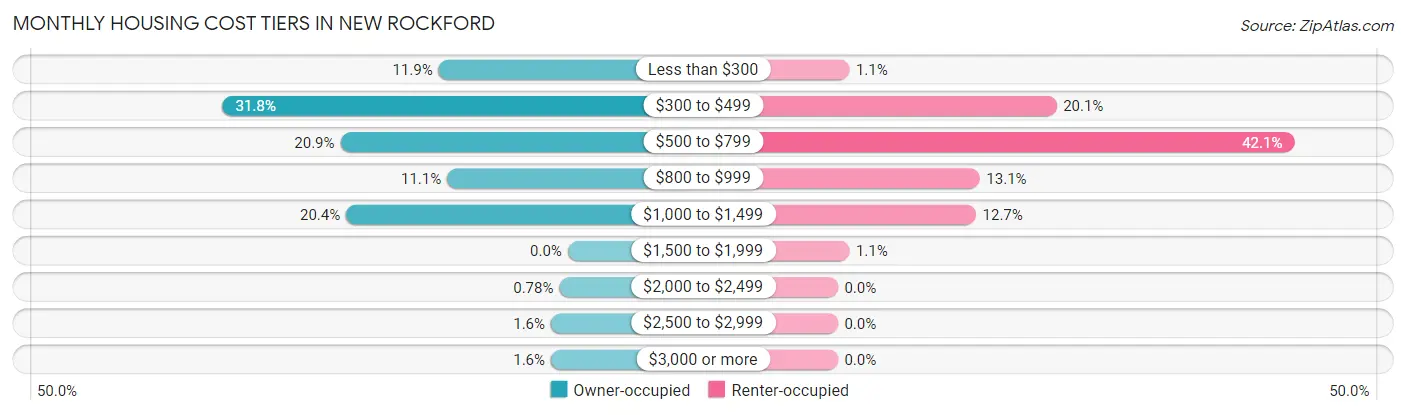
| Monthly Cost | Owner-occupied | Renter-occupied |
| Less than $300 | 46 (11.9%) | 3 (1.1%) |
| $300 to $499 | 123 (31.8%) | 57 (20.1%) |
| $500 to $799 | 81 (20.9%) | 119 (42.0%) |
| $800 to $999 | 43 (11.1%) | 37 (13.1%) |
| $1,000 to $1,499 | 79 (20.4%) | 36 (12.7%) |
| $1,500 to $1,999 | 0 (0.0%) | 3 (1.1%) |
| $2,000 to $2,499 | 3 (0.8%) | 0 (0.0%) |
| $2,500 to $2,999 | 6 (1.5%) | 0 (0.0%) |
| $3,000 or more | 6 (1.5%) | 0 (0.0%) |
| Total | 387 (100.0%) | 283 (100.0%) |
Physical Housing Characteristics in New Rockford
Housing Structures in New Rockford
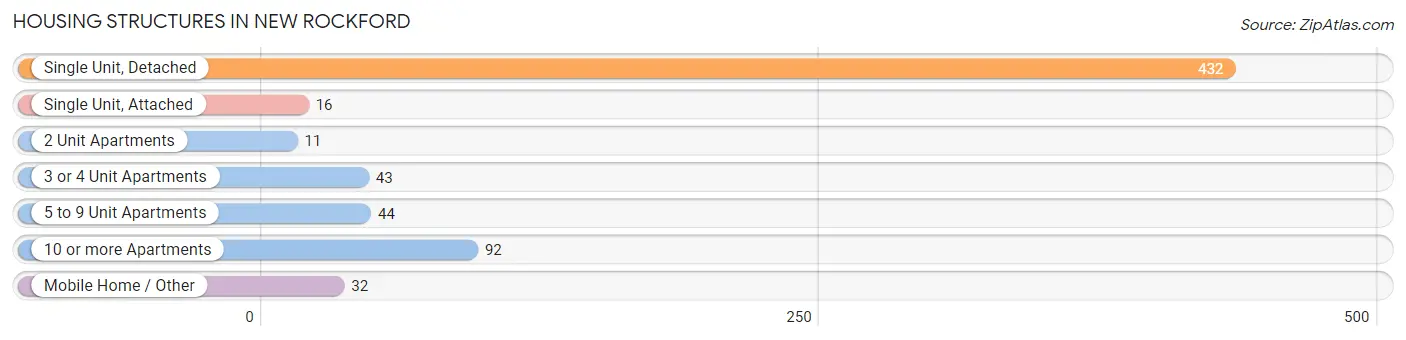
| Structure Type | # Housing Units | % Housing Units |
| Single Unit, Detached | 432 | 64.5% |
| Single Unit, Attached | 16 | 2.4% |
| 2 Unit Apartments | 11 | 1.6% |
| 3 or 4 Unit Apartments | 43 | 6.4% |
| 5 to 9 Unit Apartments | 44 | 6.6% |
| 10 or more Apartments | 92 | 13.7% |
| Mobile Home / Other | 32 | 4.8% |
| Total | 670 | 100.0% |
Housing Structures by Occupancy in New Rockford
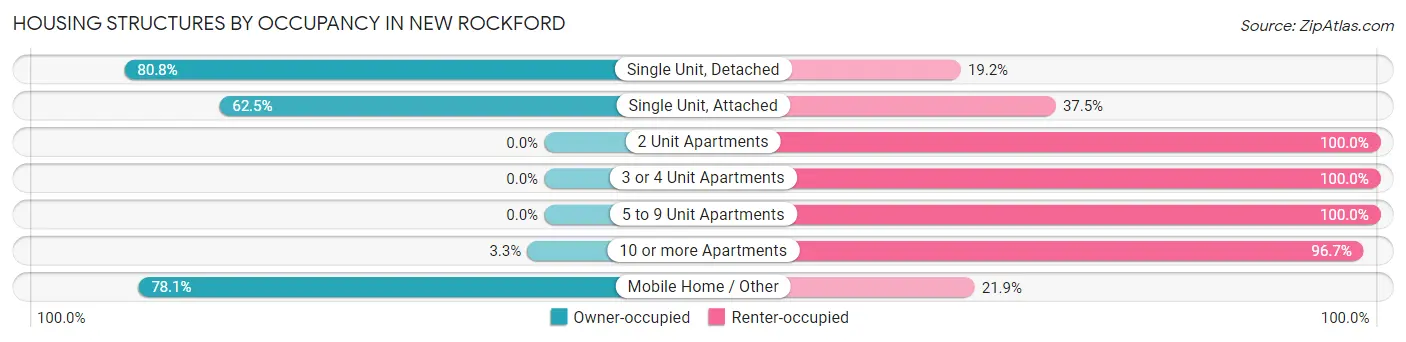
| Structure Type | Owner-occupied | Renter-occupied |
| Single Unit, Detached | 349 (80.8%) | 83 (19.2%) |
| Single Unit, Attached | 10 (62.5%) | 6 (37.5%) |
| 2 Unit Apartments | 0 (0.0%) | 11 (100.0%) |
| 3 or 4 Unit Apartments | 0 (0.0%) | 43 (100.0%) |
| 5 to 9 Unit Apartments | 0 (0.0%) | 44 (100.0%) |
| 10 or more Apartments | 3 (3.3%) | 89 (96.7%) |
| Mobile Home / Other | 25 (78.1%) | 7 (21.9%) |
| Total | 387 (57.8%) | 283 (42.2%) |
Housing Structures by Number of Rooms in New Rockford
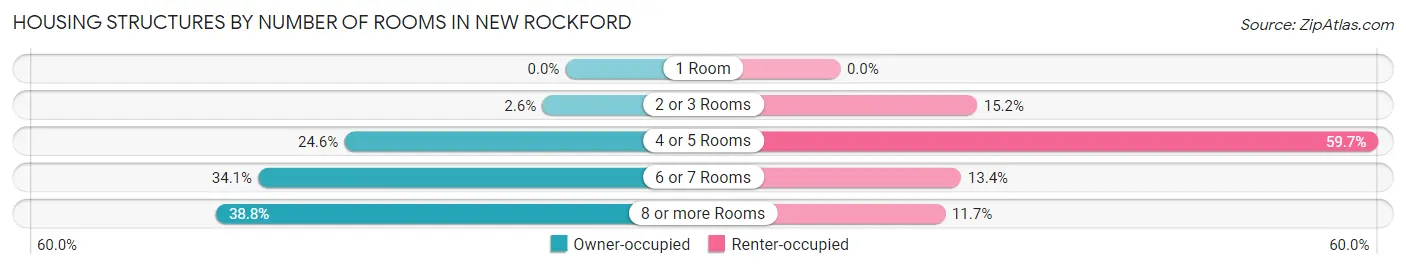
| Number of Rooms | Owner-occupied | Renter-occupied |
| 1 Room | 0 (0.0%) | 0 (0.0%) |
| 2 or 3 Rooms | 10 (2.6%) | 43 (15.2%) |
| 4 or 5 Rooms | 95 (24.5%) | 169 (59.7%) |
| 6 or 7 Rooms | 132 (34.1%) | 38 (13.4%) |
| 8 or more Rooms | 150 (38.8%) | 33 (11.7%) |
| Total | 387 (100.0%) | 283 (100.0%) |
Housing Structure by Heating Type in New Rockford
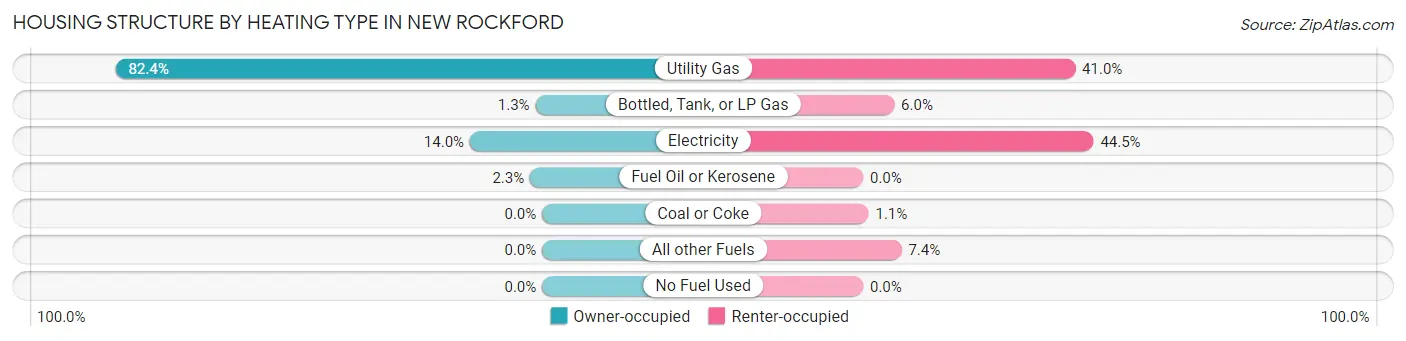
| Heating Type | Owner-occupied | Renter-occupied |
| Utility Gas | 319 (82.4%) | 116 (41.0%) |
| Bottled, Tank, or LP Gas | 5 (1.3%) | 17 (6.0%) |
| Electricity | 54 (14.0%) | 126 (44.5%) |
| Fuel Oil or Kerosene | 9 (2.3%) | 0 (0.0%) |
| Coal or Coke | 0 (0.0%) | 3 (1.1%) |
| All other Fuels | 0 (0.0%) | 21 (7.4%) |
| No Fuel Used | 0 (0.0%) | 0 (0.0%) |
| Total | 387 (100.0%) | 283 (100.0%) |
Household Vehicle Usage in New Rockford
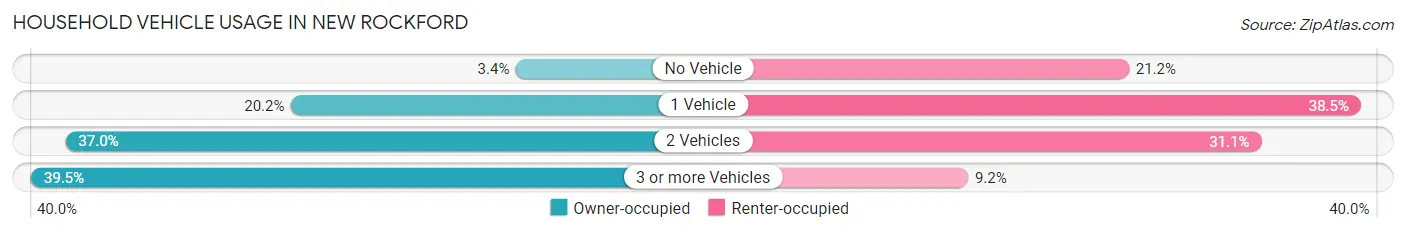
| Vehicles per Household | Owner-occupied | Renter-occupied |
| No Vehicle | 13 (3.4%) | 60 (21.2%) |
| 1 Vehicle | 78 (20.2%) | 109 (38.5%) |
| 2 Vehicles | 143 (36.9%) | 88 (31.1%) |
| 3 or more Vehicles | 153 (39.5%) | 26 (9.2%) |
| Total | 387 (100.0%) | 283 (100.0%) |
Real Estate & Mortgages in New Rockford
Real Estate and Mortgage Overview in New Rockford
| Characteristic | Without Mortgage | With Mortgage |
| Housing Units | 201 | 186 |
| Median Property Value | $100,300 | $95,200 |
| Median Household Income | $37,750 | $16 |
| Monthly Housing Costs | $416 | $6 |
| Real Estate Taxes | $1,078 | $6 |
Property Value by Mortgage Status in New Rockford
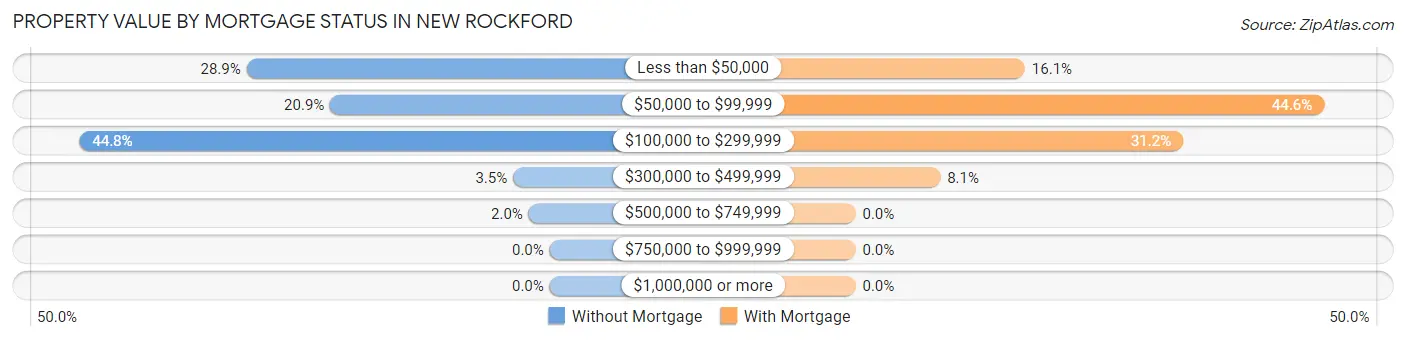
| Property Value | Without Mortgage | With Mortgage |
| Less than $50,000 | 58 (28.9%) | 30 (16.1%) |
| $50,000 to $99,999 | 42 (20.9%) | 83 (44.6%) |
| $100,000 to $299,999 | 90 (44.8%) | 58 (31.2%) |
| $300,000 to $499,999 | 7 (3.5%) | 15 (8.1%) |
| $500,000 to $749,999 | 4 (2.0%) | 0 (0.0%) |
| $750,000 to $999,999 | 0 (0.0%) | 0 (0.0%) |
| $1,000,000 or more | 0 (0.0%) | 0 (0.0%) |
| Total | 201 (100.0%) | 186 (100.0%) |
Household Income by Mortgage Status in New Rockford
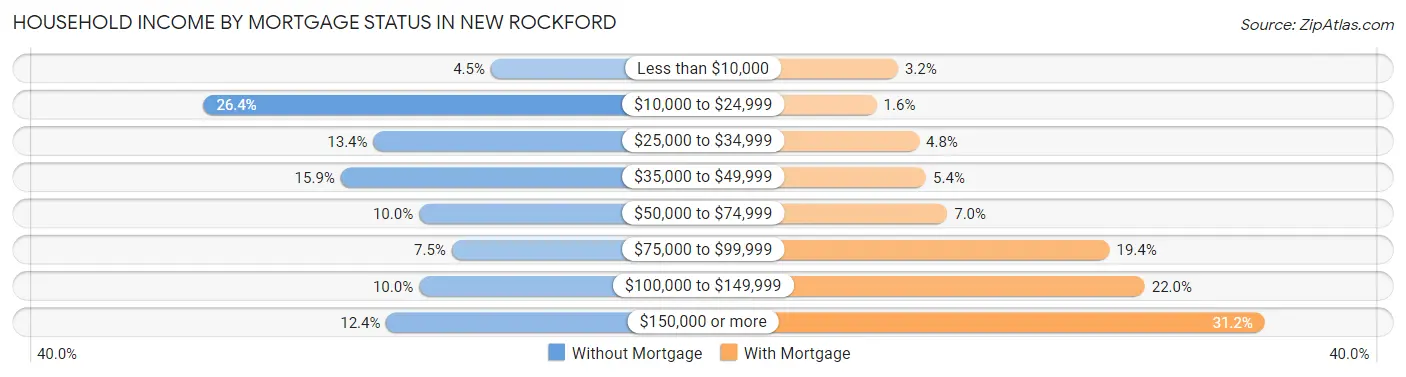
| Household Income | Without Mortgage | With Mortgage |
| Less than $10,000 | 9 (4.5%) | 6 (3.2%) |
| $10,000 to $24,999 | 53 (26.4%) | 3 (1.6%) |
| $25,000 to $34,999 | 27 (13.4%) | 9 (4.8%) |
| $35,000 to $49,999 | 32 (15.9%) | 10 (5.4%) |
| $50,000 to $74,999 | 20 (10.0%) | 13 (7.0%) |
| $75,000 to $99,999 | 15 (7.5%) | 36 (19.4%) |
| $100,000 to $149,999 | 20 (10.0%) | 41 (22.0%) |
| $150,000 or more | 25 (12.4%) | 58 (31.2%) |
| Total | 201 (100.0%) | 186 (100.0%) |
Property Value to Household Income Ratio in New Rockford
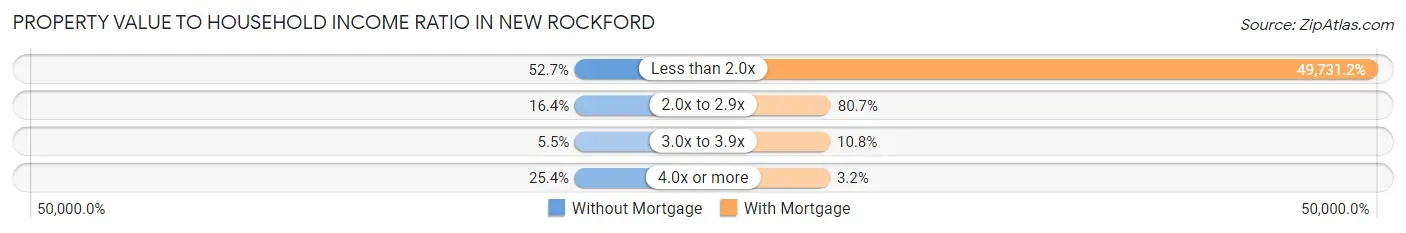
| Value-to-Income Ratio | Without Mortgage | With Mortgage |
| Less than 2.0x | 106 (52.7%) | 92,500 (49,731.2%) |
| 2.0x to 2.9x | 33 (16.4%) | 150 (80.6%) |
| 3.0x to 3.9x | 11 (5.5%) | 20 (10.7%) |
| 4.0x or more | 51 (25.4%) | 6 (3.2%) |
| Total | 201 (100.0%) | 186 (100.0%) |
Real Estate Taxes by Mortgage Status in New Rockford
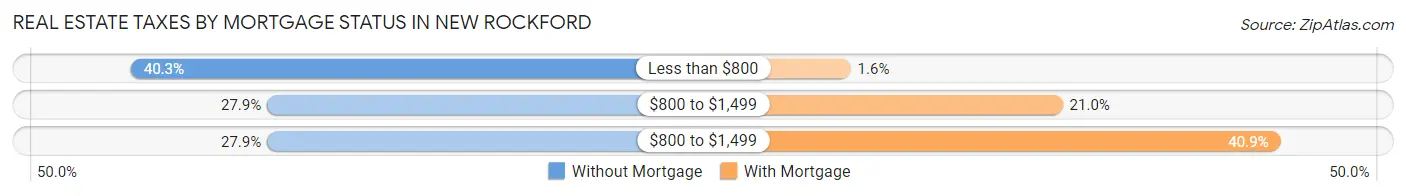
| Property Taxes | Without Mortgage | With Mortgage |
| Less than $800 | 81 (40.3%) | 3 (1.6%) |
| $800 to $1,499 | 56 (27.9%) | 39 (21.0%) |
| $800 to $1,499 | 56 (27.9%) | 76 (40.9%) |
| Total | 201 (100.0%) | 186 (100.0%) |
Health & Disability in New Rockford
Health Insurance Coverage by Age in New Rockford
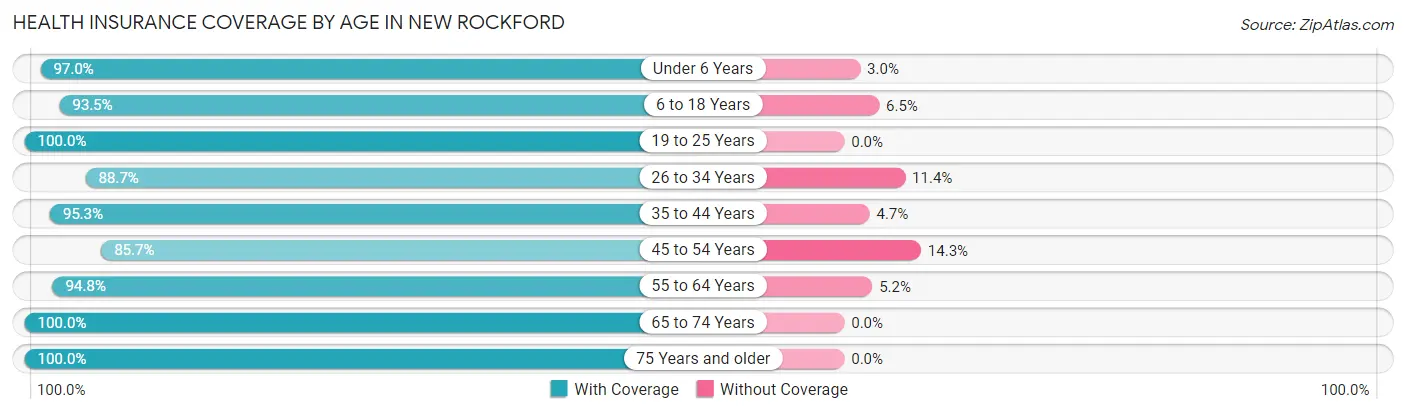
| Age Bracket | With Coverage | Without Coverage |
| Under 6 Years | 131 (97.0%) | 4 (3.0%) |
| 6 to 18 Years | 173 (93.5%) | 12 (6.5%) |
| 19 to 25 Years | 96 (100.0%) | 0 (0.0%) |
| 26 to 34 Years | 164 (88.6%) | 21 (11.4%) |
| 35 to 44 Years | 162 (95.3%) | 8 (4.7%) |
| 45 to 54 Years | 120 (85.7%) | 20 (14.3%) |
| 55 to 64 Years | 91 (94.8%) | 5 (5.2%) |
| 65 to 74 Years | 163 (100.0%) | 0 (0.0%) |
| 75 Years and older | 169 (100.0%) | 0 (0.0%) |
| Total | 1,269 (94.8%) | 70 (5.2%) |
Health Insurance Coverage by Citizenship Status in New Rockford

| Citizenship Status | With Coverage | Without Coverage |
| Native Born | 131 (97.0%) | 4 (3.0%) |
| Foreign Born, Citizen | 173 (93.5%) | 12 (6.5%) |
| Foreign Born, not a Citizen | 96 (100.0%) | 0 (0.0%) |
Health Insurance Coverage by Household Income in New Rockford
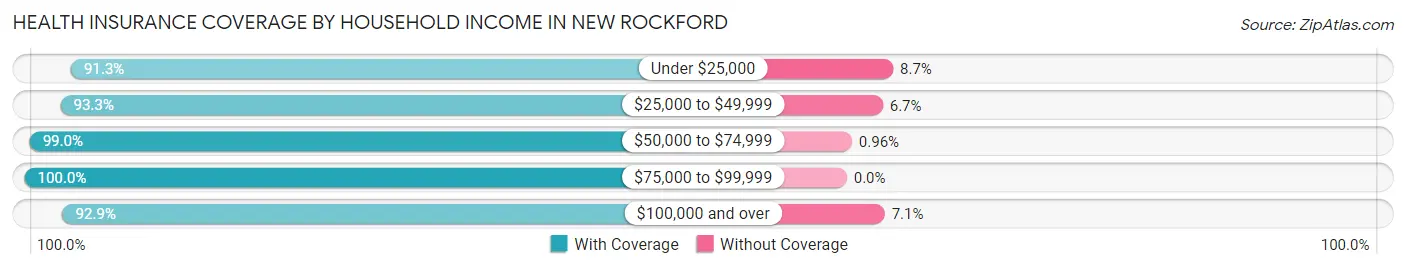
| Household Income | With Coverage | Without Coverage |
| Under $25,000 | 200 (91.3%) | 19 (8.7%) |
| $25,000 to $49,999 | 332 (93.3%) | 24 (6.7%) |
| $50,000 to $74,999 | 207 (99.0%) | 2 (1.0%) |
| $75,000 to $99,999 | 184 (100.0%) | 0 (0.0%) |
| $100,000 and over | 327 (92.9%) | 25 (7.1%) |
Public vs Private Health Insurance Coverage by Age in New Rockford
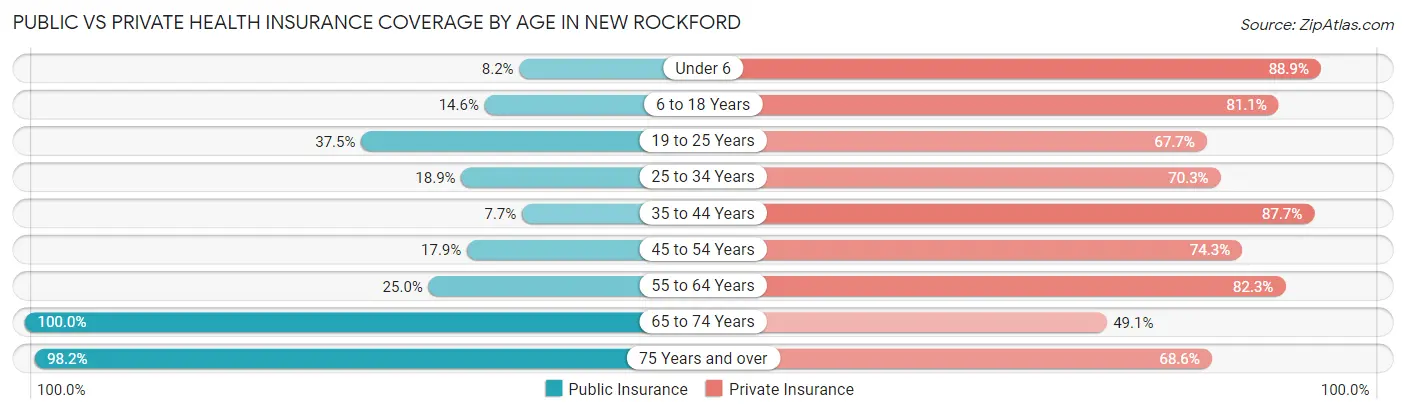
| Age Bracket | Public Insurance | Private Insurance |
| Under 6 | 11 (8.2%) | 120 (88.9%) |
| 6 to 18 Years | 27 (14.6%) | 150 (81.1%) |
| 19 to 25 Years | 36 (37.5%) | 65 (67.7%) |
| 25 to 34 Years | 35 (18.9%) | 130 (70.3%) |
| 35 to 44 Years | 13 (7.6%) | 149 (87.6%) |
| 45 to 54 Years | 25 (17.9%) | 104 (74.3%) |
| 55 to 64 Years | 24 (25.0%) | 79 (82.3%) |
| 65 to 74 Years | 163 (100.0%) | 80 (49.1%) |
| 75 Years and over | 166 (98.2%) | 116 (68.6%) |
| Total | 500 (37.3%) | 993 (74.2%) |
Disability Status by Sex by Age in New Rockford
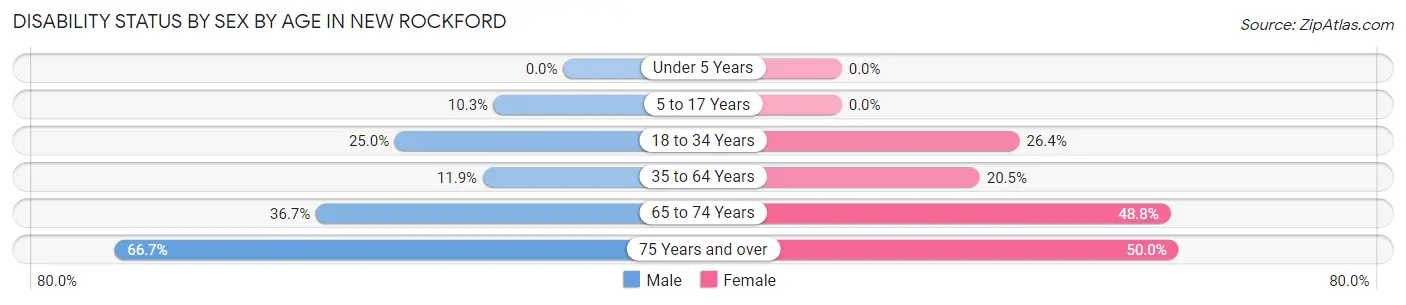
| Age Bracket | Male | Female |
| Under 5 Years | 0 (0.0%) | 0 (0.0%) |
| 5 to 17 Years | 10 (10.3%) | 0 (0.0%) |
| 18 to 34 Years | 37 (25.0%) | 38 (26.4%) |
| 35 to 64 Years | 24 (11.9%) | 42 (20.5%) |
| 65 to 74 Years | 29 (36.7%) | 41 (48.8%) |
| 75 Years and over | 50 (66.7%) | 47 (50.0%) |
Disability Class by Sex by Age in New Rockford
Disability Class: Hearing Difficulty
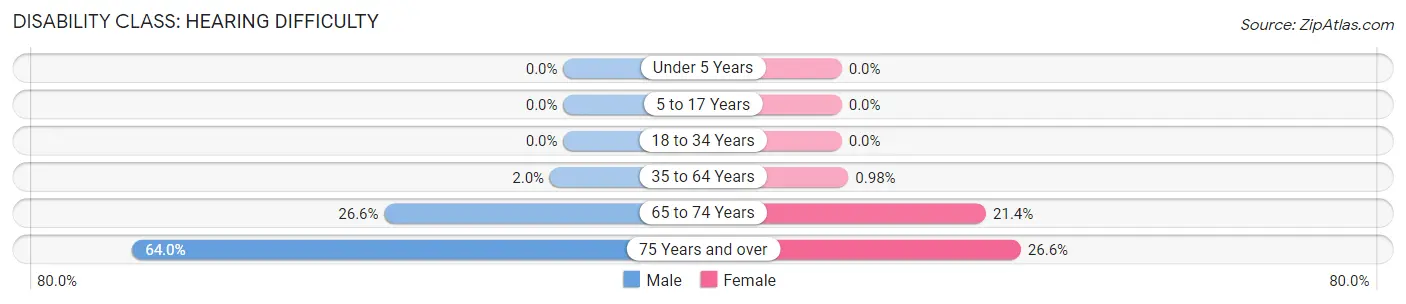
| Age Bracket | Male | Female |
| Under 5 Years | 0 (0.0%) | 0 (0.0%) |
| 5 to 17 Years | 0 (0.0%) | 0 (0.0%) |
| 18 to 34 Years | 0 (0.0%) | 0 (0.0%) |
| 35 to 64 Years | 4 (2.0%) | 2 (1.0%) |
| 65 to 74 Years | 21 (26.6%) | 18 (21.4%) |
| 75 Years and over | 48 (64.0%) | 25 (26.6%) |
Disability Class: Vision Difficulty
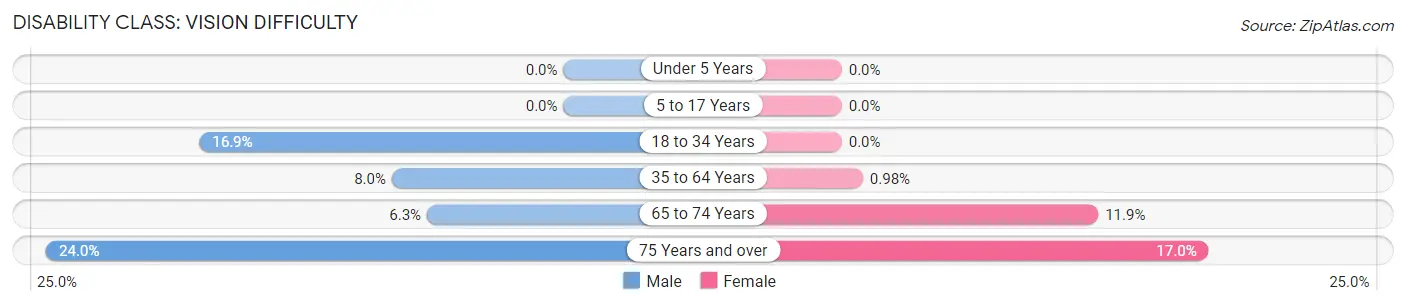
| Age Bracket | Male | Female |
| Under 5 Years | 0 (0.0%) | 0 (0.0%) |
| 5 to 17 Years | 0 (0.0%) | 0 (0.0%) |
| 18 to 34 Years | 25 (16.9%) | 0 (0.0%) |
| 35 to 64 Years | 16 (8.0%) | 2 (1.0%) |
| 65 to 74 Years | 5 (6.3%) | 10 (11.9%) |
| 75 Years and over | 18 (24.0%) | 16 (17.0%) |
Disability Class: Cognitive Difficulty
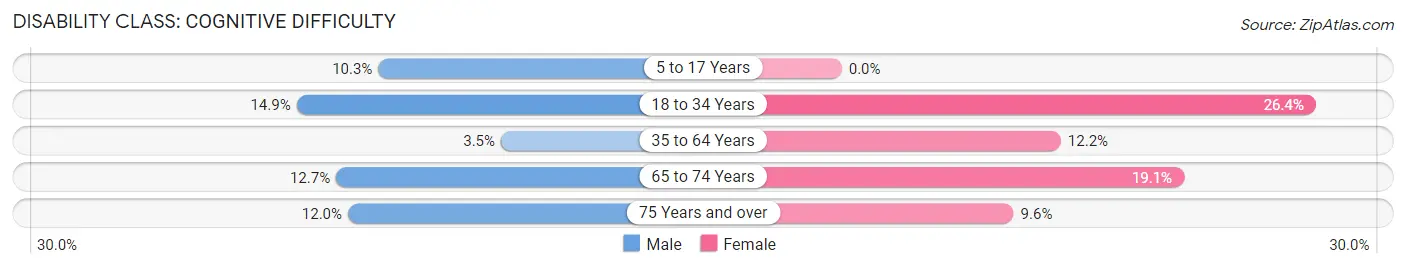
| Age Bracket | Male | Female |
| 5 to 17 Years | 10 (10.3%) | 0 (0.0%) |
| 18 to 34 Years | 22 (14.9%) | 38 (26.4%) |
| 35 to 64 Years | 7 (3.5%) | 25 (12.2%) |
| 65 to 74 Years | 10 (12.7%) | 16 (19.1%) |
| 75 Years and over | 9 (12.0%) | 9 (9.6%) |
Disability Class: Ambulatory Difficulty
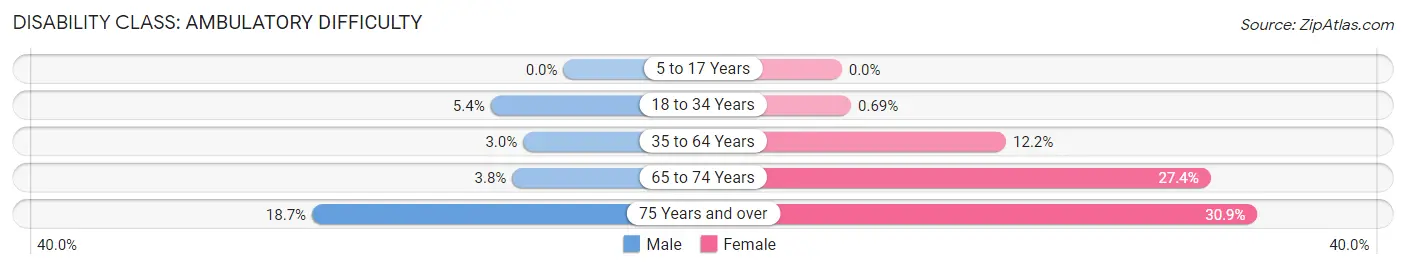
| Age Bracket | Male | Female |
| 5 to 17 Years | 0 (0.0%) | 0 (0.0%) |
| 18 to 34 Years | 8 (5.4%) | 1 (0.7%) |
| 35 to 64 Years | 6 (3.0%) | 25 (12.2%) |
| 65 to 74 Years | 3 (3.8%) | 23 (27.4%) |
| 75 Years and over | 14 (18.7%) | 29 (30.8%) |
Disability Class: Self-Care Difficulty
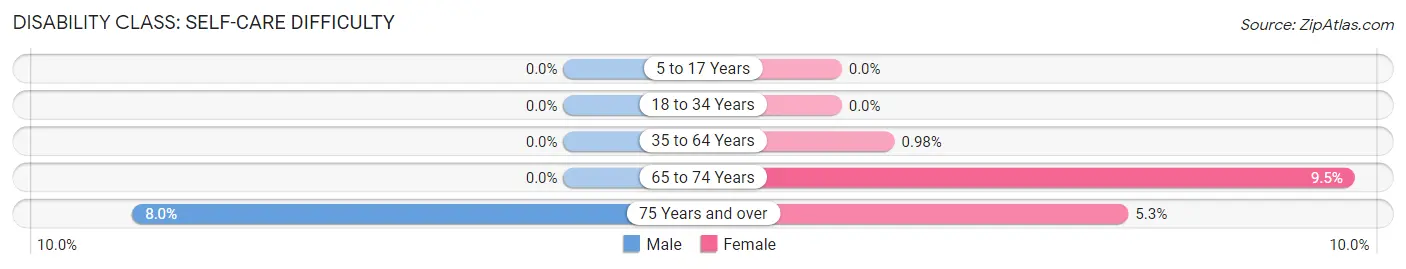
| Age Bracket | Male | Female |
| 5 to 17 Years | 0 (0.0%) | 0 (0.0%) |
| 18 to 34 Years | 0 (0.0%) | 0 (0.0%) |
| 35 to 64 Years | 0 (0.0%) | 2 (1.0%) |
| 65 to 74 Years | 0 (0.0%) | 8 (9.5%) |
| 75 Years and over | 6 (8.0%) | 5 (5.3%) |
Technology Access in New Rockford
Computing Device Access in New Rockford
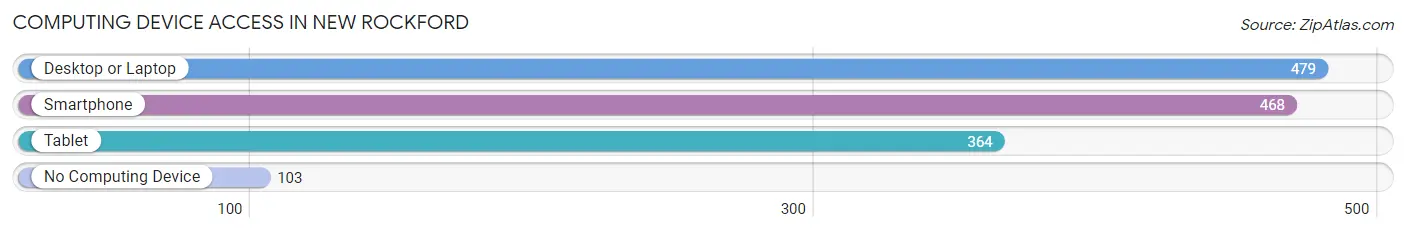
| Device Type | # Households | % Households |
| Desktop or Laptop | 479 | 71.5% |
| Smartphone | 468 | 69.9% |
| Tablet | 364 | 54.3% |
| No Computing Device | 103 | 15.4% |
| Total | 670 | 100.0% |
Internet Access in New Rockford
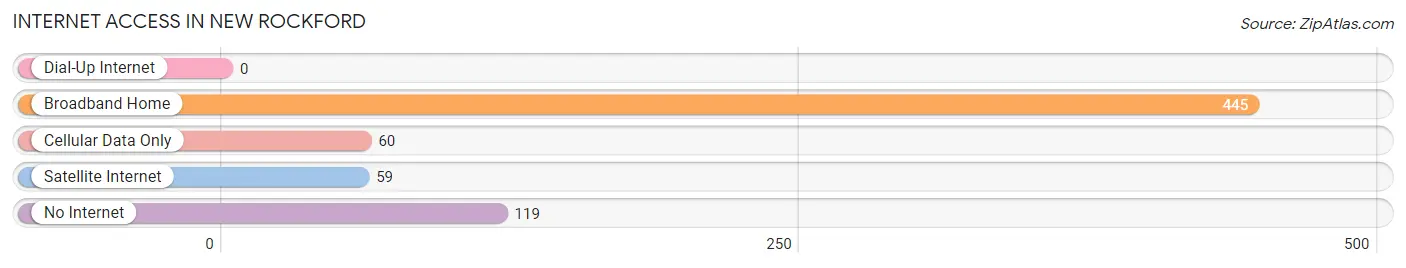
| Internet Type | # Households | % Households |
| Dial-Up Internet | 0 | 0.0% |
| Broadband Home | 445 | 66.4% |
| Cellular Data Only | 60 | 9.0% |
| Satellite Internet | 59 | 8.8% |
| No Internet | 119 | 17.8% |
| Total | 670 | 100.0% |
New Rockford Summary
Rockford, North Dakota is a small city located in Eddy County, in the north-central part of the state. It is situated on the banks of the Sheyenne River, and is the county seat of Eddy County. The city was founded in 1883, and was named after Rockford, Illinois. The population of Rockford was 1,541 at the 2010 census.
Geography
Rockford is located at 47°25'25" North, 98°25'45" West (47.423, -98.429). According to the United States Census Bureau, the city has a total area of 0.9 square miles (2.3 km2), all of it land.
The city is located in the Sheyenne River Valley, and is surrounded by rolling hills and prairies. The Sheyenne River flows through the city, and is a popular spot for fishing and boating.
Climate
Rockford has a humid continental climate, with cold winters and hot summers. The average annual temperature is 45.3°F (7.4°C). The average annual precipitation is 19.3 inches (490 mm).
Demographics
As of the 2010 census, there were 1,541 people, 645 households, and 393 families residing in the city. The population density was 1,717.2 people per square mile (662.2/km2). There were 717 housing units at an average density of 803.3 per square mile (310.2/km2). The racial makeup of the city was 97.2% White, 0.3% African American, 0.3% Native American, 0.3% Asian, 0.1% Pacific Islander, 0.7% from other races, and 1.2% from two or more races. Hispanic or Latino of any race were 1.7% of the population.
Economy
Rockford's economy is largely based on agriculture and manufacturing. The city is home to several large grain elevators, and is a major center for the production of wheat, barley, and other grains. The city is also home to several manufacturing companies, including a furniture factory, a plastics factory, and a metal fabrication plant.
The city is also home to several retail stores, restaurants, and other businesses. The city is served by the Rockford Public Library, and is home to the Rockford Area Historical Society.
Education
Rockford is served by the Rockford Public School District, which includes Rockford Elementary School, Rockford Middle School, and Rockford High School. The city is also home to the Rockford Bible College, a private Christian college.
Conclusion
Rockford, North Dakota is a small city located in Eddy County, in the north-central part of the state. It is situated on the banks of the Sheyenne River, and is the county seat of Eddy County. The city was founded in 1883, and was named after Rockford, Illinois. The population of Rockford was 1,541 at the 2010 census. The city's economy is largely based on agriculture and manufacturing, and is home to several retail stores, restaurants, and other businesses. The city is served by the Rockford Public School District, and is home to the Rockford Bible College.
Common Questions
What is Per Capita Income in New Rockford?
Per Capita income in New Rockford is $30,706.
What is the Median Family Income in New Rockford?
Median Family Income in New Rockford is $75,625.
What is the Median Household income in New Rockford?
Median Household Income in New Rockford is $38,393.
What is Income or Wage Gap in New Rockford?
Income or Wage Gap in New Rockford is 7.4%.
Women in New Rockford earn 92.6 cents for every dollar earned by a man.
What is Family Income Deficit in New Rockford?
Family Income Deficit in New Rockford is $12,265.
Families that are below poverty line in New Rockford earn $12,265 less on average than the poverty threshold level.
What is Inequality or Gini Index in New Rockford?
Inequality or Gini Index in New Rockford is 0.45.
What is the Total Population of New Rockford?
Total Population of New Rockford is 1,421.
What is the Total Male Population of New Rockford?
Total Male Population of New Rockford is 703.
What is the Total Female Population of New Rockford?
Total Female Population of New Rockford is 718.
What is the Ratio of Males per 100 Females in New Rockford?
There are 97.91 Males per 100 Females in New Rockford.
What is the Ratio of Females per 100 Males in New Rockford?
There are 102.13 Females per 100 Males in New Rockford.
What is the Median Population Age in New Rockford?
Median Population Age in New Rockford is 39.8 Years.
What is the Average Family Size in New Rockford
Average Family Size in New Rockford is 3.0 People.
What is the Average Household Size in New Rockford
Average Household Size in New Rockford is 2.0 People.
How Large is the Labor Force in New Rockford?
There are 711 People in the Labor Forcein in New Rockford.
What is the Percentage of People in the Labor Force in New Rockford?
61.6% of People are in the Labor Force in New Rockford.
What is the Unemployment Rate in New Rockford?
Unemployment Rate in New Rockford is 3.0%.