Zip Codes with the Highest Percentage of Population Employed in Accommodation & Food Services in Cape Girardeau, MO
RELATED REPORTS & OPTIONS
Accommodation & Food Services
Cape Girardeau
Compare Zip Codes
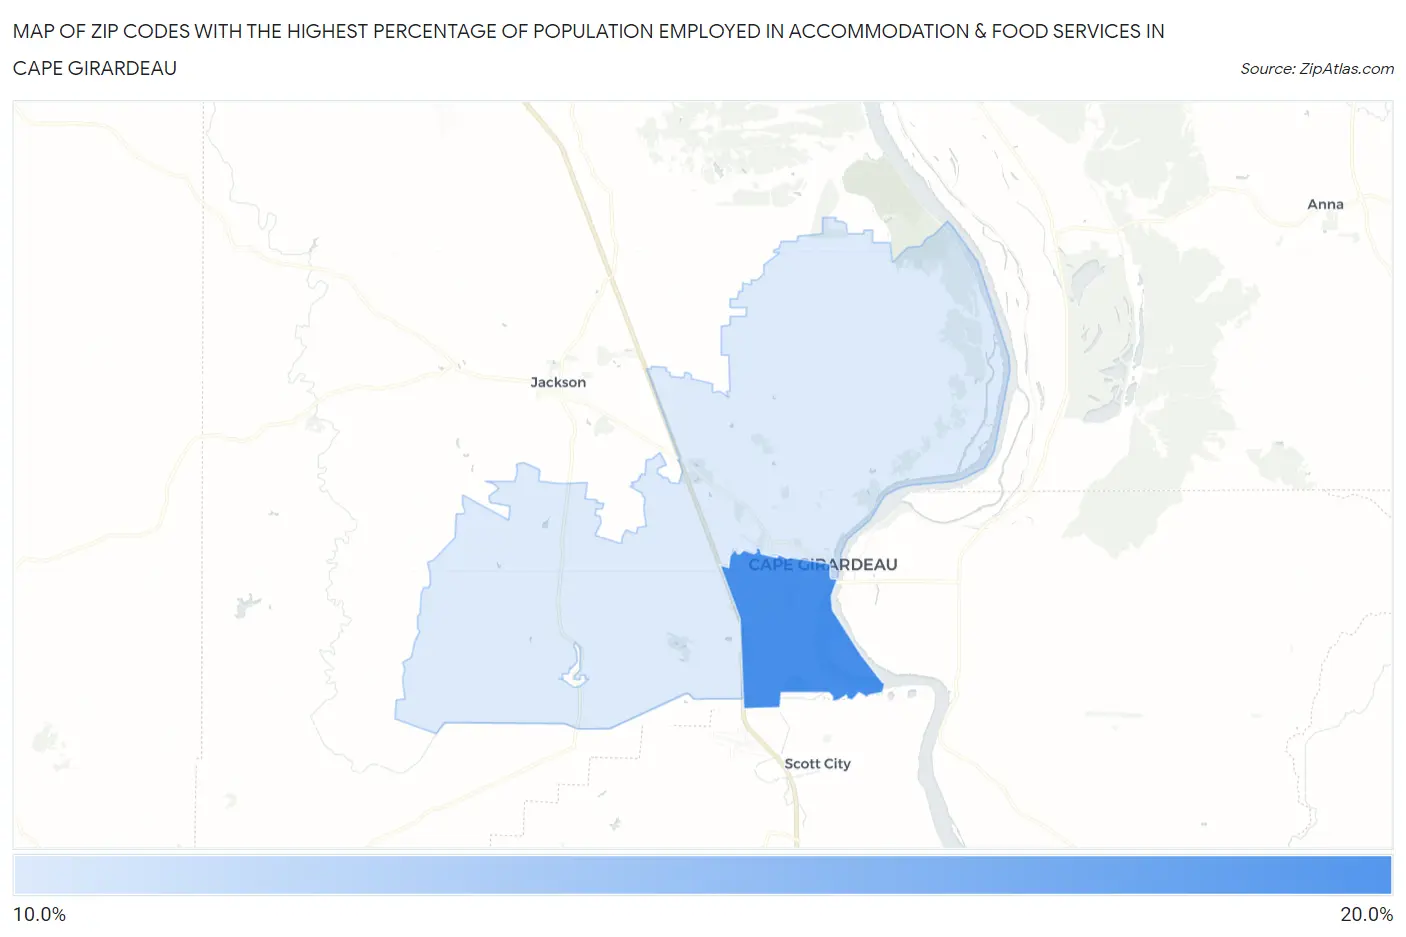
Map of Zip Codes with the Highest Percentage of Population Employed in Accommodation & Food Services in Cape Girardeau
11.1%
16.2%
Zip Codes with the Highest Percentage of Population Employed in Accommodation & Food Services in Cape Girardeau, MO
| Zip Code | % Employed | vs State | vs National | |
| 1. | 63703 | 16.2% | 6.6%(+9.58)#47 | 6.9%(+9.28)#1,416 |
| 2. | 63701 | 11.1% | 6.6%(+4.54)#100 | 6.9%(+4.23)#3,476 |
1
Common Questions
What are the Top Zip Codes with the Highest Percentage of Population Employed in Accommodation & Food Services in Cape Girardeau, MO?
Top Zip Codes with the Highest Percentage of Population Employed in Accommodation & Food Services in Cape Girardeau, MO are:
What zip code has the Highest Percentage of Population Employed in Accommodation & Food Services in Cape Girardeau, MO?
63703 has the Highest Percentage of Population Employed in Accommodation & Food Services in Cape Girardeau, MO with 16.2%.
What is the Percentage of Population Employed in Accommodation & Food Services in Cape Girardeau, MO?
Percentage of Population Employed in Accommodation & Food Services in Cape Girardeau is 13.1%.
What is the Percentage of Population Employed in Accommodation & Food Services in Missouri?
Percentage of Population Employed in Accommodation & Food Services in Missouri is 6.6%.
What is the Percentage of Population Employed in Accommodation & Food Services in the United States?
Percentage of Population Employed in Accommodation & Food Services in the United States is 6.9%.