Zip Codes with the Highest Percentage of Population Employed in Accommodation & Food Services in Jefferson City, MO
RELATED REPORTS & OPTIONS
Accommodation & Food Services
Jefferson City
Compare Zip Codes
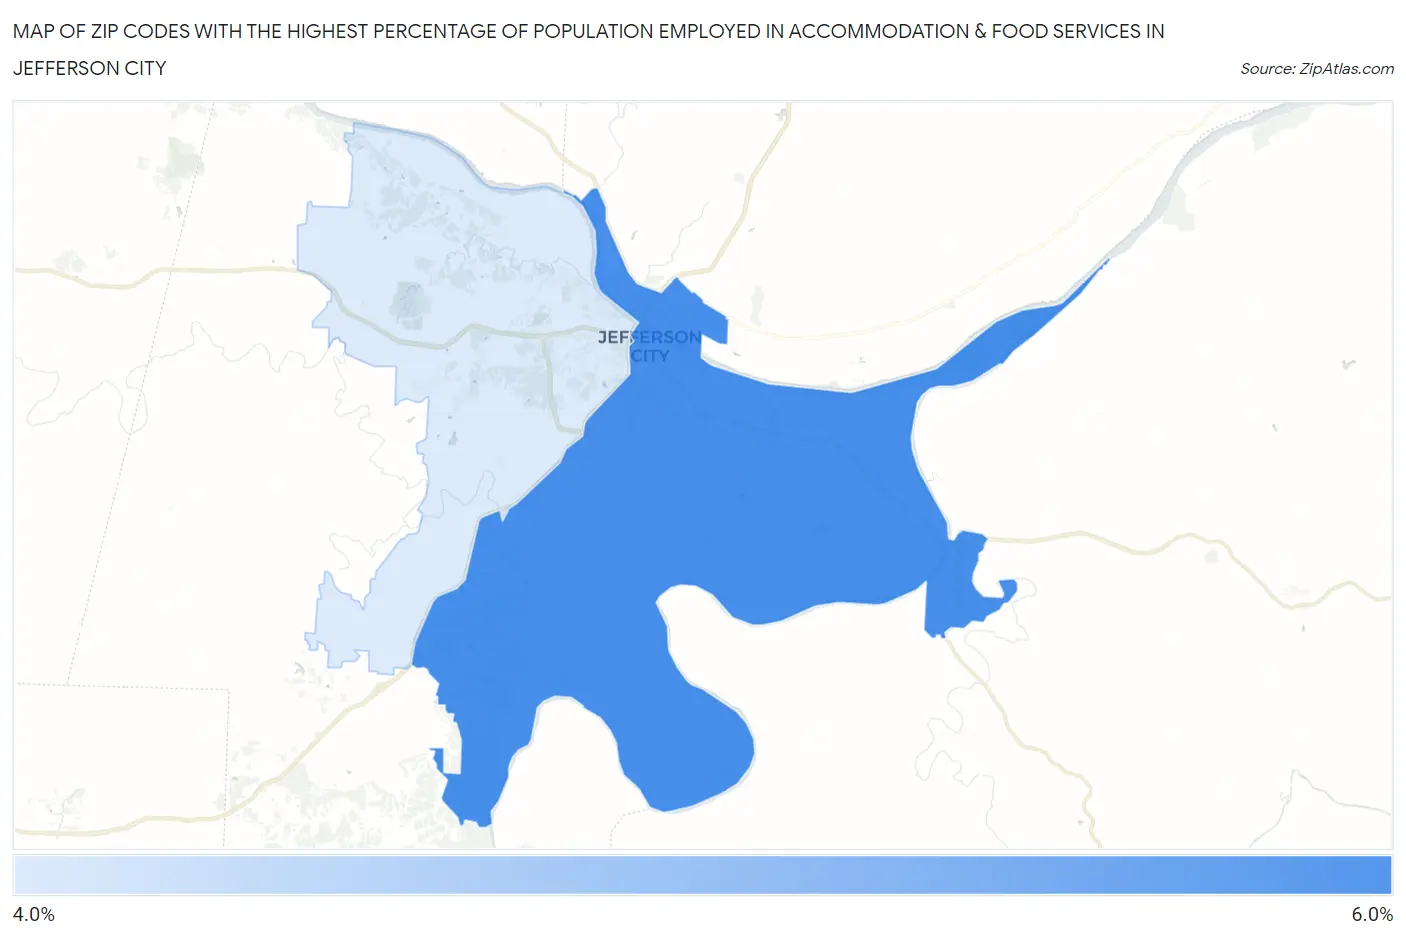
Map of Zip Codes with the Highest Percentage of Population Employed in Accommodation & Food Services in Jefferson City
4.5%
5.5%
Zip Codes with the Highest Percentage of Population Employed in Accommodation & Food Services in Jefferson City, MO
| Zip Code | % Employed | vs State | vs National | |
| 1. | 65101 | 5.5% | 6.6%(-1.10)#411 | 6.9%(-1.41)#15,133 |
| 2. | 65109 | 4.5% | 6.6%(-2.04)#502 | 6.9%(-2.34)#18,369 |
1
Common Questions
What are the Top Zip Codes with the Highest Percentage of Population Employed in Accommodation & Food Services in Jefferson City, MO?
Top Zip Codes with the Highest Percentage of Population Employed in Accommodation & Food Services in Jefferson City, MO are:
What zip code has the Highest Percentage of Population Employed in Accommodation & Food Services in Jefferson City, MO?
65101 has the Highest Percentage of Population Employed in Accommodation & Food Services in Jefferson City, MO with 5.5%.
What is the Percentage of Population Employed in Accommodation & Food Services in Jefferson City, MO?
Percentage of Population Employed in Accommodation & Food Services in Jefferson City is 6.0%.
What is the Percentage of Population Employed in Accommodation & Food Services in Missouri?
Percentage of Population Employed in Accommodation & Food Services in Missouri is 6.6%.
What is the Percentage of Population Employed in Accommodation & Food Services in the United States?
Percentage of Population Employed in Accommodation & Food Services in the United States is 6.9%.