Zip Codes with the Highest Percentage of Population Employed in Accommodation & Food Services in Saint Joseph, MO
RELATED REPORTS & OPTIONS
Accommodation & Food Services
Saint Joseph
Compare Zip Codes
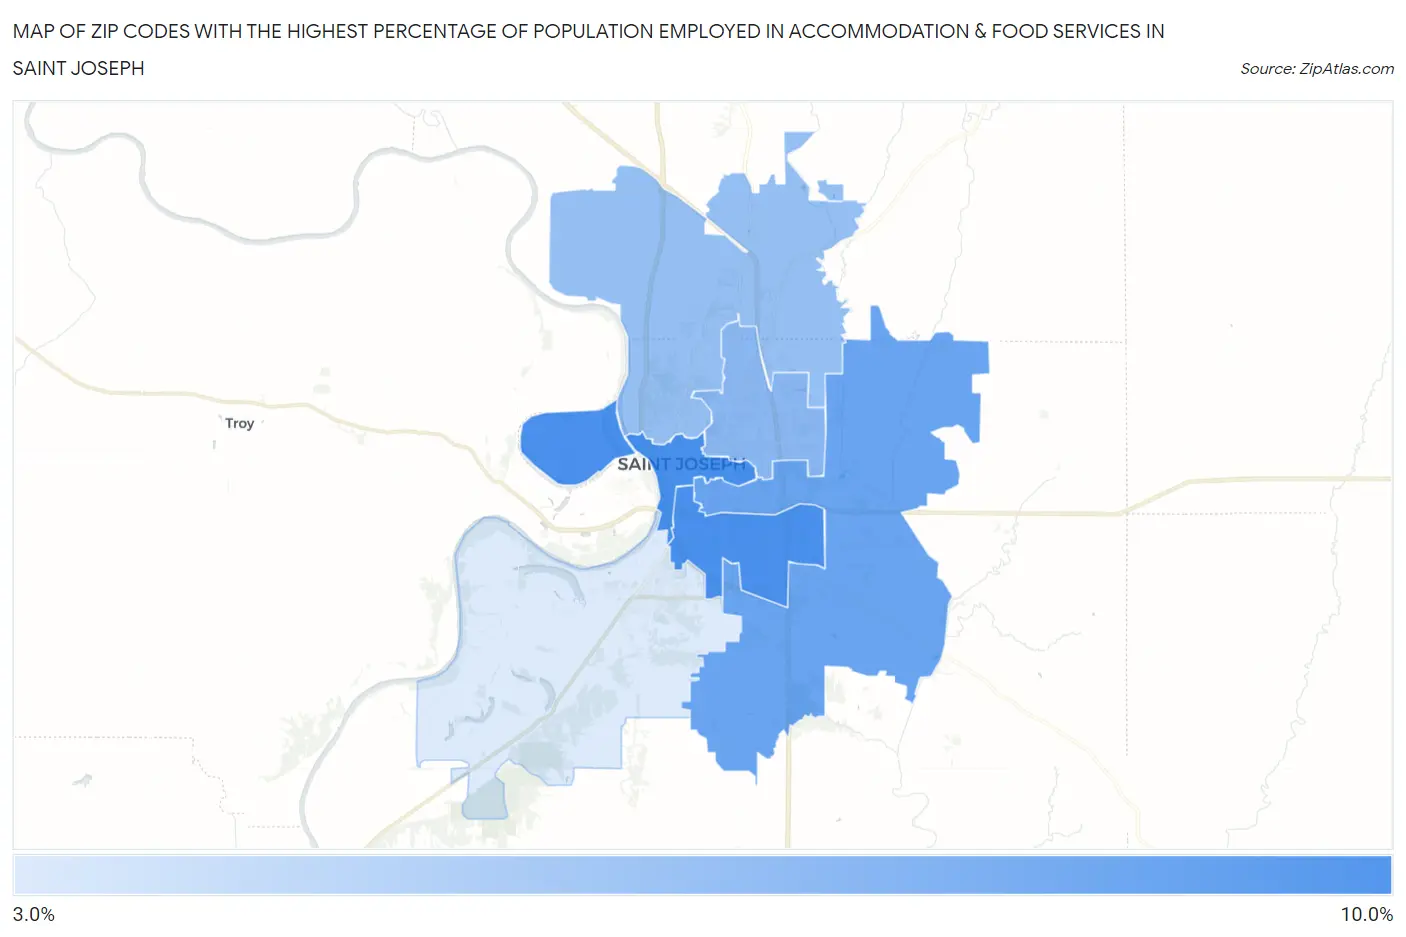
Map of Zip Codes with the Highest Percentage of Population Employed in Accommodation & Food Services in Saint Joseph
3.9%
8.5%
Zip Codes with the Highest Percentage of Population Employed in Accommodation & Food Services in Saint Joseph, MO
| Zip Code | % Employed | vs State | vs National | |
| 1. | 64501 | 8.5% | 6.6%(+1.95)#194 | 6.9%(+1.64)#6,782 |
| 2. | 64503 | 8.4% | 6.6%(+1.84)#198 | 6.9%(+1.54)#6,962 |
| 3. | 64507 | 7.5% | 6.6%(+0.893)#247 | 6.9%(+0.587)#9,064 |
| 4. | 64506 | 6.4% | 6.6%(-0.129)#320 | 6.9%(-0.435)#12,015 |
| 5. | 64505 | 6.0% | 6.6%(-0.533)#360 | 6.9%(-0.840)#13,328 |
| 6. | 64504 | 3.9% | 6.6%(-2.70)#567 | 6.9%(-3.00)#20,554 |
1
Common Questions
What are the Top 5 Zip Codes with the Highest Percentage of Population Employed in Accommodation & Food Services in Saint Joseph, MO?
Top 5 Zip Codes with the Highest Percentage of Population Employed in Accommodation & Food Services in Saint Joseph, MO are:
What zip code has the Highest Percentage of Population Employed in Accommodation & Food Services in Saint Joseph, MO?
64501 has the Highest Percentage of Population Employed in Accommodation & Food Services in Saint Joseph, MO with 8.5%.
What is the Percentage of Population Employed in Accommodation & Food Services in Missouri?
Percentage of Population Employed in Accommodation & Food Services in Missouri is 6.6%.
What is the Percentage of Population Employed in Accommodation & Food Services in the United States?
Percentage of Population Employed in Accommodation & Food Services in the United States is 6.9%.