Zip Codes with the Highest Percentage of Population Employed in Accommodation & Food Services in Farmington, MI
RELATED REPORTS & OPTIONS
Accommodation & Food Services
Farmington
Compare Zip Codes
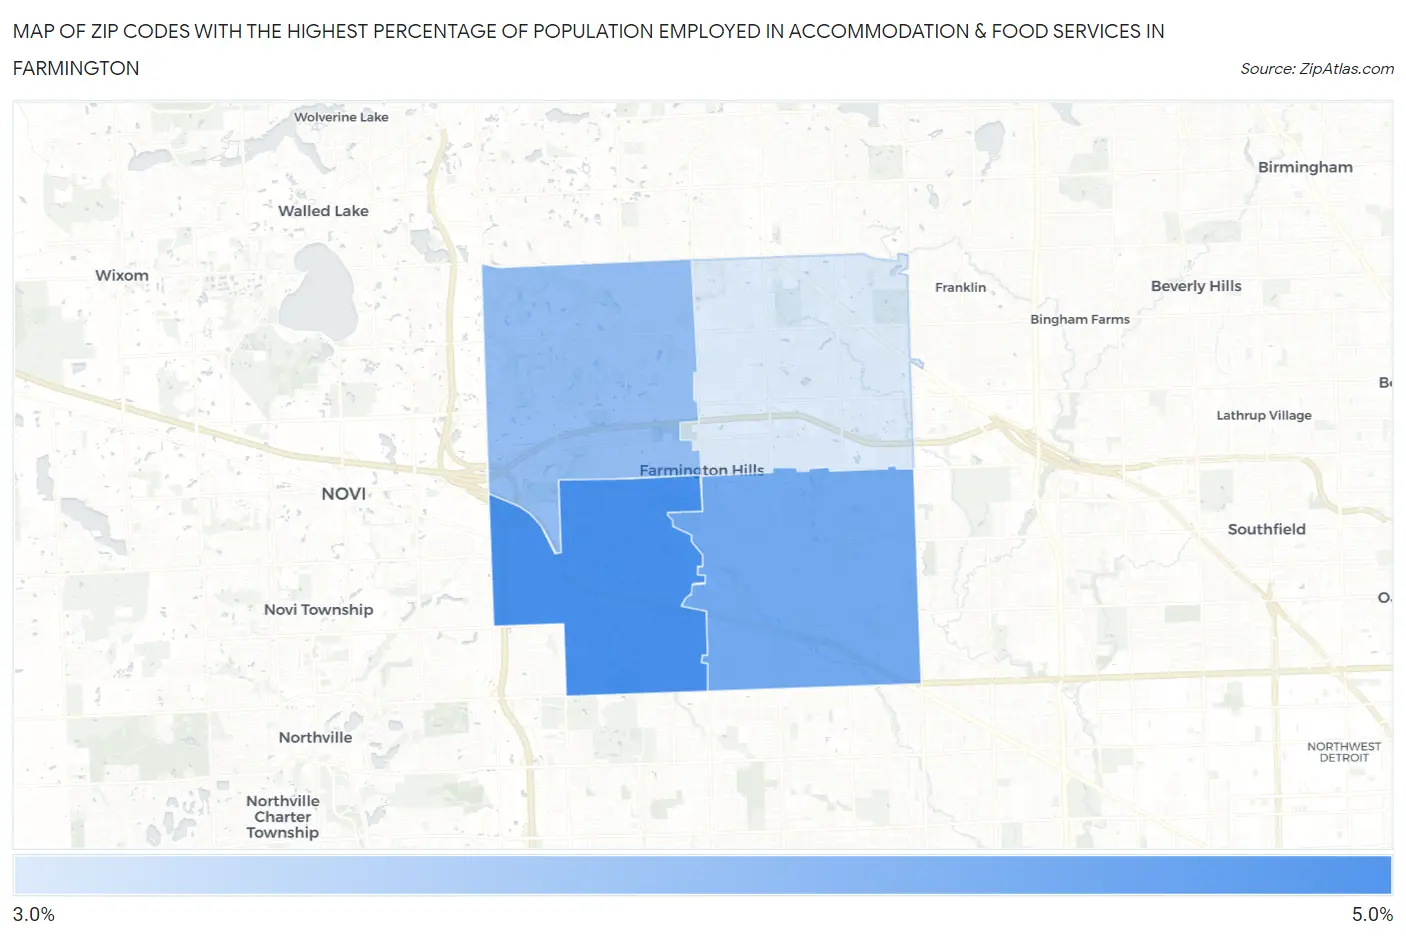
Map of Zip Codes with the Highest Percentage of Population Employed in Accommodation & Food Services in Farmington
3.5%
4.8%
Zip Codes with the Highest Percentage of Population Employed in Accommodation & Food Services in Farmington, MI
| Zip Code | % Employed | vs State | vs National | |
| 1. | 48335 | 4.8% | 7.1%(-2.26)#685 | 6.9%(-2.05)#17,397 |
| 2. | 48336 | 4.4% | 7.1%(-2.65)#725 | 6.9%(-2.45)#18,733 |
| 3. | 48331 | 4.2% | 7.1%(-2.93)#750 | 6.9%(-2.73)#19,659 |
| 4. | 48334 | 3.5% | 7.1%(-3.60)#815 | 6.9%(-3.39)#21,822 |
1
Common Questions
What are the Top 3 Zip Codes with the Highest Percentage of Population Employed in Accommodation & Food Services in Farmington, MI?
Top 3 Zip Codes with the Highest Percentage of Population Employed in Accommodation & Food Services in Farmington, MI are:
What zip code has the Highest Percentage of Population Employed in Accommodation & Food Services in Farmington, MI?
48335 has the Highest Percentage of Population Employed in Accommodation & Food Services in Farmington, MI with 4.8%.
What is the Percentage of Population Employed in Accommodation & Food Services in Farmington, MI?
Percentage of Population Employed in Accommodation & Food Services in Farmington is 1.7%.
What is the Percentage of Population Employed in Accommodation & Food Services in Michigan?
Percentage of Population Employed in Accommodation & Food Services in Michigan is 7.1%.
What is the Percentage of Population Employed in Accommodation & Food Services in the United States?
Percentage of Population Employed in Accommodation & Food Services in the United States is 6.9%.