Zip Codes with the Highest Percentage of Population Employed in Accommodation & Food Services in Utica, MI
RELATED REPORTS & OPTIONS
Accommodation & Food Services
Utica
Compare Zip Codes
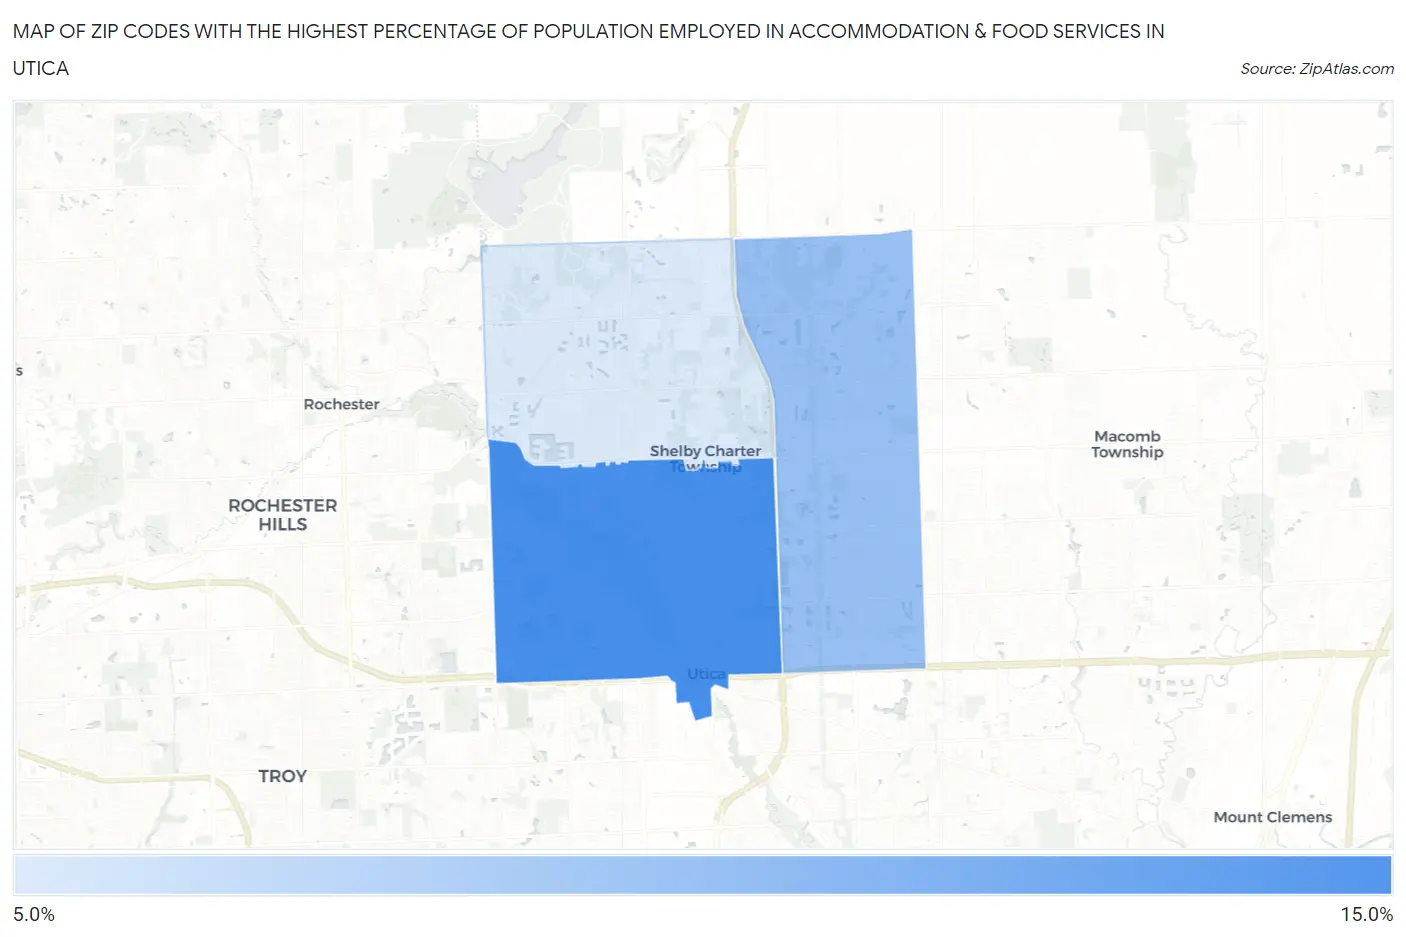
Map of Zip Codes with the Highest Percentage of Population Employed in Accommodation & Food Services in Utica
6.7%
11.0%
Zip Codes with the Highest Percentage of Population Employed in Accommodation & Food Services in Utica, MI
| Zip Code | % Employed | vs State | vs National | |
| 1. | 48317 | 11.0% | 7.1%(+3.95)#96 | 6.9%(+4.16)#3,522 |
| 2. | 48315 | 8.7% | 7.1%(+1.61)#234 | 6.9%(+1.81)#6,490 |
| 3. | 48316 | 6.7% | 7.1%(-0.422)#430 | 6.9%(-0.220)#11,324 |
1
Common Questions
What are the Top Zip Codes with the Highest Percentage of Population Employed in Accommodation & Food Services in Utica, MI?
Top Zip Codes with the Highest Percentage of Population Employed in Accommodation & Food Services in Utica, MI are:
What zip code has the Highest Percentage of Population Employed in Accommodation & Food Services in Utica, MI?
48317 has the Highest Percentage of Population Employed in Accommodation & Food Services in Utica, MI with 11.0%.
What is the Percentage of Population Employed in Accommodation & Food Services in Utica, MI?
Percentage of Population Employed in Accommodation & Food Services in Utica is 8.1%.
What is the Percentage of Population Employed in Accommodation & Food Services in Michigan?
Percentage of Population Employed in Accommodation & Food Services in Michigan is 7.1%.
What is the Percentage of Population Employed in Accommodation & Food Services in the United States?
Percentage of Population Employed in Accommodation & Food Services in the United States is 6.9%.