Zip Codes with the Highest Percentage of Population Employed in Accommodation & Food Services in Royal Oak, MI
RELATED REPORTS & OPTIONS
Accommodation & Food Services
Royal Oak
Compare Zip Codes
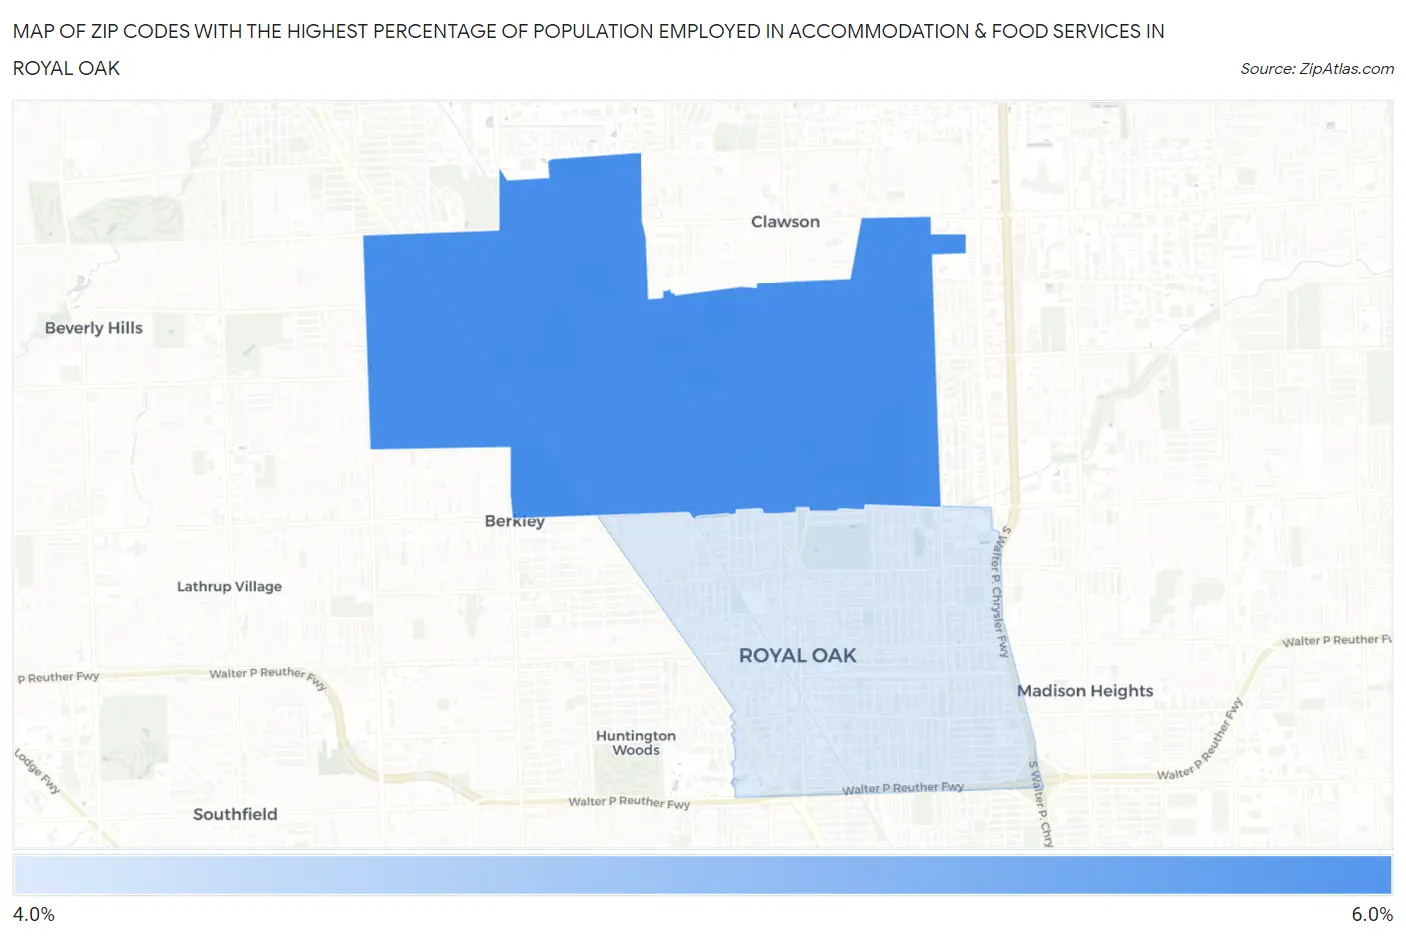
Map of Zip Codes with the Highest Percentage of Population Employed in Accommodation & Food Services in Royal Oak
4.5%
5.2%
Zip Codes with the Highest Percentage of Population Employed in Accommodation & Food Services in Royal Oak, MI
| Zip Code | % Employed | vs State | vs National | |
| 1. | 48073 | 5.2% | 7.1%(-1.88)#634 | 6.9%(-1.68)#16,111 |
| 2. | 48067 | 4.5% | 7.1%(-2.55)#707 | 6.9%(-2.35)#18,399 |
1
Common Questions
What are the Top Zip Codes with the Highest Percentage of Population Employed in Accommodation & Food Services in Royal Oak, MI?
Top Zip Codes with the Highest Percentage of Population Employed in Accommodation & Food Services in Royal Oak, MI are:
What zip code has the Highest Percentage of Population Employed in Accommodation & Food Services in Royal Oak, MI?
48073 has the Highest Percentage of Population Employed in Accommodation & Food Services in Royal Oak, MI with 5.2%.
What is the Percentage of Population Employed in Accommodation & Food Services in Royal Oak, MI?
Percentage of Population Employed in Accommodation & Food Services in Royal Oak is 4.9%.
What is the Percentage of Population Employed in Accommodation & Food Services in Michigan?
Percentage of Population Employed in Accommodation & Food Services in Michigan is 7.1%.
What is the Percentage of Population Employed in Accommodation & Food Services in the United States?
Percentage of Population Employed in Accommodation & Food Services in the United States is 6.9%.