Zip Codes with the Highest Percentage of Population Employed in Accommodation & Food Services in Waterford, MI
RELATED REPORTS & OPTIONS
Accommodation & Food Services
Waterford
Compare Zip Codes
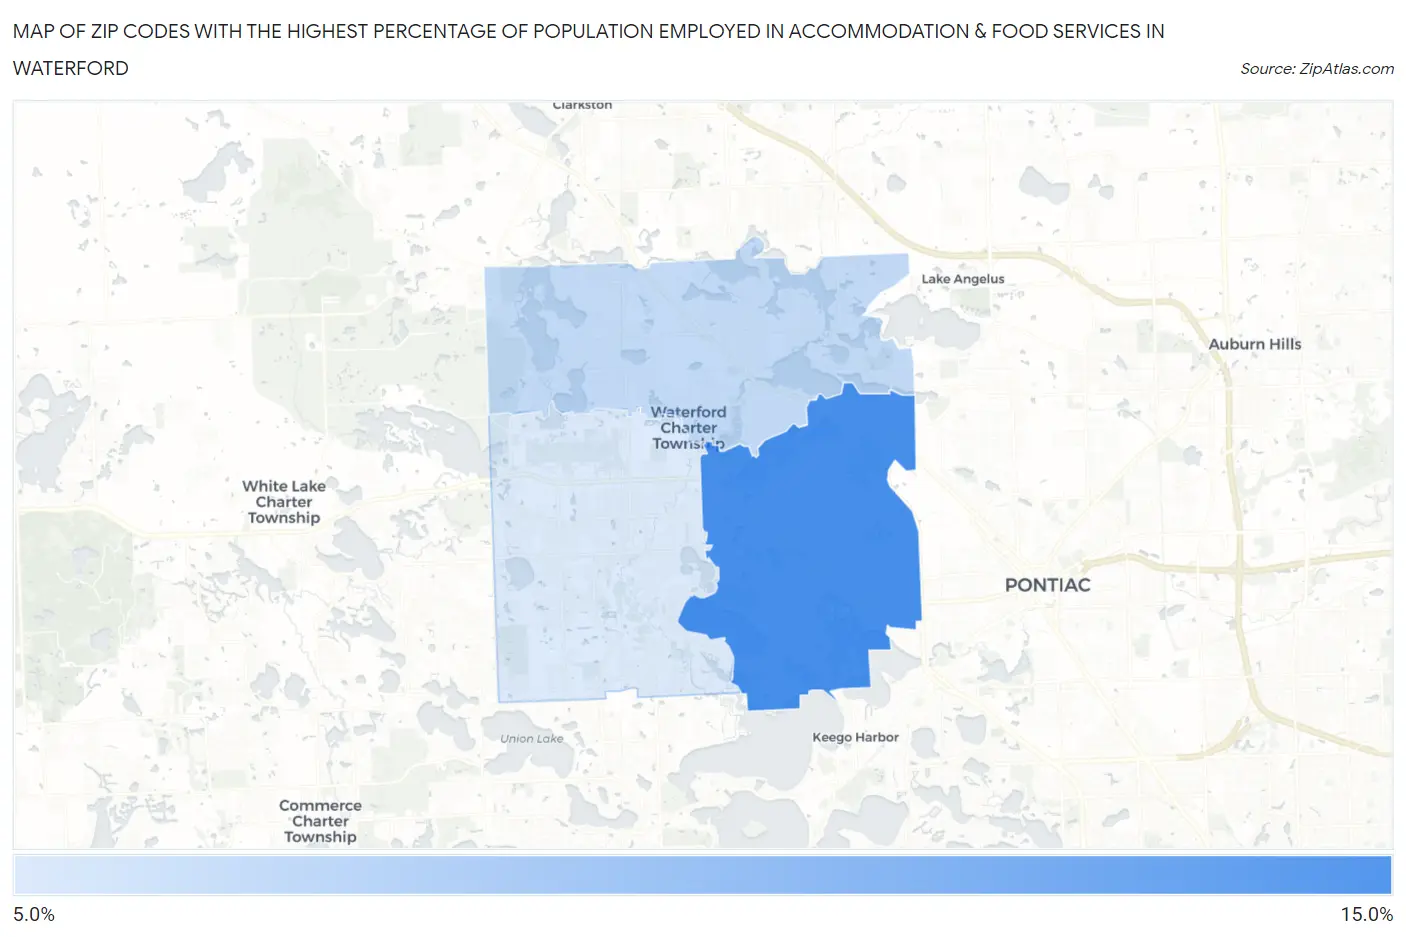
Map of Zip Codes with the Highest Percentage of Population Employed in Accommodation & Food Services in Waterford
5.8%
10.3%
Zip Codes with the Highest Percentage of Population Employed in Accommodation & Food Services in Waterford, MI
| Zip Code | % Employed | vs State | vs National | |
| 1. | 48328 | 10.3% | 7.1%(+3.22)#126 | 6.9%(+3.42)#4,195 |
| 2. | 48329 | 6.6% | 7.1%(-0.496)#443 | 6.9%(-0.293)#11,560 |
| 3. | 48327 | 5.8% | 7.1%(-1.27)#557 | 6.9%(-1.07)#14,053 |
1
Common Questions
What are the Top Zip Codes with the Highest Percentage of Population Employed in Accommodation & Food Services in Waterford, MI?
Top Zip Codes with the Highest Percentage of Population Employed in Accommodation & Food Services in Waterford, MI are:
What zip code has the Highest Percentage of Population Employed in Accommodation & Food Services in Waterford, MI?
48328 has the Highest Percentage of Population Employed in Accommodation & Food Services in Waterford, MI with 10.3%.
What is the Percentage of Population Employed in Accommodation & Food Services in Michigan?
Percentage of Population Employed in Accommodation & Food Services in Michigan is 7.1%.
What is the Percentage of Population Employed in Accommodation & Food Services in the United States?
Percentage of Population Employed in Accommodation & Food Services in the United States is 6.9%.