Zip Codes with the Highest Percentage of Population Employed in Accommodation & Food Services in White Lake, MI
RELATED REPORTS & OPTIONS
Accommodation & Food Services
White Lake
Compare Zip Codes
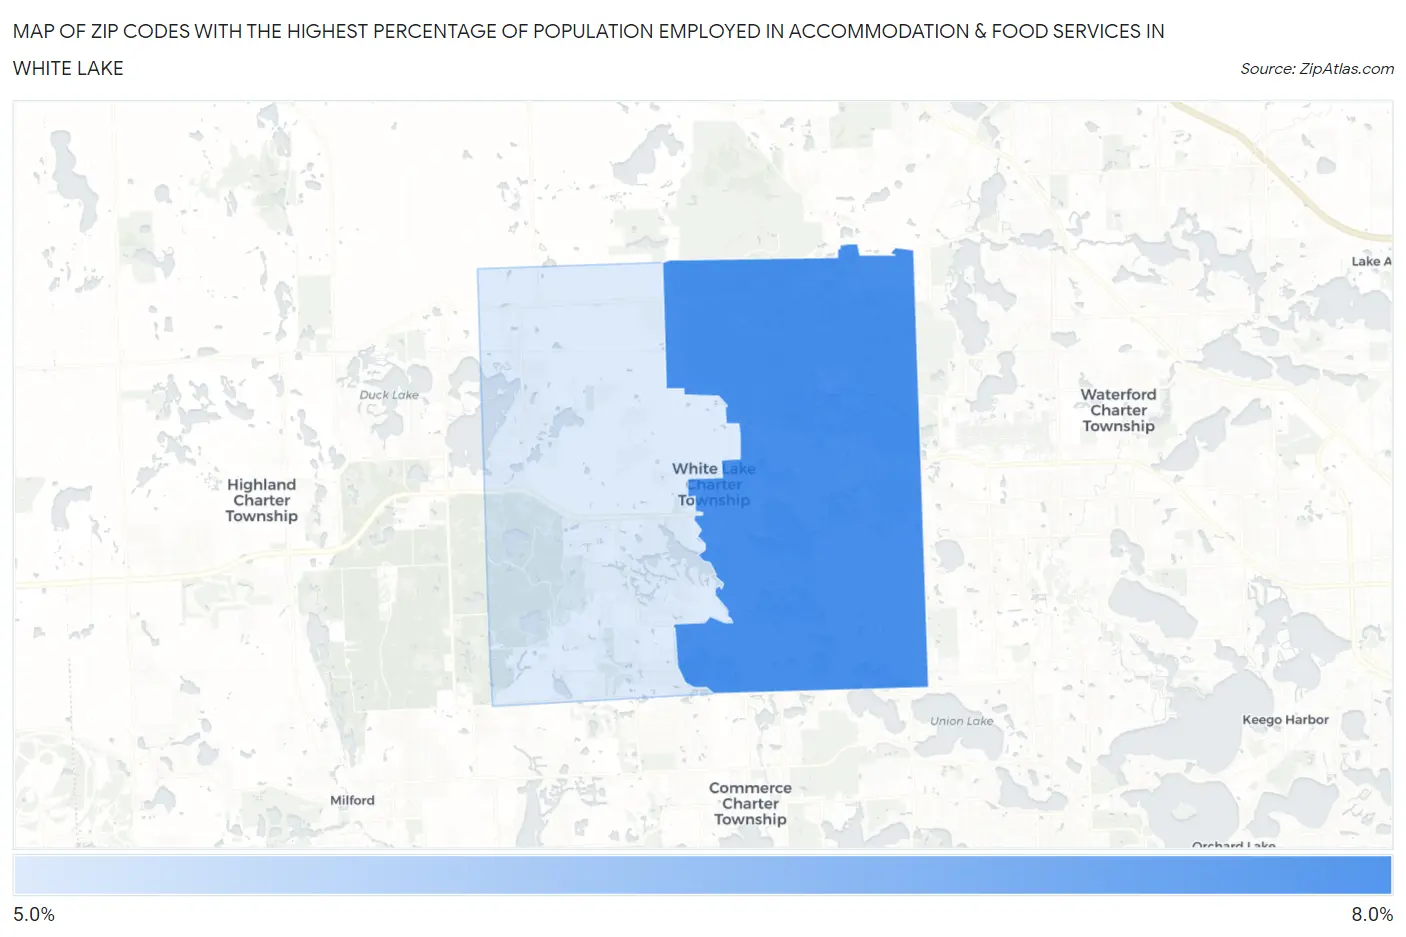
Map of Zip Codes with the Highest Percentage of Population Employed in Accommodation & Food Services in White Lake
6.0%
6.7%
Zip Codes with the Highest Percentage of Population Employed in Accommodation & Food Services in White Lake, MI
| Zip Code | % Employed | vs State | vs National | |
| 1. | 48386 | 6.7% | 7.1%(-0.364)#427 | 6.9%(-0.161)#11,144 |
| 2. | 48383 | 6.0% | 7.1%(-1.09)#525 | 6.9%(-0.883)#13,459 |
1
Common Questions
What are the Top Zip Codes with the Highest Percentage of Population Employed in Accommodation & Food Services in White Lake, MI?
Top Zip Codes with the Highest Percentage of Population Employed in Accommodation & Food Services in White Lake, MI are:
What zip code has the Highest Percentage of Population Employed in Accommodation & Food Services in White Lake, MI?
48386 has the Highest Percentage of Population Employed in Accommodation & Food Services in White Lake, MI with 6.7%.
What is the Percentage of Population Employed in Accommodation & Food Services in Michigan?
Percentage of Population Employed in Accommodation & Food Services in Michigan is 7.1%.
What is the Percentage of Population Employed in Accommodation & Food Services in the United States?
Percentage of Population Employed in Accommodation & Food Services in the United States is 6.9%.