Zip Codes with the Highest Percentage of Population Employed in Accommodation & Food Services in Redford, MI
RELATED REPORTS & OPTIONS
Accommodation & Food Services
Redford
Compare Zip Codes
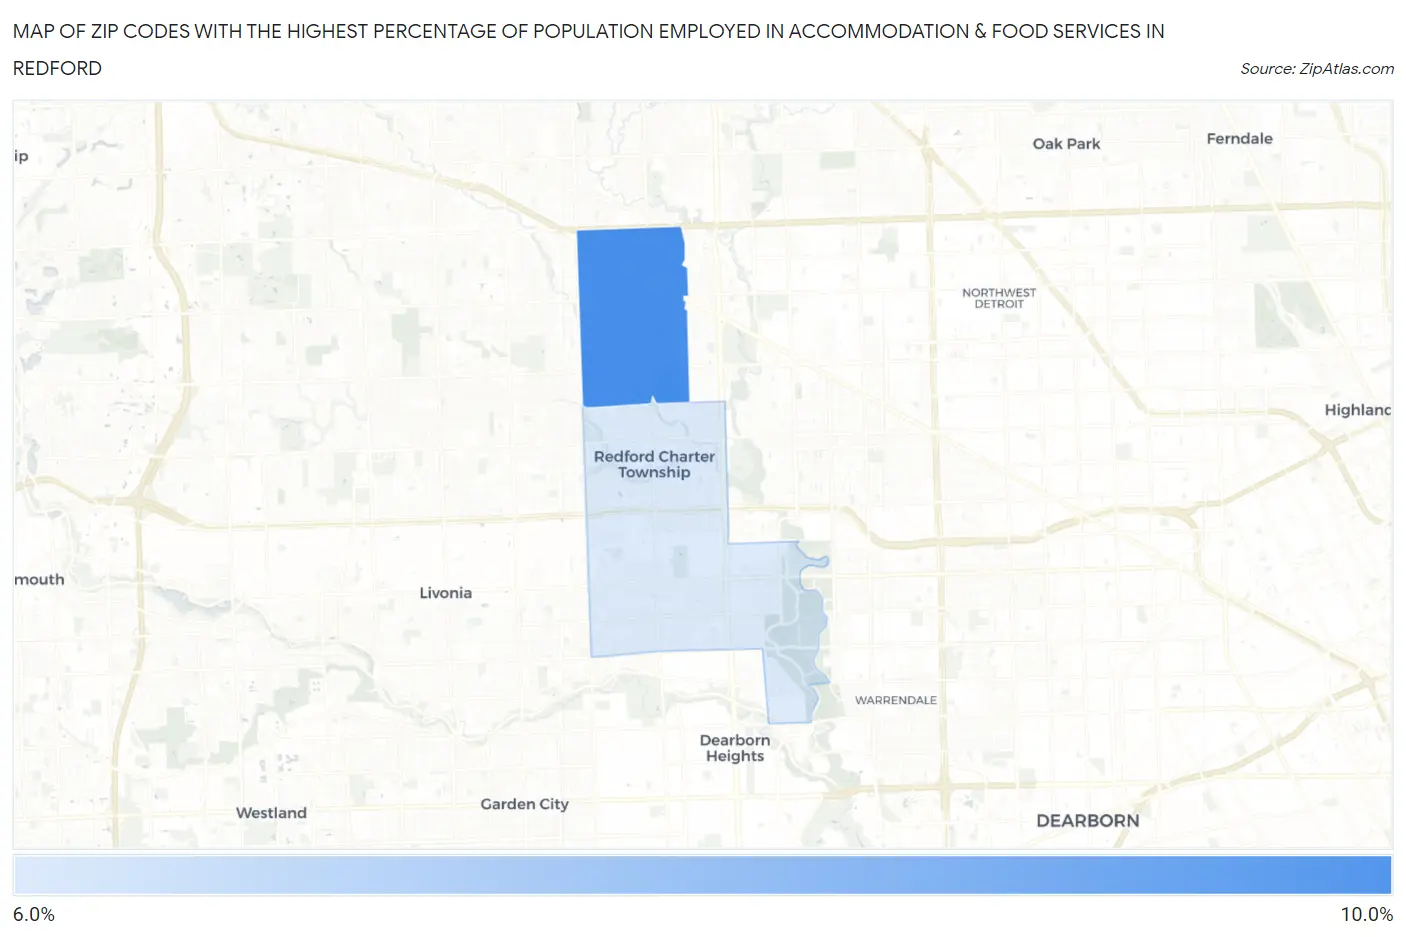
Map of Zip Codes with the Highest Percentage of Population Employed in Accommodation & Food Services in Redford
6.8%
9.9%
Zip Codes with the Highest Percentage of Population Employed in Accommodation & Food Services in Redford, MI
| Zip Code | % Employed | vs State | vs National | |
| 1. | 48240 | 9.9% | 7.1%(+2.81)#151 | 6.9%(+3.01)#4,674 |
| 2. | 48239 | 6.8% | 7.1%(-0.247)#412 | 6.9%(-0.044)#10,767 |
1
Common Questions
What are the Top Zip Codes with the Highest Percentage of Population Employed in Accommodation & Food Services in Redford, MI?
Top Zip Codes with the Highest Percentage of Population Employed in Accommodation & Food Services in Redford, MI are:
What zip code has the Highest Percentage of Population Employed in Accommodation & Food Services in Redford, MI?
48240 has the Highest Percentage of Population Employed in Accommodation & Food Services in Redford, MI with 9.9%.
What is the Percentage of Population Employed in Accommodation & Food Services in Michigan?
Percentage of Population Employed in Accommodation & Food Services in Michigan is 7.1%.
What is the Percentage of Population Employed in Accommodation & Food Services in the United States?
Percentage of Population Employed in Accommodation & Food Services in the United States is 6.9%.