Zip Codes with the Highest Percentage of Population Employed in Farming, Fishing & Forestry in Royal Oak, MI
RELATED REPORTS & OPTIONS
Farming, Fishing & Forestry
Royal Oak
Compare Zip Codes
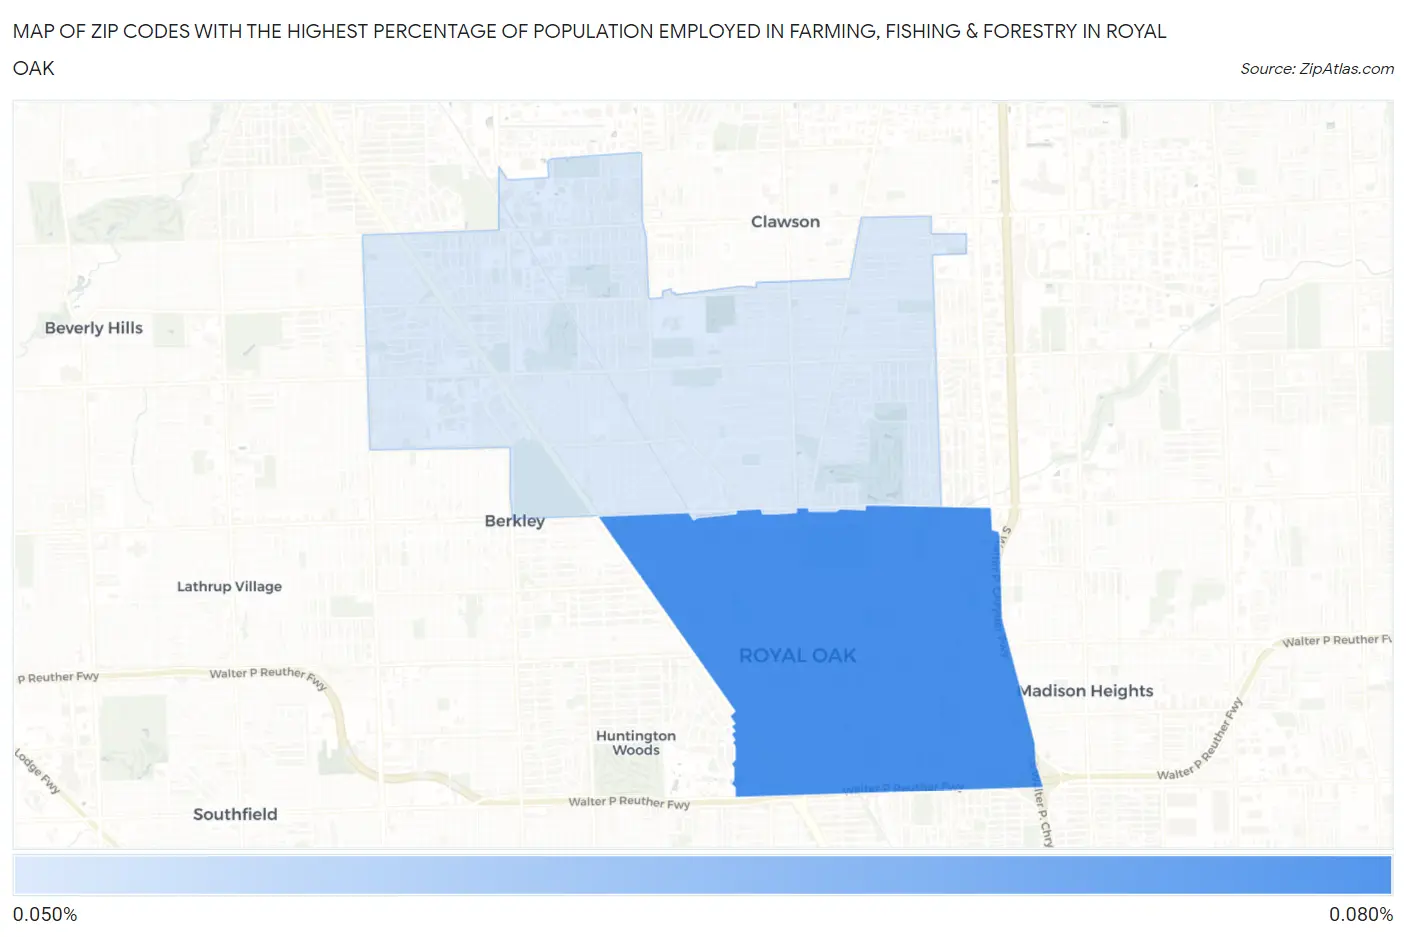
Map of Zip Codes with the Highest Percentage of Population Employed in Farming, Fishing & Forestry in Royal Oak
0.058%
0.062%
Zip Codes with the Highest Percentage of Population Employed in Farming, Fishing & Forestry in Royal Oak, MI
| Zip Code | % Employed | vs State | vs National | |
| 1. | 48067 | 0.062% | 0.47%(-0.405)#658 | 0.61%(-0.544)#18,442 |
| 2. | 48073 | 0.058% | 0.47%(-0.408)#663 | 0.61%(-0.547)#18,509 |
1
Common Questions
What are the Top Zip Codes with the Highest Percentage of Population Employed in Farming, Fishing & Forestry in Royal Oak, MI?
Top Zip Codes with the Highest Percentage of Population Employed in Farming, Fishing & Forestry in Royal Oak, MI are:
What zip code has the Highest Percentage of Population Employed in Farming, Fishing & Forestry in Royal Oak, MI?
48067 has the Highest Percentage of Population Employed in Farming, Fishing & Forestry in Royal Oak, MI with 0.062%.
What is the Percentage of Population Employed in Farming, Fishing & Forestry in Royal Oak, MI?
Percentage of Population Employed in Farming, Fishing & Forestry in Royal Oak is 0.060%.
What is the Percentage of Population Employed in Farming, Fishing & Forestry in Michigan?
Percentage of Population Employed in Farming, Fishing & Forestry in Michigan is 0.47%.
What is the Percentage of Population Employed in Farming, Fishing & Forestry in the United States?
Percentage of Population Employed in Farming, Fishing & Forestry in the United States is 0.61%.