Zip Codes with the Highest Percentage of Population Employed in Food Preparation & Serving in Royal Oak, MI
RELATED REPORTS & OPTIONS
Food Preparation & Serving
Royal Oak
Compare Zip Codes
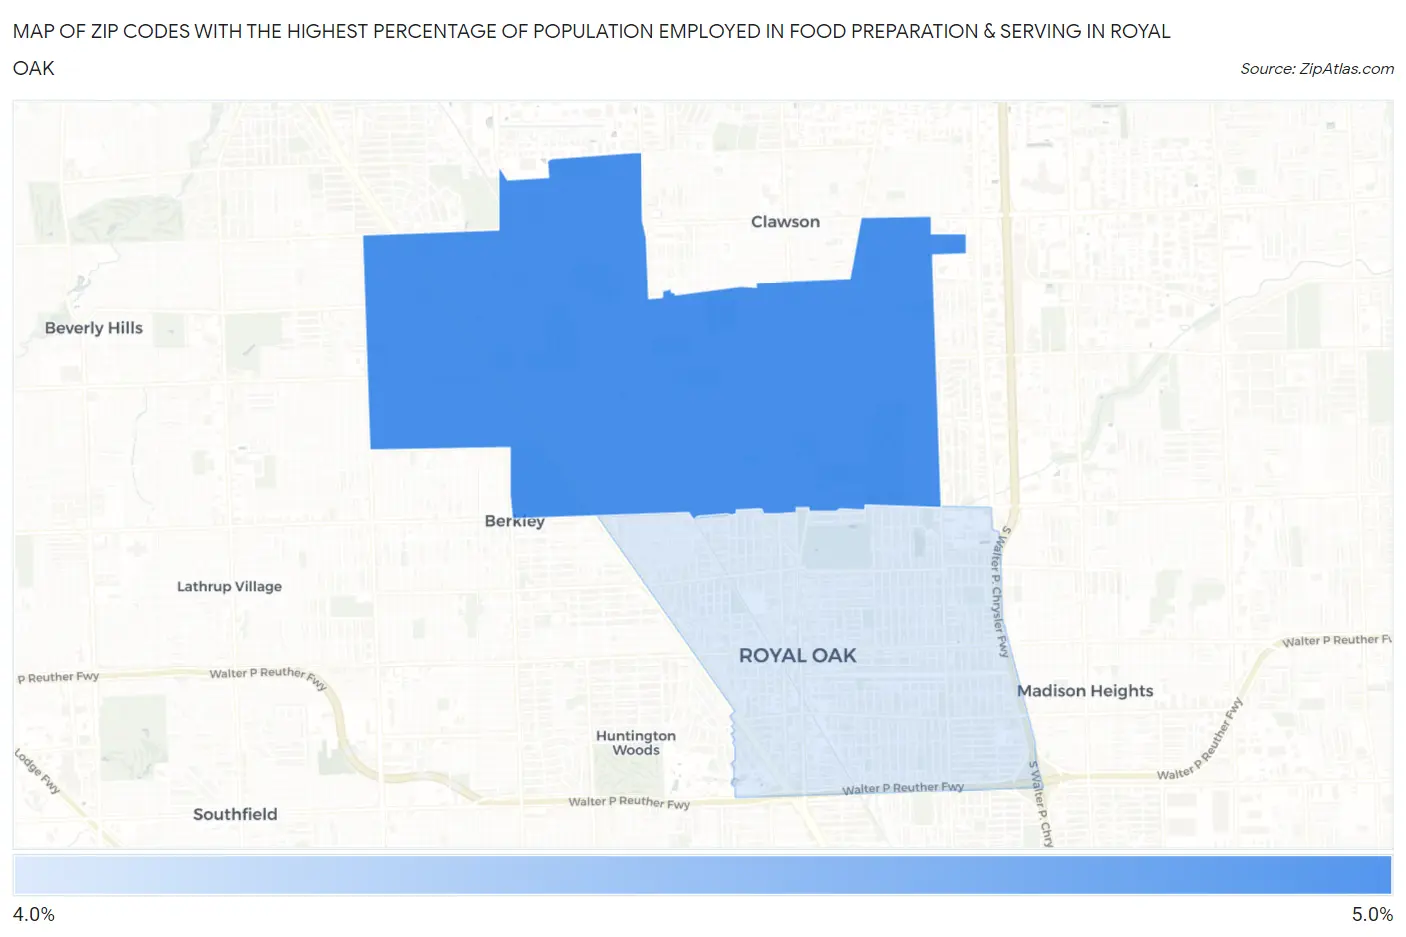
Map of Zip Codes with the Highest Percentage of Population Employed in Food Preparation & Serving in Royal Oak
4.1%
4.4%
Zip Codes with the Highest Percentage of Population Employed in Food Preparation & Serving in Royal Oak, MI
| Zip Code | % Employed | vs State | vs National | |
| 1. | 48073 | 4.4% | 5.7%(-1.23)#571 | 5.3%(-0.841)#15,220 |
| 2. | 48067 | 4.1% | 5.7%(-1.53)#628 | 5.3%(-1.14)#16,513 |
1
Common Questions
What are the Top Zip Codes with the Highest Percentage of Population Employed in Food Preparation & Serving in Royal Oak, MI?
Top Zip Codes with the Highest Percentage of Population Employed in Food Preparation & Serving in Royal Oak, MI are:
What zip code has the Highest Percentage of Population Employed in Food Preparation & Serving in Royal Oak, MI?
48073 has the Highest Percentage of Population Employed in Food Preparation & Serving in Royal Oak, MI with 4.4%.
What is the Percentage of Population Employed in Food Preparation & Serving in Royal Oak, MI?
Percentage of Population Employed in Food Preparation & Serving in Royal Oak is 4.3%.
What is the Percentage of Population Employed in Food Preparation & Serving in Michigan?
Percentage of Population Employed in Food Preparation & Serving in Michigan is 5.7%.
What is the Percentage of Population Employed in Food Preparation & Serving in the United States?
Percentage of Population Employed in Food Preparation & Serving in the United States is 5.3%.