Zip Codes with the Highest Percentage of Families with Income Above $200,000 in Royal Oak, MI
RELATED REPORTS & OPTIONS
Family Income | $200k+
Royal Oak
Compare Zip Codes
Map of Zip Codes with the Highest Percentage of Families with Income Above $200,000 in Royal Oak
20.3%
28.4%
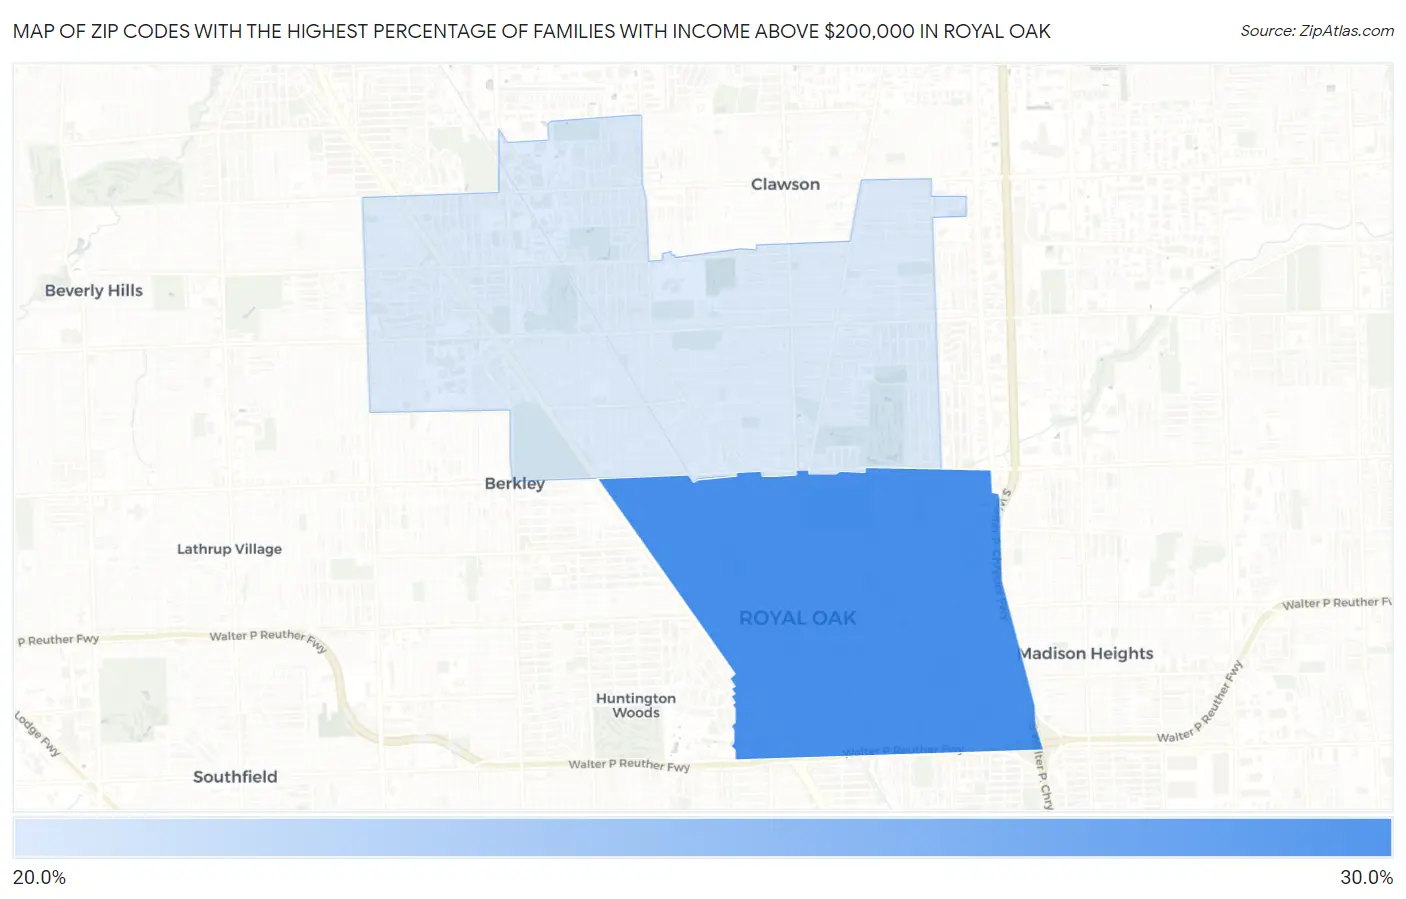
Zip Codes with the Highest Percentage of Families with Income Above $200,000 in Royal Oak, MI
| Zip Code | Families with Income > $200k | vs State | vs National | |
| 1. | 48067 | 28.4% | 11.3%(+17.1)#40 | 14.8%(+13.6)#2,797 |
| 2. | 48073 | 20.3% | 11.3%(+9.00)#82 | 14.8%(+5.50)#4,719 |
1
Common Questions
What are the Top Zip Codes with the Highest Percentage of Families with Income Above $200,000 in Royal Oak, MI?
Top Zip Codes with the Highest Percentage of Families with Income Above $200,000 in Royal Oak, MI are:
What zip code has the Highest Percentage of Families with Income Above $200,000 in Royal Oak, MI?
48067 has the Highest Percentage of Families with Income Above $200,000 in Royal Oak, MI with 28.4%.
What is the Percentage of Families with Income Above $200,000 in Royal Oak, MI?
Percentage of Families with Income Above $200,000 in Royal Oak is 23.5%.
What is the Percentage of Families with Income Above $200,000 in Michigan?
Percentage of Families with Income Above $200,000 in Michigan is 11.3%.
What is the Percentage of Families with Income Above $200,000 in the United States?
Percentage of Families with Income Above $200,000 in the United States is 14.8%.