Zip Codes with the Highest Percentage of Families with Income Above $100,000 in Oxford, MI
RELATED REPORTS & OPTIONS
Family Income | $100k+
Oxford
Compare Zip Codes
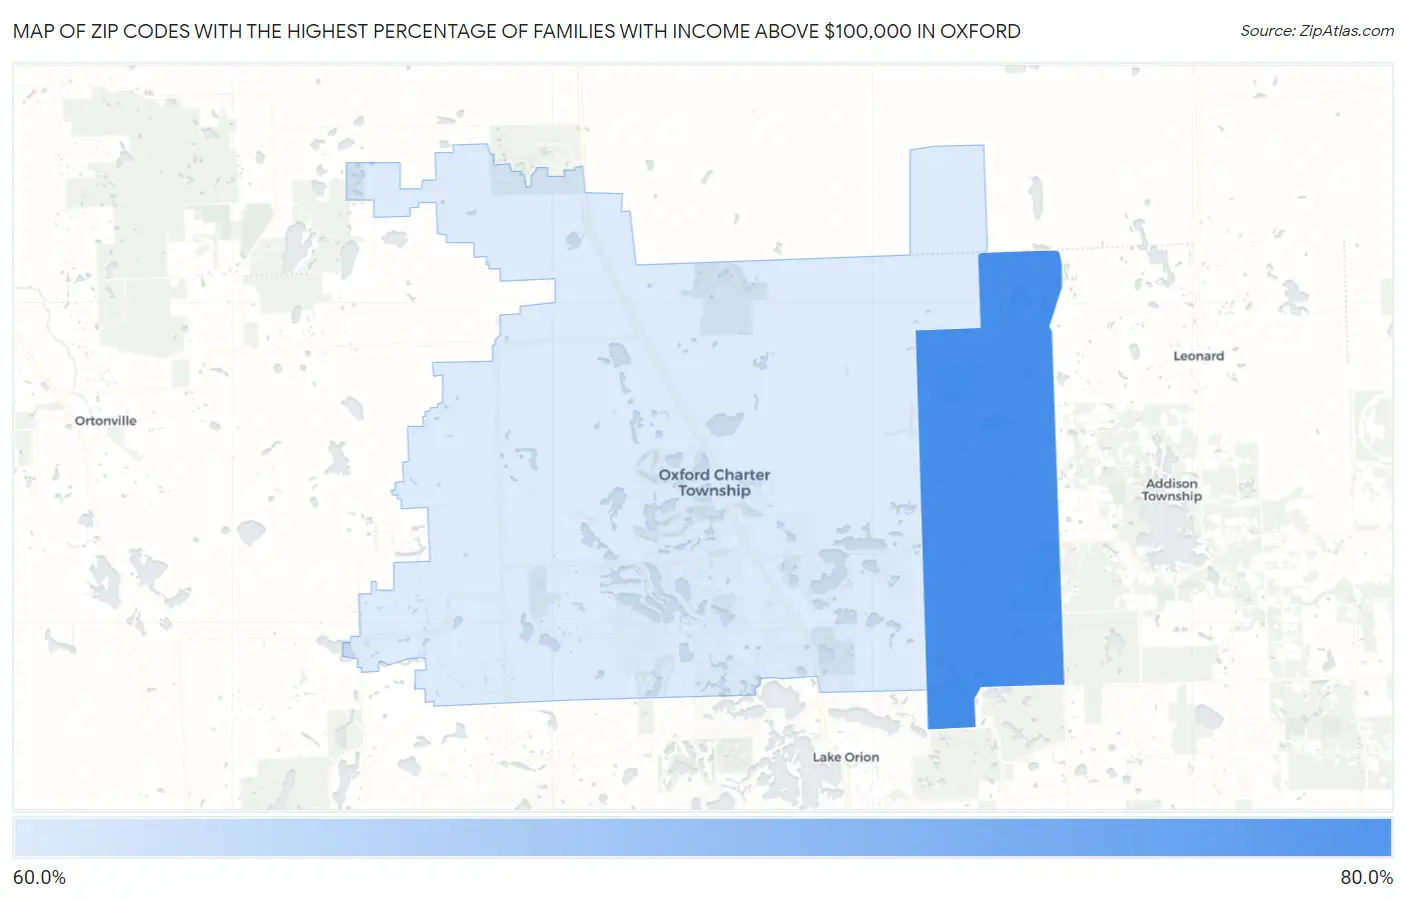
Map of Zip Codes with the Highest Percentage of Families with Income Above $100,000 in Oxford
61.5%
62.5%
Zip Codes with the Highest Percentage of Families with Income Above $100,000 in Oxford, MI
| Zip Code | Families with Income > $100k | vs State | vs National | |
| 1. | 48370 | 62.5% | 42.6%(+19.9)#72 | 46.1%(+16.4)#4,428 |
| 2. | 48371 | 61.5% | 42.6%(+18.9)#76 | 46.1%(+15.4)#4,694 |
1
Common Questions
What are the Top Zip Codes with the Highest Percentage of Families with Income Above $100,000 in Oxford, MI?
Top Zip Codes with the Highest Percentage of Families with Income Above $100,000 in Oxford, MI are:
What zip code has the Highest Percentage of Families with Income Above $100,000 in Oxford, MI?
48370 has the Highest Percentage of Families with Income Above $100,000 in Oxford, MI with 62.5%.
What is the Percentage of Families with Income Above $100,000 in Oxford, MI?
Percentage of Families with Income Above $100,000 in Oxford is 59.0%.
What is the Percentage of Families with Income Above $100,000 in Michigan?
Percentage of Families with Income Above $100,000 in Michigan is 42.6%.
What is the Percentage of Families with Income Above $100,000 in the United States?
Percentage of Families with Income Above $100,000 in the United States is 46.1%.