Zip Codes with the Highest Percentage of Population Employed in Food Preparation & Serving in Oxford, MI
RELATED REPORTS & OPTIONS
Food Preparation & Serving
Oxford
Compare Zip Codes
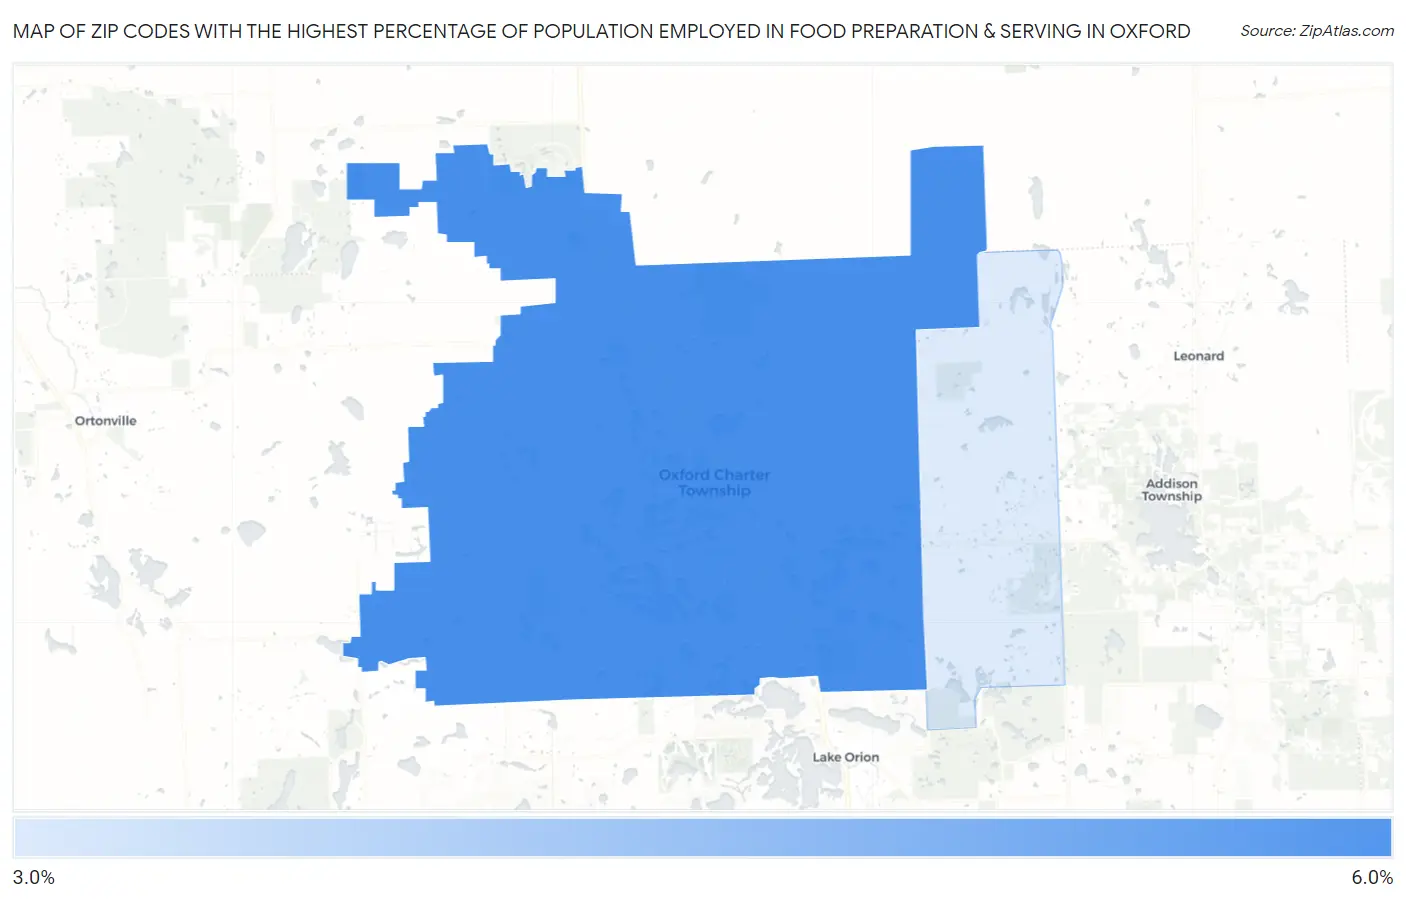
Map of Zip Codes with the Highest Percentage of Population Employed in Food Preparation & Serving in Oxford
3.6%
5.7%
Zip Codes with the Highest Percentage of Population Employed in Food Preparation & Serving in Oxford, MI
| Zip Code | % Employed | vs State | vs National | |
| 1. | 48371 | 5.7% | 5.7%(+0.020)#393 | 5.3%(+0.406)#10,379 |
| 2. | 48370 | 3.6% | 5.7%(-2.12)#719 | 5.3%(-1.74)#18,994 |
1
Common Questions
What are the Top Zip Codes with the Highest Percentage of Population Employed in Food Preparation & Serving in Oxford, MI?
Top Zip Codes with the Highest Percentage of Population Employed in Food Preparation & Serving in Oxford, MI are:
What zip code has the Highest Percentage of Population Employed in Food Preparation & Serving in Oxford, MI?
48371 has the Highest Percentage of Population Employed in Food Preparation & Serving in Oxford, MI with 5.7%.
What is the Percentage of Population Employed in Food Preparation & Serving in Oxford, MI?
Percentage of Population Employed in Food Preparation & Serving in Oxford is 10.9%.
What is the Percentage of Population Employed in Food Preparation & Serving in Michigan?
Percentage of Population Employed in Food Preparation & Serving in Michigan is 5.7%.
What is the Percentage of Population Employed in Food Preparation & Serving in the United States?
Percentage of Population Employed in Food Preparation & Serving in the United States is 5.3%.