Zip Codes with the Highest Percentage of Population Employed in Food Preparation & Serving in Jackson, MI
RELATED REPORTS & OPTIONS
Food Preparation & Serving
Jackson
Compare Zip Codes
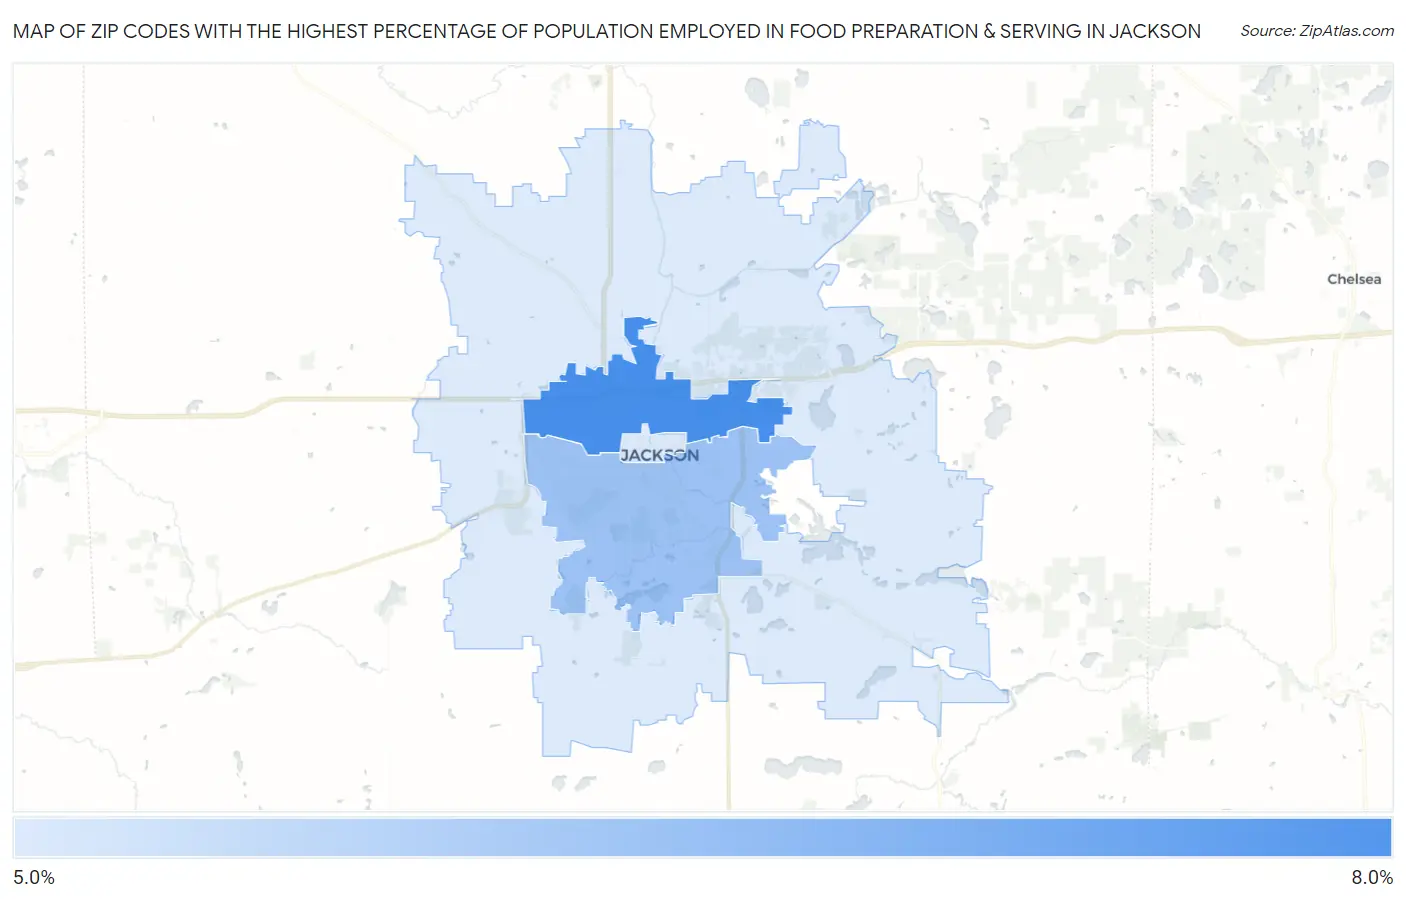
Map of Zip Codes with the Highest Percentage of Population Employed in Food Preparation & Serving in Jackson
5.7%
7.9%
Zip Codes with the Highest Percentage of Population Employed in Food Preparation & Serving in Jackson, MI
| Zip Code | % Employed | vs State | vs National | |
| 1. | 49202 | 7.9% | 5.7%(+2.25)#155 | 5.3%(+2.63)#4,857 |
| 2. | 49203 | 6.7% | 5.7%(+0.979)#266 | 5.3%(+1.37)#7,475 |
| 3. | 49201 | 5.7% | 5.7%(+0.028)#390 | 5.3%(+0.414)#10,341 |
1
Common Questions
What are the Top Zip Codes with the Highest Percentage of Population Employed in Food Preparation & Serving in Jackson, MI?
Top Zip Codes with the Highest Percentage of Population Employed in Food Preparation & Serving in Jackson, MI are:
What zip code has the Highest Percentage of Population Employed in Food Preparation & Serving in Jackson, MI?
49202 has the Highest Percentage of Population Employed in Food Preparation & Serving in Jackson, MI with 7.9%.
What is the Percentage of Population Employed in Food Preparation & Serving in Jackson, MI?
Percentage of Population Employed in Food Preparation & Serving in Jackson is 9.0%.
What is the Percentage of Population Employed in Food Preparation & Serving in Michigan?
Percentage of Population Employed in Food Preparation & Serving in Michigan is 5.7%.
What is the Percentage of Population Employed in Food Preparation & Serving in the United States?
Percentage of Population Employed in Food Preparation & Serving in the United States is 5.3%.