Zip Codes with the Highest Percentage of Population Employed in Installation, Maintenance & Repair in Jackson, MI
RELATED REPORTS & OPTIONS
Installation, Maintenance & Repair
Jackson
Compare Zip Codes
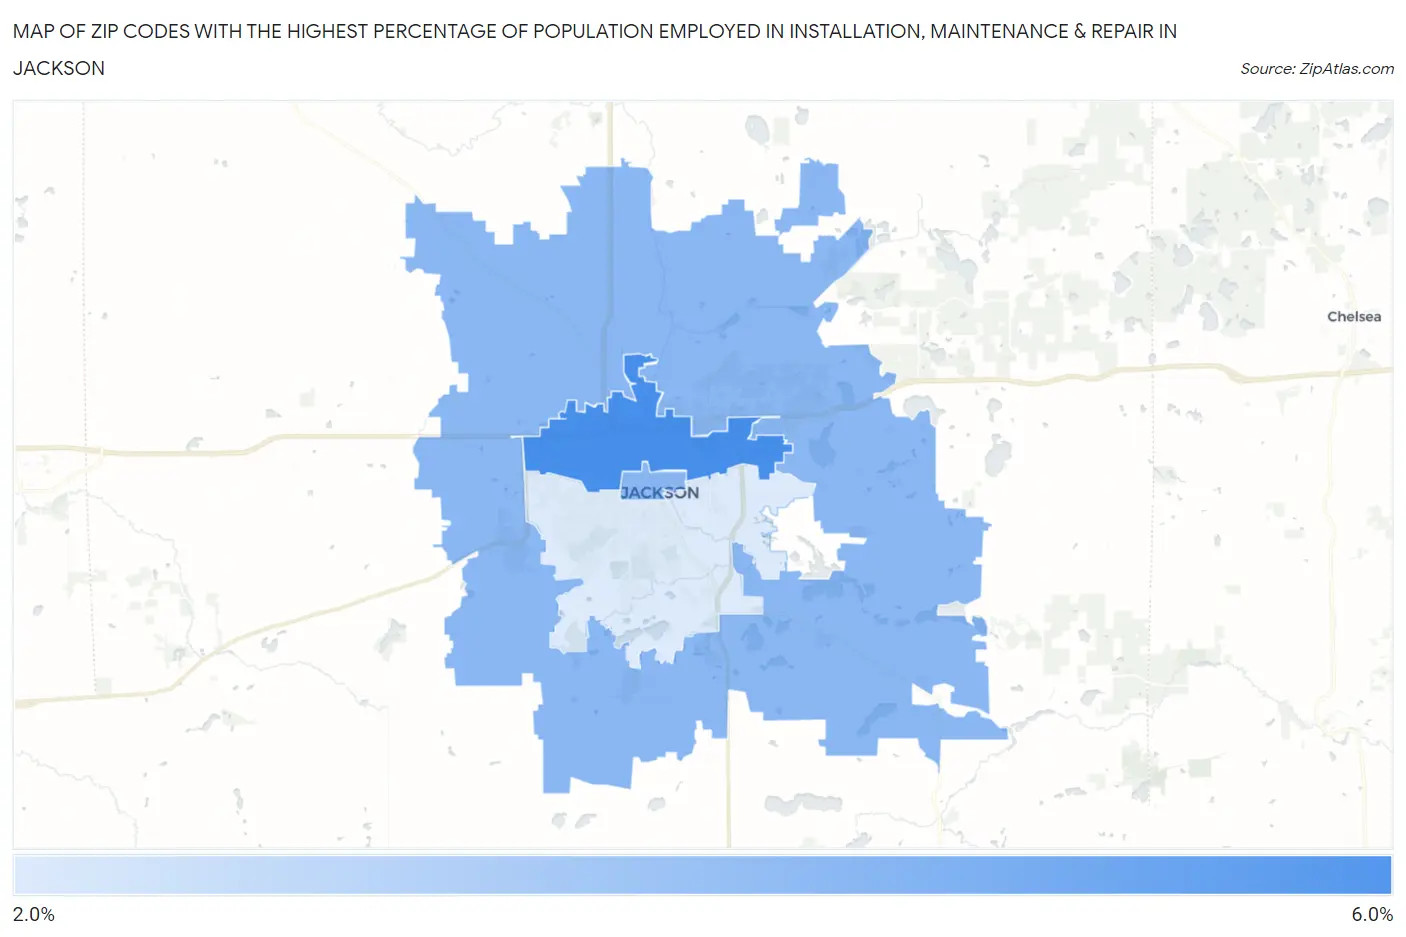
Map of Zip Codes with the Highest Percentage of Population Employed in Installation, Maintenance & Repair in Jackson
2.6%
5.5%
Zip Codes with the Highest Percentage of Population Employed in Installation, Maintenance & Repair in Jackson, MI
| Zip Code | % Employed | vs State | vs National | |
| 1. | 49202 | 5.5% | 3.1%(+2.36)#239 | 3.1%(+2.39)#7,389 |
| 2. | 49201 | 4.2% | 3.1%(+1.07)#400 | 3.1%(+1.10)#11,630 |
| 3. | 49203 | 2.6% | 3.1%(-0.480)#670 | 3.1%(-0.448)#18,976 |
1
Common Questions
What are the Top Zip Codes with the Highest Percentage of Population Employed in Installation, Maintenance & Repair in Jackson, MI?
Top Zip Codes with the Highest Percentage of Population Employed in Installation, Maintenance & Repair in Jackson, MI are:
What zip code has the Highest Percentage of Population Employed in Installation, Maintenance & Repair in Jackson, MI?
49202 has the Highest Percentage of Population Employed in Installation, Maintenance & Repair in Jackson, MI with 5.5%.
What is the Percentage of Population Employed in Installation, Maintenance & Repair in Jackson, MI?
Percentage of Population Employed in Installation, Maintenance & Repair in Jackson is 2.8%.
What is the Percentage of Population Employed in Installation, Maintenance & Repair in Michigan?
Percentage of Population Employed in Installation, Maintenance & Repair in Michigan is 3.1%.
What is the Percentage of Population Employed in Installation, Maintenance & Repair in the United States?
Percentage of Population Employed in Installation, Maintenance & Repair in the United States is 3.1%.