Zip Codes with the Highest Percentage of Population Employed in Life, Physical & Social Science in Jackson, MI
RELATED REPORTS & OPTIONS
Life, Physical & Social Science
Jackson
Compare Zip Codes
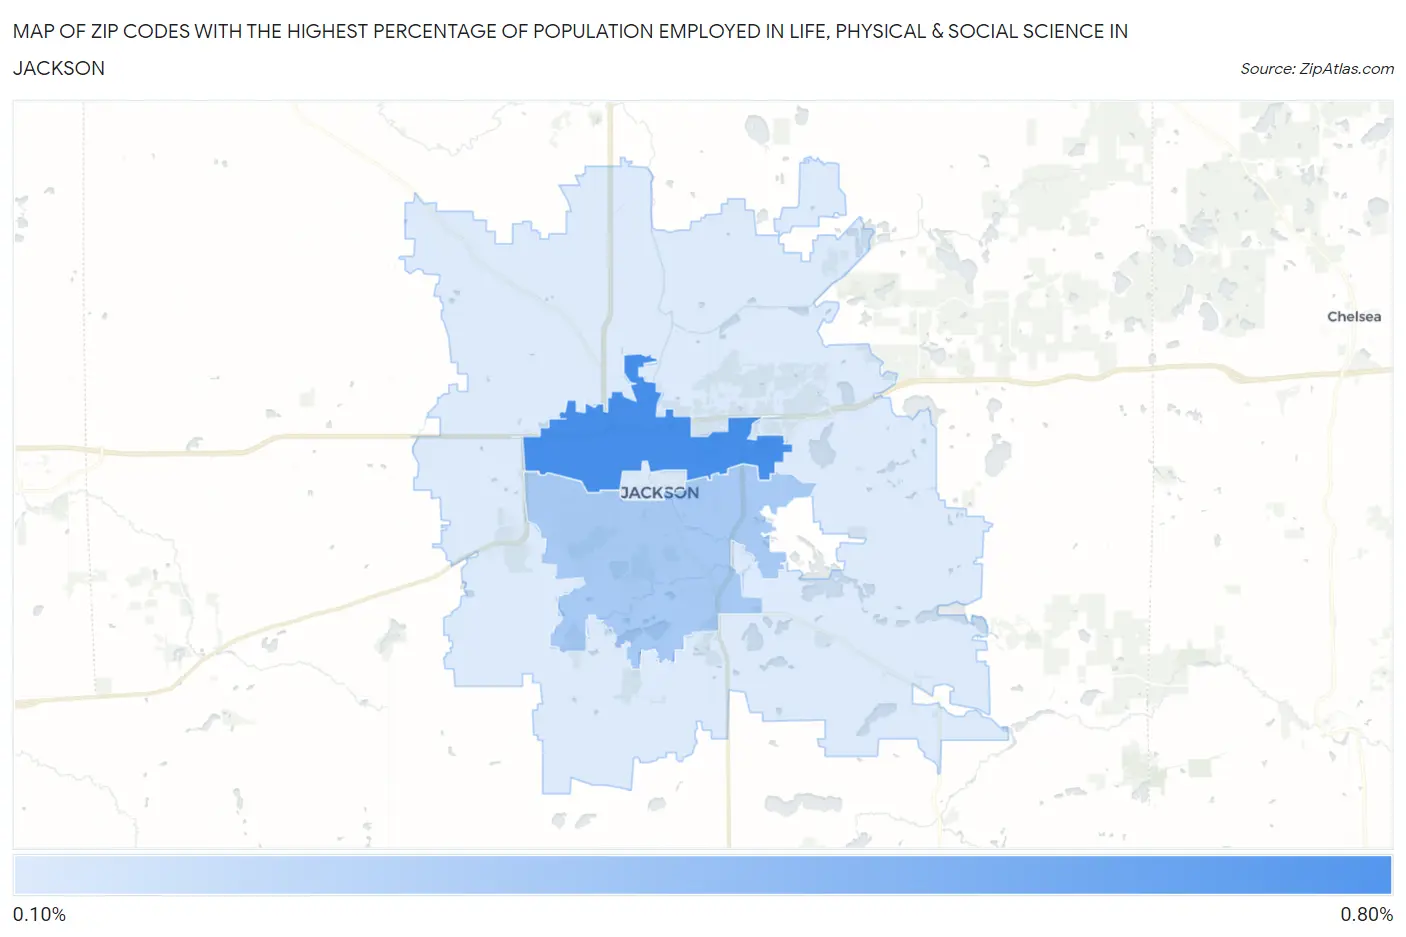
Map of Zip Codes with the Highest Percentage of Population Employed in Life, Physical & Social Science in Jackson
0.20%
0.69%
Zip Codes with the Highest Percentage of Population Employed in Life, Physical & Social Science in Jackson, MI
| Zip Code | % Employed | vs State | vs National | |
| 1. | 49202 | 0.69% | 0.88%(-0.194)#359 | 1.1%(-0.401)#12,162 |
| 2. | 49203 | 0.37% | 0.88%(-0.515)#542 | 1.1%(-0.721)#16,145 |
| 3. | 49201 | 0.20% | 0.88%(-0.687)#641 | 1.1%(-0.894)#18,226 |
1
Common Questions
What are the Top Zip Codes with the Highest Percentage of Population Employed in Life, Physical & Social Science in Jackson, MI?
Top Zip Codes with the Highest Percentage of Population Employed in Life, Physical & Social Science in Jackson, MI are:
What zip code has the Highest Percentage of Population Employed in Life, Physical & Social Science in Jackson, MI?
49202 has the Highest Percentage of Population Employed in Life, Physical & Social Science in Jackson, MI with 0.69%.
What is the Percentage of Population Employed in Life, Physical & Social Science in Jackson, MI?
Percentage of Population Employed in Life, Physical & Social Science in Jackson is 0.44%.
What is the Percentage of Population Employed in Life, Physical & Social Science in Michigan?
Percentage of Population Employed in Life, Physical & Social Science in Michigan is 0.88%.
What is the Percentage of Population Employed in Life, Physical & Social Science in the United States?
Percentage of Population Employed in Life, Physical & Social Science in the United States is 1.1%.