Zip Codes with the Highest Percentage of Population with a Degree in Liberal Arts and History in Jackson, MI
RELATED REPORTS & OPTIONS
Liberal Arts and History
Jackson
Compare Zip Codes
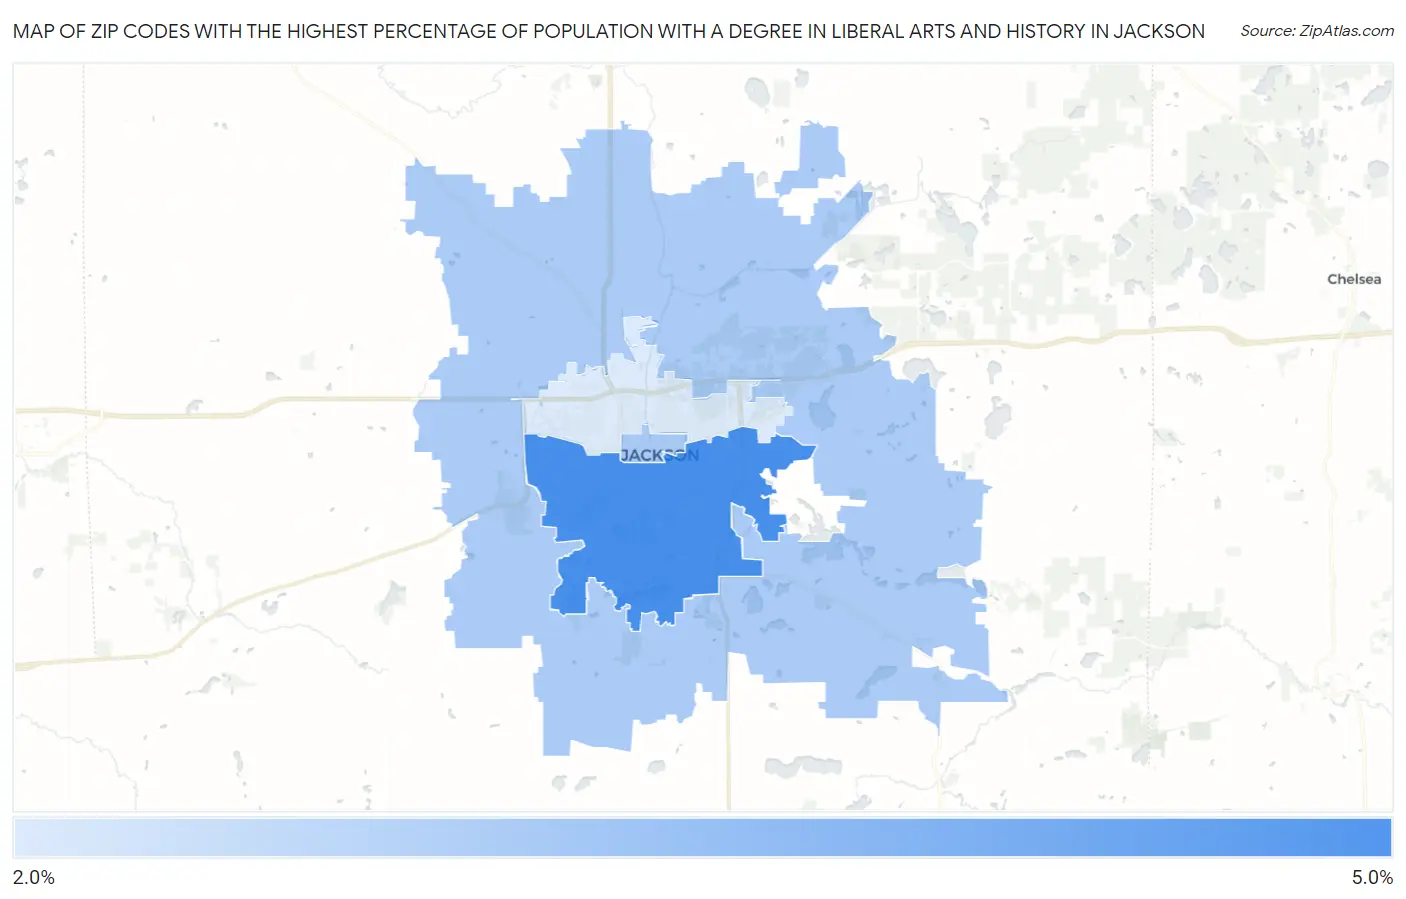
Map of Zip Codes with the Highest Percentage of Population with a Degree in Liberal Arts and History in Jackson
2.0%
4.4%
Zip Codes with the Highest Percentage of Population with a Degree in Liberal Arts and History in Jackson, MI
| Zip Code | % Graduates | vs State | vs National | |
| 1. | 49203 | 4.4% | 4.0%(+0.426)#346 | 4.9%(-0.464)#13,261 |
| 2. | 49201 | 2.8% | 4.0%(-1.17)#614 | 4.9%(-2.06)#18,976 |
| 3. | 49202 | 2.0% | 4.0%(-1.97)#735 | 4.9%(-2.86)#21,343 |
1
Common Questions
What are the Top Zip Codes with the Highest Percentage of Population with a Degree in Liberal Arts and History in Jackson, MI?
Top Zip Codes with the Highest Percentage of Population with a Degree in Liberal Arts and History in Jackson, MI are:
What zip code has the Highest Percentage of Population with a Degree in Liberal Arts and History in Jackson, MI?
49203 has the Highest Percentage of Population with a Degree in Liberal Arts and History in Jackson, MI with 4.4%.
What is the Percentage of Population with a Degree in Liberal Arts and History in Jackson, MI?
Percentage of Population with a Degree in Liberal Arts and History in Jackson is 6.4%.
What is the Percentage of Population with a Degree in Liberal Arts and History in Michigan?
Percentage of Population with a Degree in Liberal Arts and History in Michigan is 4.0%.
What is the Percentage of Population with a Degree in Liberal Arts and History in the United States?
Percentage of Population with a Degree in Liberal Arts and History in the United States is 4.9%.