Zip Codes with the Highest Percentage of Population Employed in Food Preparation & Serving in Redford, MI
RELATED REPORTS & OPTIONS
Food Preparation & Serving
Redford
Compare Zip Codes
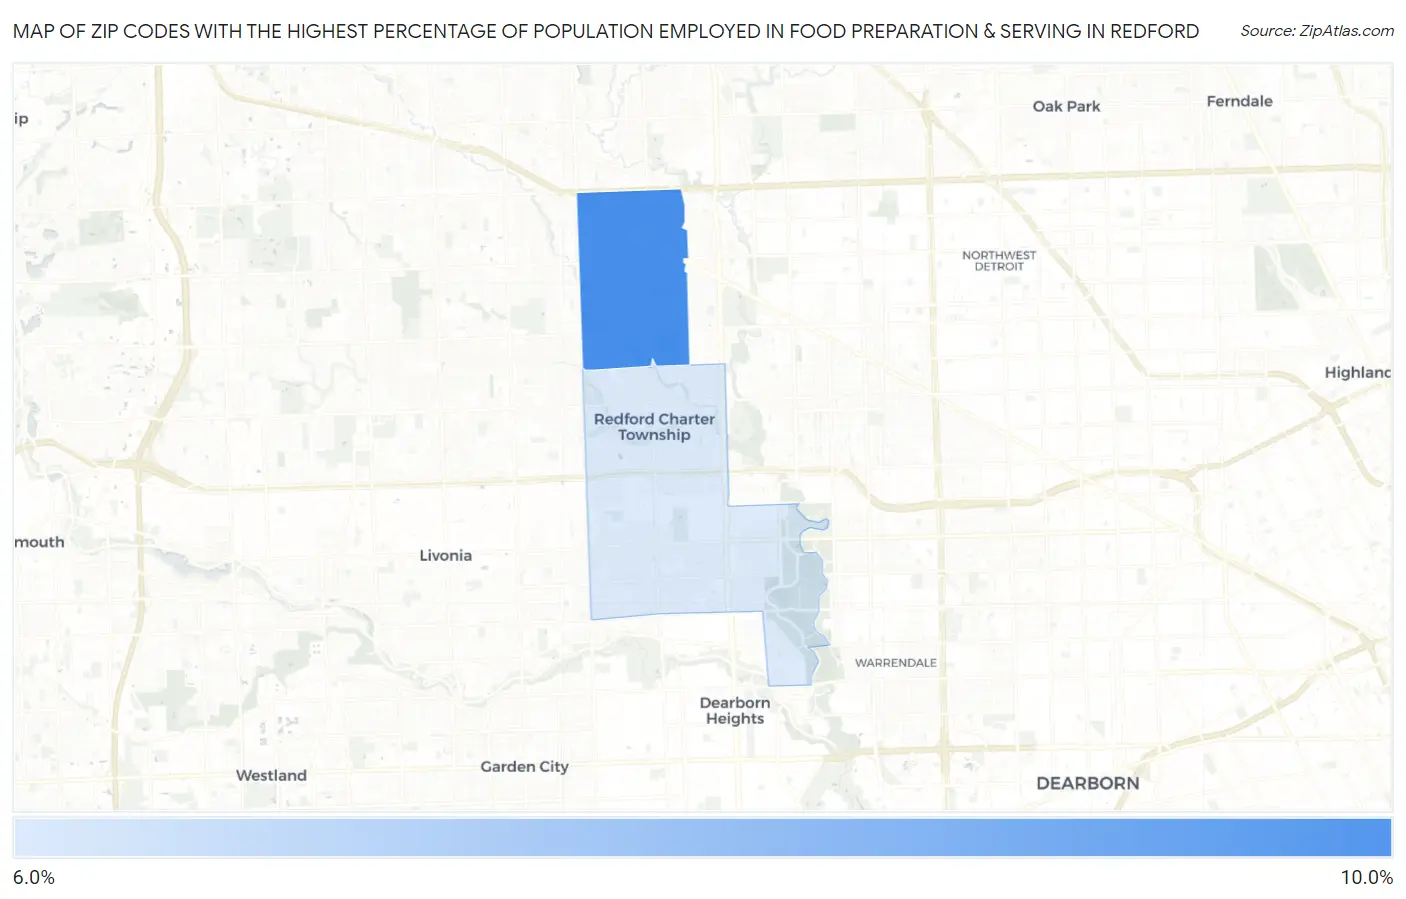
Map of Zip Codes with the Highest Percentage of Population Employed in Food Preparation & Serving in Redford
6.2%
8.6%
Zip Codes with the Highest Percentage of Population Employed in Food Preparation & Serving in Redford, MI
| Zip Code | % Employed | vs State | vs National | |
| 1. | 48240 | 8.6% | 5.7%(+2.95)#117 | 5.3%(+3.34)#3,931 |
| 2. | 48239 | 6.2% | 5.7%(+0.535)#317 | 5.3%(+0.922)#8,706 |
1
Common Questions
What are the Top Zip Codes with the Highest Percentage of Population Employed in Food Preparation & Serving in Redford, MI?
Top Zip Codes with the Highest Percentage of Population Employed in Food Preparation & Serving in Redford, MI are:
What zip code has the Highest Percentage of Population Employed in Food Preparation & Serving in Redford, MI?
48240 has the Highest Percentage of Population Employed in Food Preparation & Serving in Redford, MI with 8.6%.
What is the Percentage of Population Employed in Food Preparation & Serving in Michigan?
Percentage of Population Employed in Food Preparation & Serving in Michigan is 5.7%.
What is the Percentage of Population Employed in Food Preparation & Serving in the United States?
Percentage of Population Employed in Food Preparation & Serving in the United States is 5.3%.