Zip Codes with the Highest Percentage of Population Employed in Food Preparation & Serving in Rochester, MI
RELATED REPORTS & OPTIONS
Food Preparation & Serving
Rochester
Compare Zip Codes
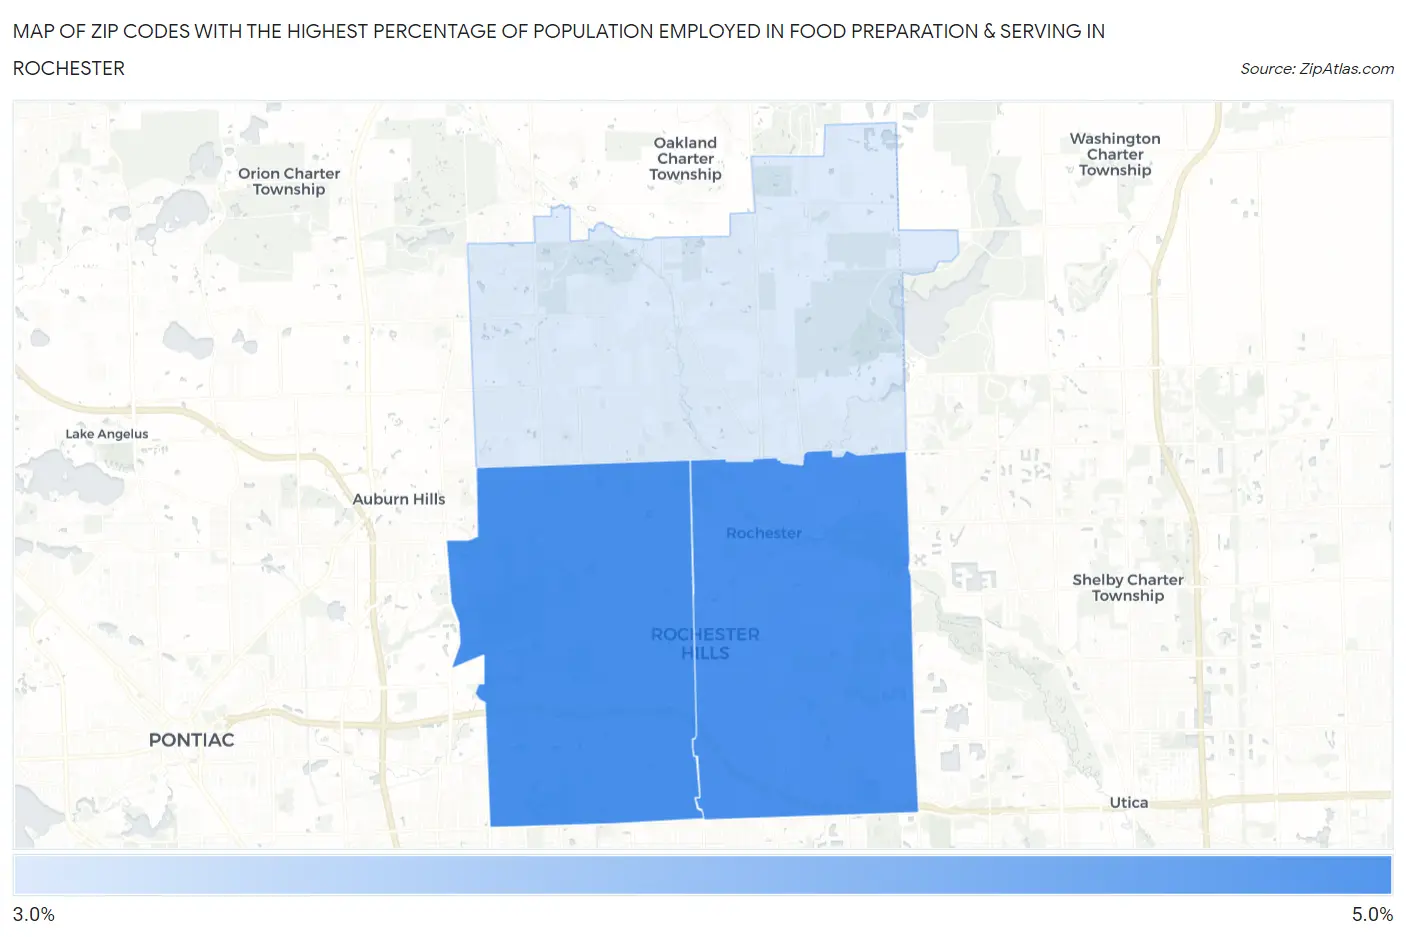
Map of Zip Codes with the Highest Percentage of Population Employed in Food Preparation & Serving in Rochester
3.5%
4.6%
Zip Codes with the Highest Percentage of Population Employed in Food Preparation & Serving in Rochester, MI
| Zip Code | % Employed | vs State | vs National | |
| 1. | 48309 | 4.6% | 5.7%(-1.03)#540 | 5.3%(-0.646)#14,409 |
| 2. | 48307 | 4.6% | 5.7%(-1.06)#543 | 5.3%(-0.670)#14,521 |
| 3. | 48306 | 3.5% | 5.7%(-2.20)#725 | 5.3%(-1.82)#19,322 |
1
Common Questions
What are the Top Zip Codes with the Highest Percentage of Population Employed in Food Preparation & Serving in Rochester, MI?
Top Zip Codes with the Highest Percentage of Population Employed in Food Preparation & Serving in Rochester, MI are:
What zip code has the Highest Percentage of Population Employed in Food Preparation & Serving in Rochester, MI?
48309 has the Highest Percentage of Population Employed in Food Preparation & Serving in Rochester, MI with 4.6%.
What is the Percentage of Population Employed in Food Preparation & Serving in Rochester, MI?
Percentage of Population Employed in Food Preparation & Serving in Rochester is 4.3%.
What is the Percentage of Population Employed in Food Preparation & Serving in Michigan?
Percentage of Population Employed in Food Preparation & Serving in Michigan is 5.7%.
What is the Percentage of Population Employed in Food Preparation & Serving in the United States?
Percentage of Population Employed in Food Preparation & Serving in the United States is 5.3%.