Zip Codes with the Highest Percentage of Population Employed in Food Preparation & Serving in Lake Orion, MI
RELATED REPORTS & OPTIONS
Food Preparation & Serving
Lake Orion
Compare Zip Codes
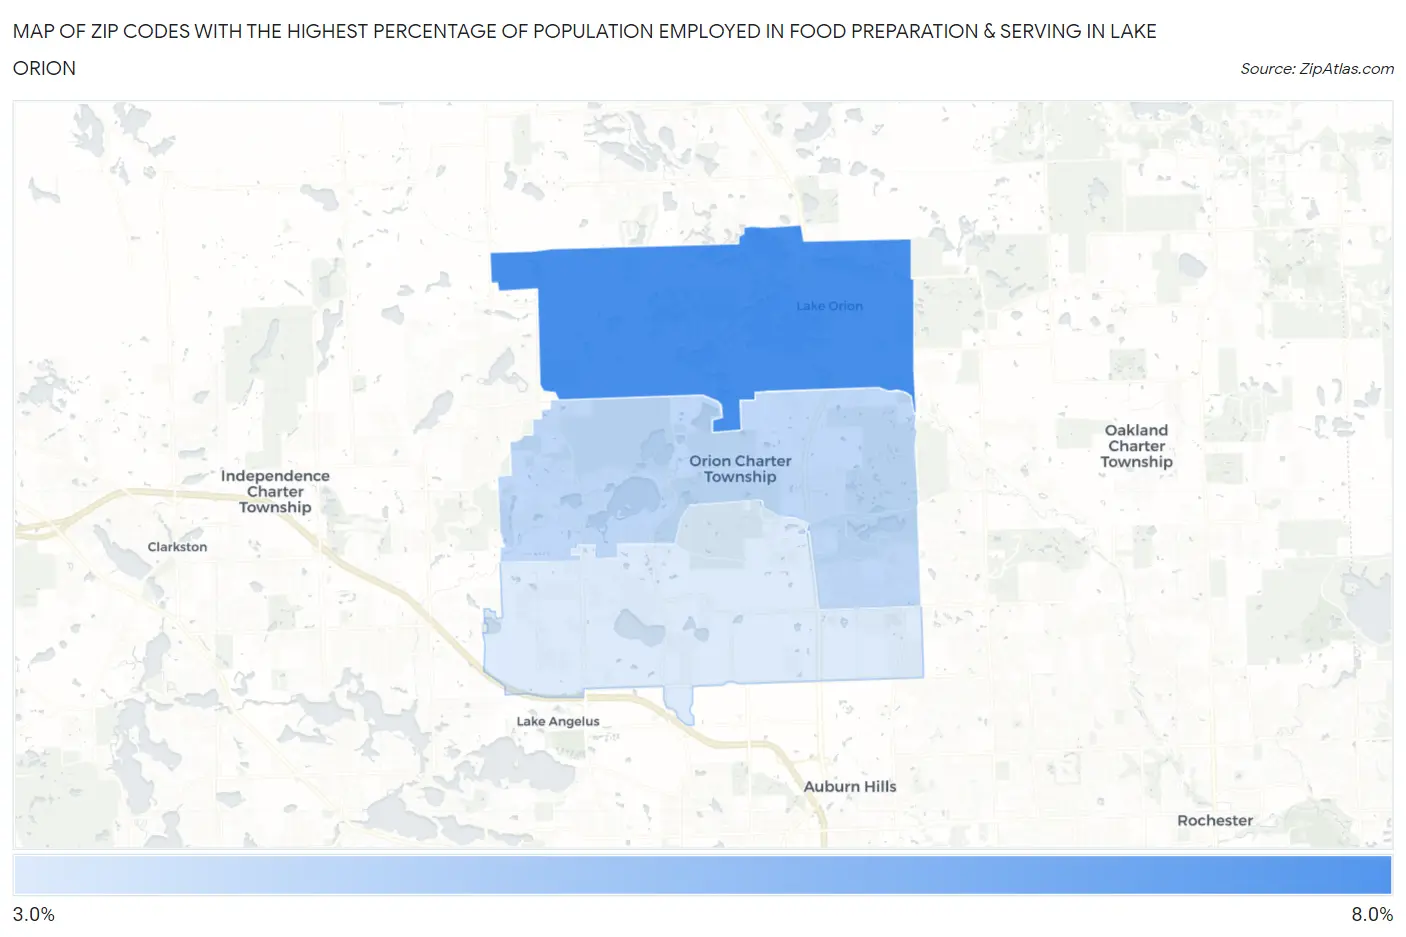
Map of Zip Codes with the Highest Percentage of Population Employed in Food Preparation & Serving in Lake Orion
3.8%
6.5%
Zip Codes with the Highest Percentage of Population Employed in Food Preparation & Serving in Lake Orion, MI
| Zip Code | % Employed | vs State | vs National | |
| 1. | 48362 | 6.5% | 5.7%(+0.862)#277 | 5.3%(+1.25)#7,782 |
| 2. | 48360 | 4.3% | 5.7%(-1.32)#584 | 5.3%(-0.936)#15,644 |
| 3. | 48359 | 3.8% | 5.7%(-1.84)#682 | 5.3%(-1.45)#17,799 |
1
Common Questions
What are the Top Zip Codes with the Highest Percentage of Population Employed in Food Preparation & Serving in Lake Orion, MI?
Top Zip Codes with the Highest Percentage of Population Employed in Food Preparation & Serving in Lake Orion, MI are:
What zip code has the Highest Percentage of Population Employed in Food Preparation & Serving in Lake Orion, MI?
48362 has the Highest Percentage of Population Employed in Food Preparation & Serving in Lake Orion, MI with 6.5%.
What is the Percentage of Population Employed in Food Preparation & Serving in Lake Orion, MI?
Percentage of Population Employed in Food Preparation & Serving in Lake Orion is 3.0%.
What is the Percentage of Population Employed in Food Preparation & Serving in Michigan?
Percentage of Population Employed in Food Preparation & Serving in Michigan is 5.7%.
What is the Percentage of Population Employed in Food Preparation & Serving in the United States?
Percentage of Population Employed in Food Preparation & Serving in the United States is 5.3%.