Zip Codes with the Highest Percentage of Population Employed in Food Preparation & Serving in Saginaw, MI
RELATED REPORTS & OPTIONS
Food Preparation & Serving
Saginaw
Compare Zip Codes
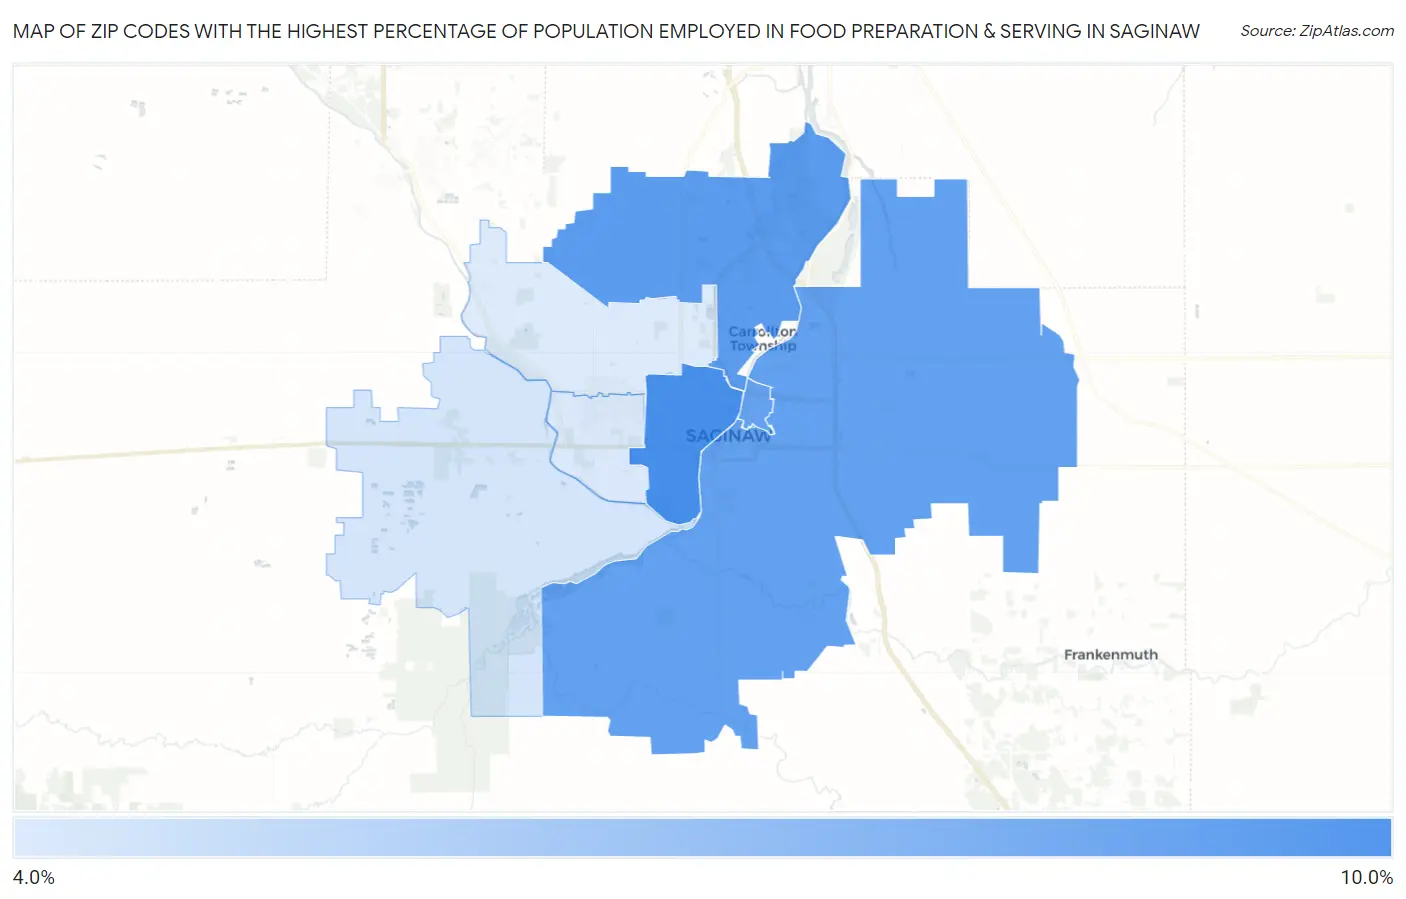
Map of Zip Codes with the Highest Percentage of Population Employed in Food Preparation & Serving in Saginaw
4.6%
9.8%
Zip Codes with the Highest Percentage of Population Employed in Food Preparation & Serving in Saginaw, MI
| Zip Code | % Employed | vs State | vs National | |
| 1. | 48602 | 9.8% | 5.7%(+4.10)#77 | 5.3%(+4.48)#2,823 |
| 2. | 48604 | 9.1% | 5.7%(+3.41)#97 | 5.3%(+3.80)#3,443 |
| 3. | 48601 | 8.8% | 5.7%(+3.10)#111 | 5.3%(+3.49)#3,756 |
| 4. | 48607 | 8.7% | 5.7%(+3.06)#112 | 5.3%(+3.45)#3,804 |
| 5. | 48609 | 4.9% | 5.7%(-0.783)#514 | 5.3%(-0.396)#13,398 |
| 6. | 48638 | 4.6% | 5.7%(-1.04)#541 | 5.3%(-0.654)#14,440 |
| 7. | 48603 | 4.6% | 5.7%(-1.08)#546 | 5.3%(-0.695)#14,636 |
1
Common Questions
What are the Top 5 Zip Codes with the Highest Percentage of Population Employed in Food Preparation & Serving in Saginaw, MI?
Top 5 Zip Codes with the Highest Percentage of Population Employed in Food Preparation & Serving in Saginaw, MI are:
What zip code has the Highest Percentage of Population Employed in Food Preparation & Serving in Saginaw, MI?
48602 has the Highest Percentage of Population Employed in Food Preparation & Serving in Saginaw, MI with 9.8%.
What is the Percentage of Population Employed in Food Preparation & Serving in Saginaw, MI?
Percentage of Population Employed in Food Preparation & Serving in Saginaw is 10.1%.
What is the Percentage of Population Employed in Food Preparation & Serving in Michigan?
Percentage of Population Employed in Food Preparation & Serving in Michigan is 5.7%.
What is the Percentage of Population Employed in Food Preparation & Serving in the United States?
Percentage of Population Employed in Food Preparation & Serving in the United States is 5.3%.