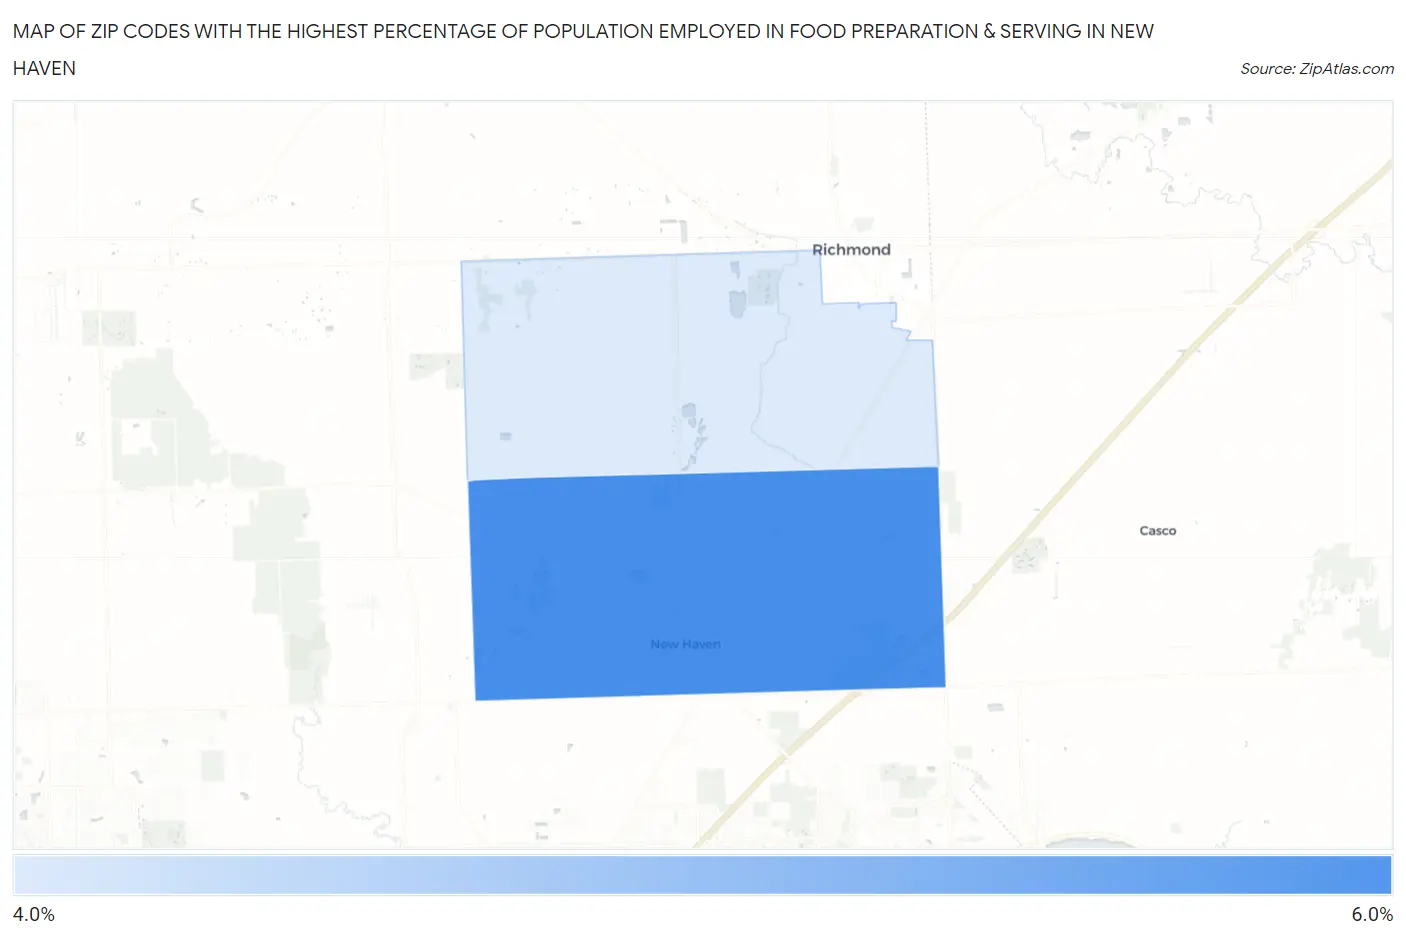
Zip Codes with the Highest Percentage of Population Employed in Food Preparation & Serving in New Haven, MI
RELATED REPORTS & OPTIONS
Food Preparation & Serving
New Haven
Compare Zip Codes
Map of Zip Codes with the Highest Percentage of Population Employed in Food Preparation & Serving in New Haven
4.9%
5.6%
Zip Codes with the Highest Percentage of Population Employed in Food Preparation & Serving in New Haven, MI
| Zip Code | % Employed | vs State | vs National | |
| 1. | 48048 | 5.6% | 5.7%(-0.114)#407 | 5.3%(+0.273)#10,846 |
| 2. | 48050 | 4.9% | 5.7%(-0.765)#509 | 5.3%(-0.378)#13,311 |
1
Common Questions
What are the Top Zip Codes with the Highest Percentage of Population Employed in Food Preparation & Serving in New Haven, MI?
Top Zip Codes with the Highest Percentage of Population Employed in Food Preparation & Serving in New Haven, MI are:
What zip code has the Highest Percentage of Population Employed in Food Preparation & Serving in New Haven, MI?
48048 has the Highest Percentage of Population Employed in Food Preparation & Serving in New Haven, MI with 5.6%.
What is the Percentage of Population Employed in Food Preparation & Serving in New Haven, MI?
Percentage of Population Employed in Food Preparation & Serving in New Haven is 4.3%.
What is the Percentage of Population Employed in Food Preparation & Serving in Michigan?
Percentage of Population Employed in Food Preparation & Serving in Michigan is 5.7%.
What is the Percentage of Population Employed in Food Preparation & Serving in the United States?
Percentage of Population Employed in Food Preparation & Serving in the United States is 5.3%.