Zip Codes with the Highest Percentage of Population Employed in Food Preparation & Serving in Bloomfield Hills, MI
RELATED REPORTS & OPTIONS
Food Preparation & Serving
Bloomfield Hills
Compare Zip Codes
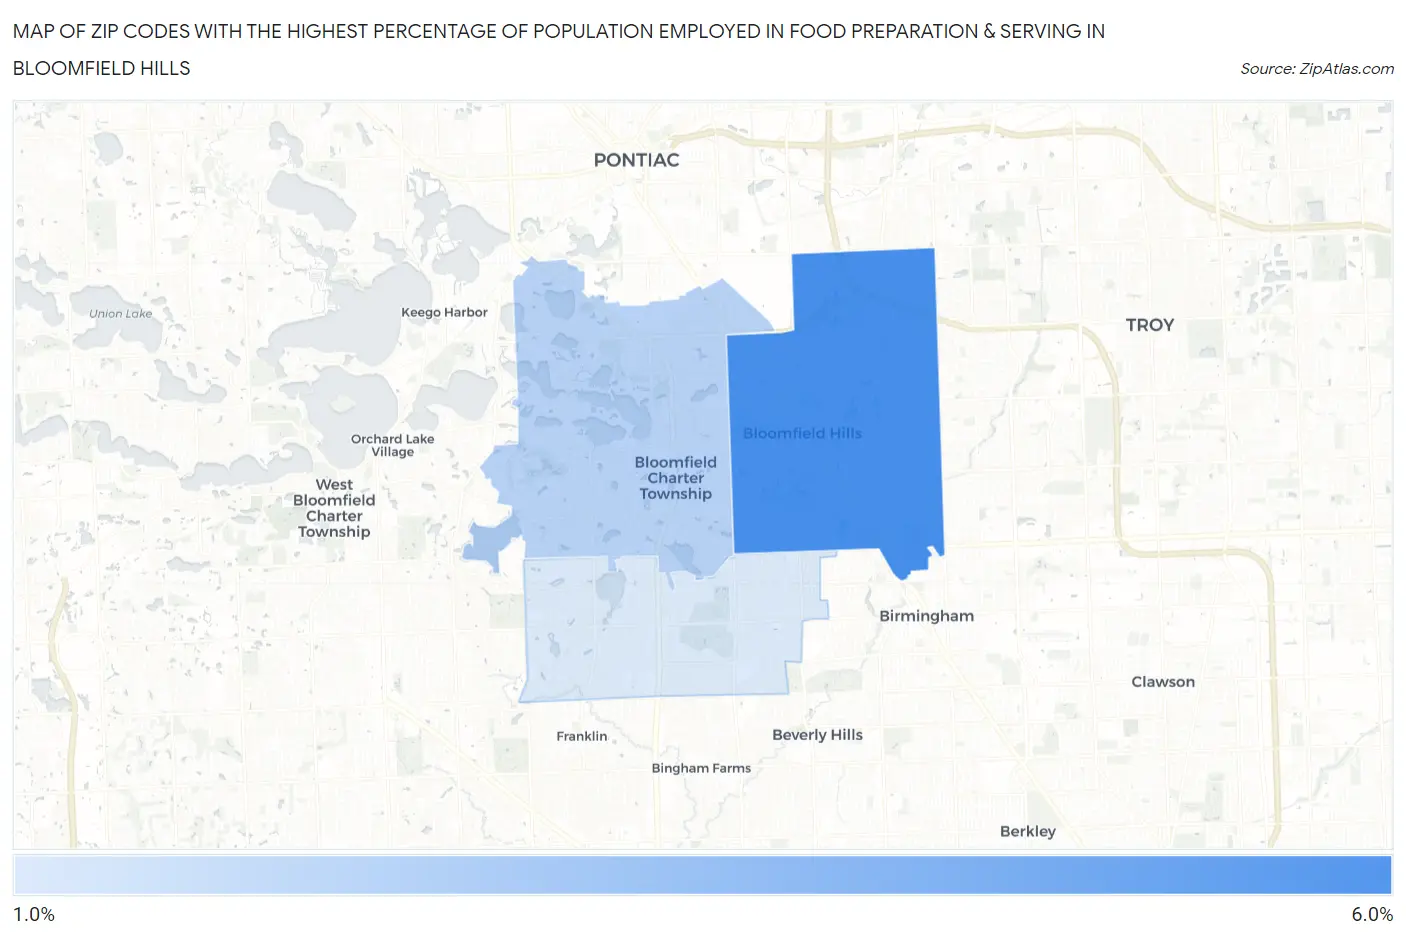
Map of Zip Codes with the Highest Percentage of Population Employed in Food Preparation & Serving in Bloomfield Hills
1.7%
5.4%
Zip Codes with the Highest Percentage of Population Employed in Food Preparation & Serving in Bloomfield Hills, MI
| Zip Code | % Employed | vs State | vs National | |
| 1. | 48304 | 5.4% | 5.7%(-0.239)#432 | 5.3%(+0.148)#11,288 |
| 2. | 48302 | 2.7% | 5.7%(-3.01)#823 | 5.3%(-2.63)#22,569 |
| 3. | 48301 | 1.7% | 5.7%(-3.93)#882 | 5.3%(-3.55)#25,425 |
1
Common Questions
What are the Top Zip Codes with the Highest Percentage of Population Employed in Food Preparation & Serving in Bloomfield Hills, MI?
Top Zip Codes with the Highest Percentage of Population Employed in Food Preparation & Serving in Bloomfield Hills, MI are:
What zip code has the Highest Percentage of Population Employed in Food Preparation & Serving in Bloomfield Hills, MI?
48304 has the Highest Percentage of Population Employed in Food Preparation & Serving in Bloomfield Hills, MI with 5.4%.
What is the Percentage of Population Employed in Food Preparation & Serving in Bloomfield Hills, MI?
Percentage of Population Employed in Food Preparation & Serving in Bloomfield Hills is 4.1%.
What is the Percentage of Population Employed in Food Preparation & Serving in Michigan?
Percentage of Population Employed in Food Preparation & Serving in Michigan is 5.7%.
What is the Percentage of Population Employed in Food Preparation & Serving in the United States?
Percentage of Population Employed in Food Preparation & Serving in the United States is 5.3%.