Zip Codes with the Highest Percentage of Self-Employed / Not Incorporated in Houma, LA
RELATED REPORTS & OPTIONS
Self-Employed / Not Incorporated
Houma
Compare Zip Codes
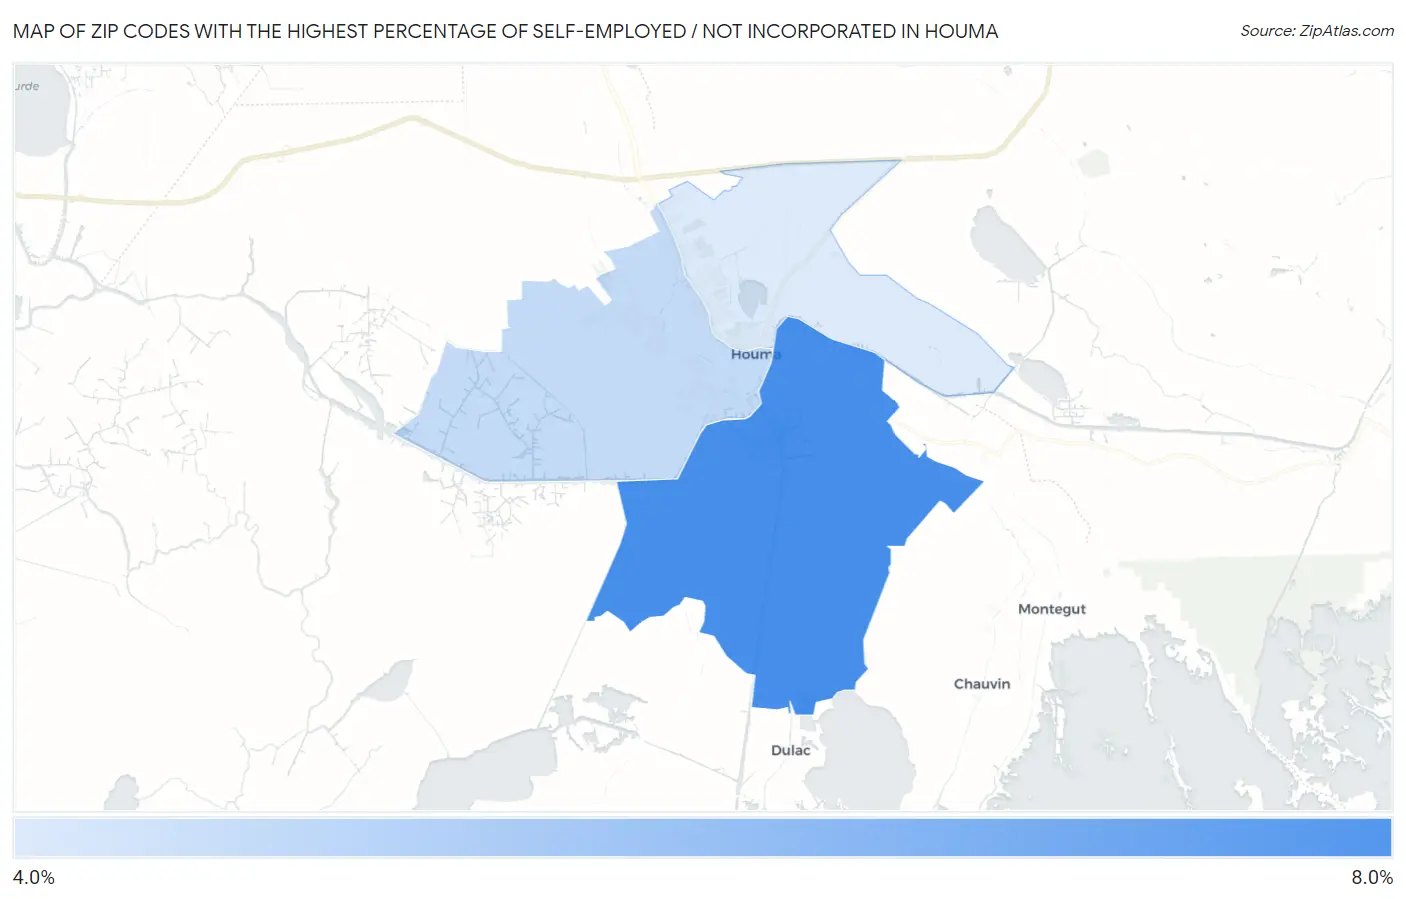
Map of Zip Codes with the Highest Percentage of Self-Employed / Not Incorporated in Houma
0.0%
8.0%
Zip Codes with the Highest Percentage of Self-Employed / Not Incorporated in Houma, LA
| Zip Code | % Self-Employed / Not Incorporated | vs State | vs National | |
| 1. | 70363 | 6.3% | 6.3%(-0.022)#205 | 5.8%(+0.455)#15,190 |
| 2. | 70360 | 4.5% | 6.3%(-1.82)#308 | 5.8%(-1.34)#21,682 |
| 3. | 70364 | 4.1% | 6.3%(-2.19)#327 | 5.8%(-1.71)#23,035 |
1
Common Questions
What are the Top Zip Codes with the Highest Percentage of Self-Employed / Not Incorporated in Houma, LA?
Top Zip Codes with the Highest Percentage of Self-Employed / Not Incorporated in Houma, LA are:
What zip code has the Highest Percentage of Self-Employed / Not Incorporated in Houma, LA?
70363 has the Highest Percentage of Self-Employed / Not Incorporated in Houma, LA with 6.3%.
What is the Percentage of Self-Employed / Not Incorporated in Houma, LA?
Percentage of Self-Employed / Not Incorporated in Houma is 2.9%.
What is the Percentage of Self-Employed / Not Incorporated in Louisiana?
Percentage of Self-Employed / Not Incorporated in Louisiana is 6.3%.
What is the Percentage of Self-Employed / Not Incorporated in the United States?
Percentage of Self-Employed / Not Incorporated in the United States is 5.8%.