Zip Codes with the Highest Percentage of Population Employed in Legal Services & Support in Hammond, LA
RELATED REPORTS & OPTIONS
Legal Services & Support
Hammond
Compare Zip Codes
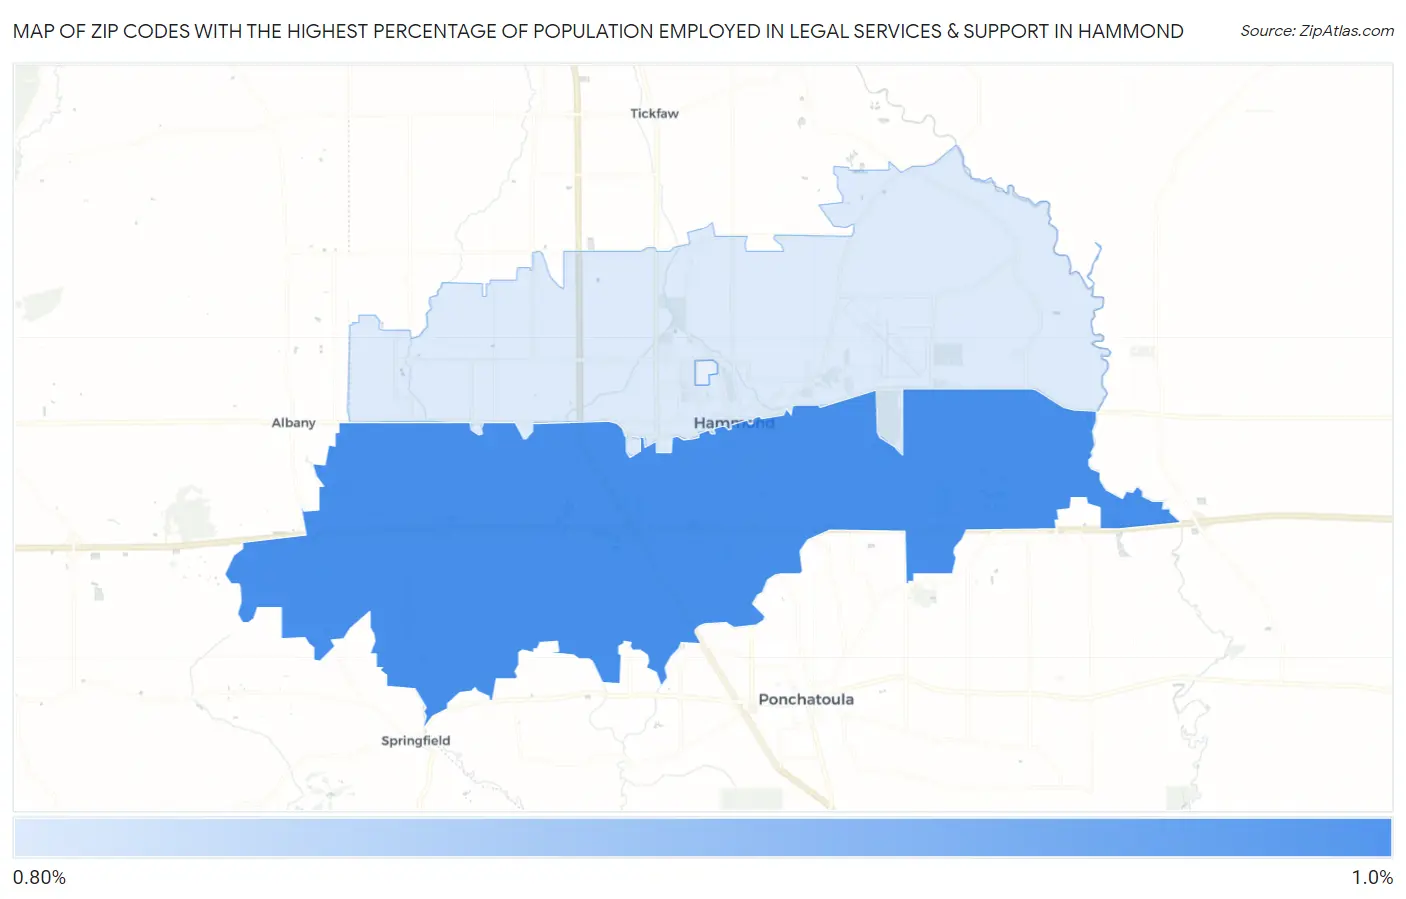
Map of Zip Codes with the Highest Percentage of Population Employed in Legal Services & Support in Hammond
0.81%
0.94%
Zip Codes with the Highest Percentage of Population Employed in Legal Services & Support in Hammond, LA
| Zip Code | % Employed | vs State | vs National | |
| 1. | 70403 | 0.94% | 1.3%(-0.387)#145 | 1.2%(-0.240)#8,247 |
| 2. | 70401 | 0.81% | 1.3%(-0.519)#159 | 1.2%(-0.372)#9,338 |
1
Common Questions
What are the Top Zip Codes with the Highest Percentage of Population Employed in Legal Services & Support in Hammond, LA?
Top Zip Codes with the Highest Percentage of Population Employed in Legal Services & Support in Hammond, LA are:
What zip code has the Highest Percentage of Population Employed in Legal Services & Support in Hammond, LA?
70403 has the Highest Percentage of Population Employed in Legal Services & Support in Hammond, LA with 0.94%.
What is the Percentage of Population Employed in Legal Services & Support in Hammond, LA?
Percentage of Population Employed in Legal Services & Support in Hammond is 0.63%.
What is the Percentage of Population Employed in Legal Services & Support in Louisiana?
Percentage of Population Employed in Legal Services & Support in Louisiana is 1.3%.
What is the Percentage of Population Employed in Legal Services & Support in the United States?
Percentage of Population Employed in Legal Services & Support in the United States is 1.2%.