Zip Codes with the Highest Percentage of Population Employed in Administrative & Support Services in Hammond, LA
RELATED REPORTS & OPTIONS
Administrative & Support Services
Hammond
Compare Zip Codes
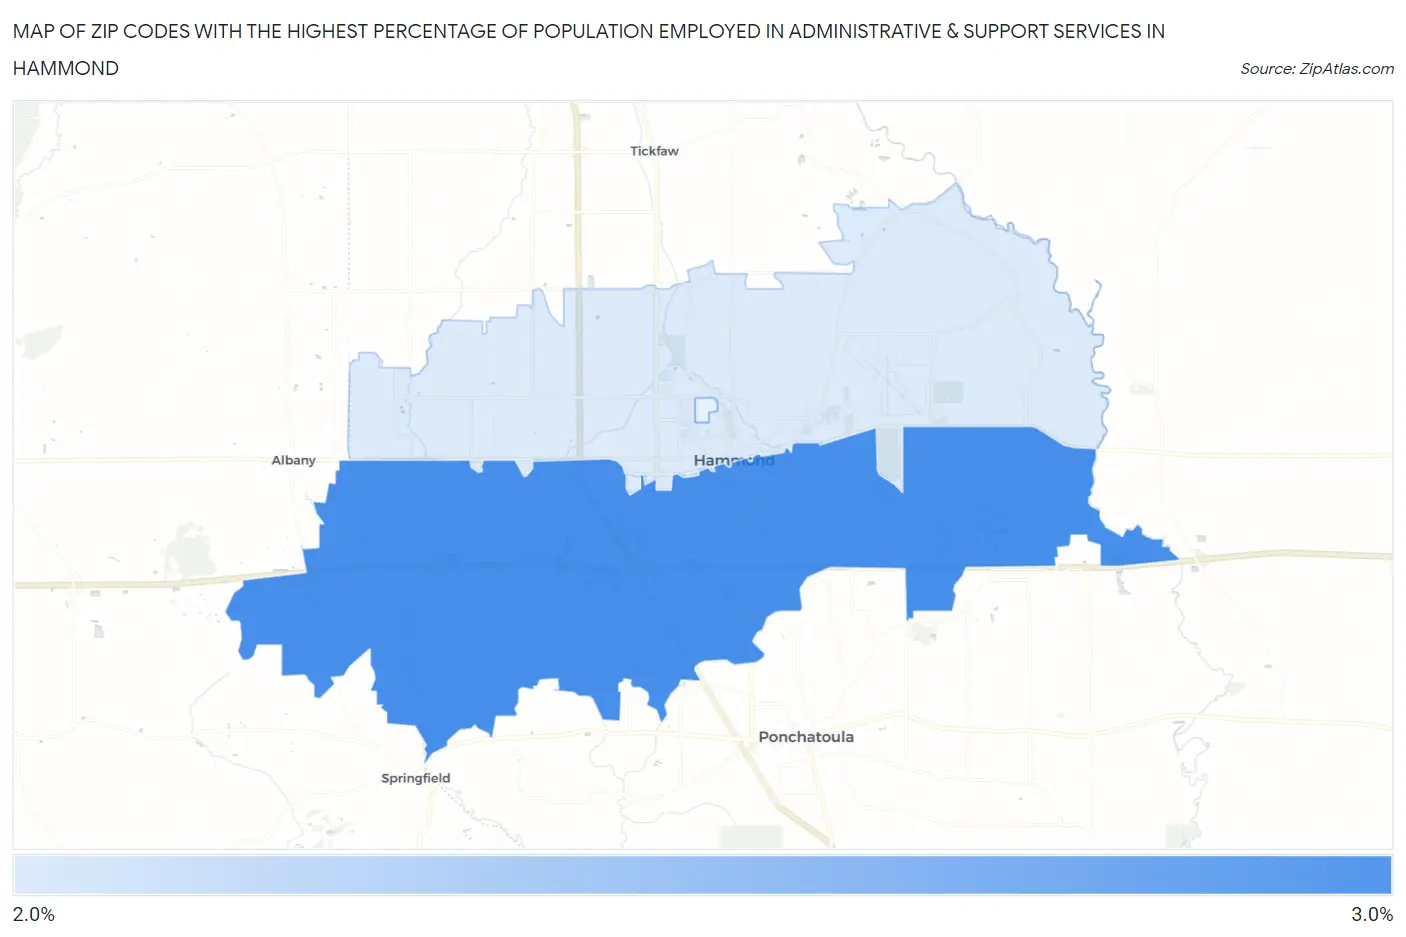
Map of Zip Codes with the Highest Percentage of Population Employed in Administrative & Support Services in Hammond
2.1%
2.7%
Zip Codes with the Highest Percentage of Population Employed in Administrative & Support Services in Hammond, LA
| Zip Code | % Employed | vs State | vs National | |
| 1. | 70403 | 2.7% | 3.8%(-1.11)#278 | 4.1%(-1.50)#17,331 |
| 2. | 70401 | 2.1% | 3.8%(-1.71)#315 | 4.1%(-2.10)#20,358 |
1
Common Questions
What are the Top Zip Codes with the Highest Percentage of Population Employed in Administrative & Support Services in Hammond, LA?
Top Zip Codes with the Highest Percentage of Population Employed in Administrative & Support Services in Hammond, LA are:
What zip code has the Highest Percentage of Population Employed in Administrative & Support Services in Hammond, LA?
70403 has the Highest Percentage of Population Employed in Administrative & Support Services in Hammond, LA with 2.7%.
What is the Percentage of Population Employed in Administrative & Support Services in Hammond, LA?
Percentage of Population Employed in Administrative & Support Services in Hammond is 2.3%.
What is the Percentage of Population Employed in Administrative & Support Services in Louisiana?
Percentage of Population Employed in Administrative & Support Services in Louisiana is 3.8%.
What is the Percentage of Population Employed in Administrative & Support Services in the United States?
Percentage of Population Employed in Administrative & Support Services in the United States is 4.1%.