Zip Codes with the Highest Percentage of Households Heated by Electricity in Lenexa, KS
RELATED REPORTS & OPTIONS
Electrical Heating
Lenexa
Compare Zip Codes
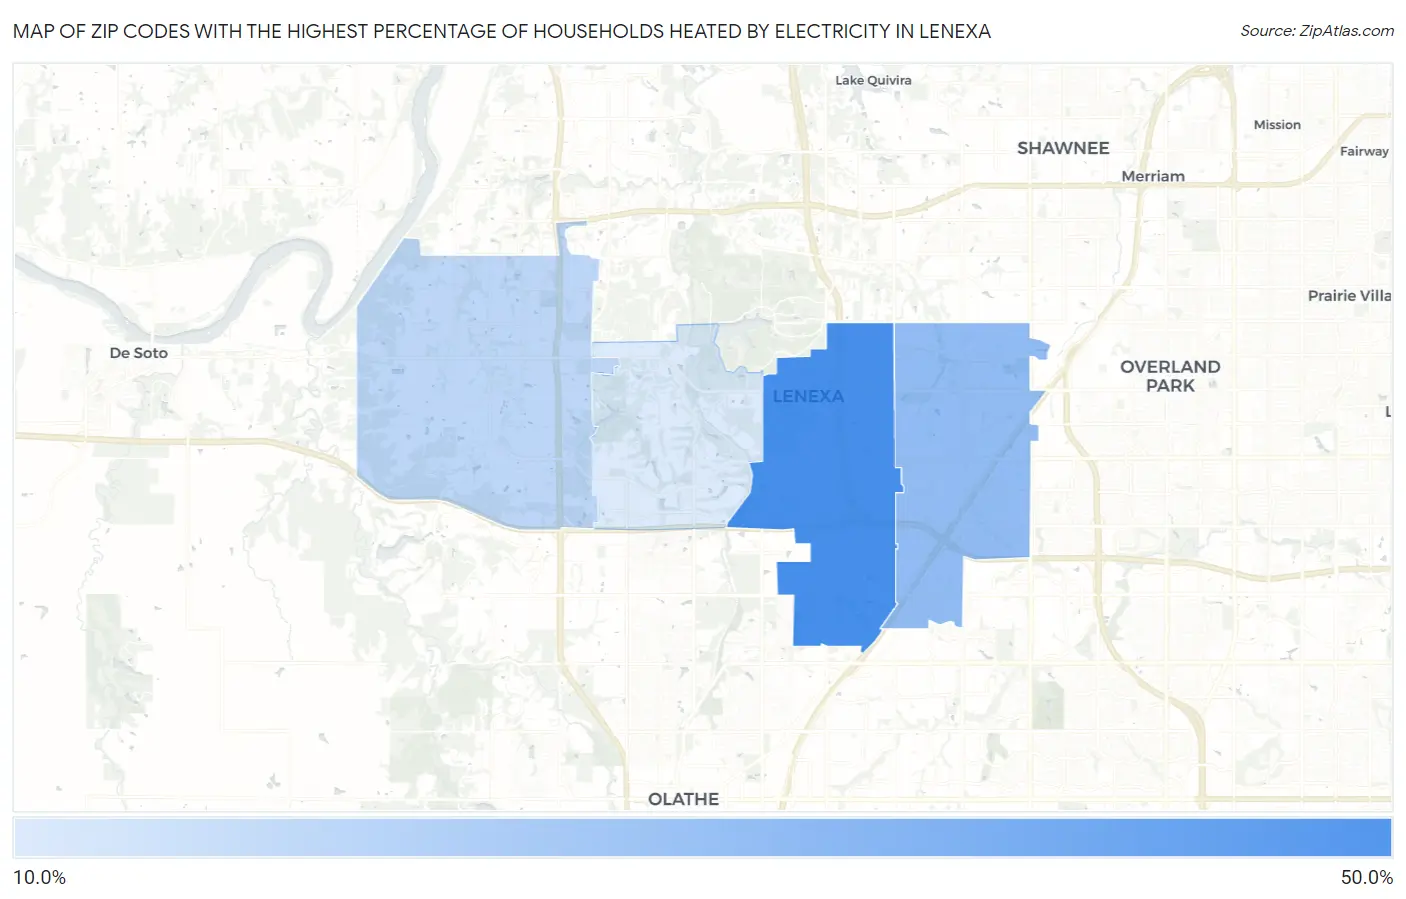
Map of Zip Codes with the Highest Percentage of Households Heated by Electricity in Lenexa
0.0%
50.0%
Zip Codes with the Highest Percentage of Households Heated by Electricity in Lenexa, KS
| Zip Code | Electrical Heating | vs State | vs National | |
| 1. | 66219 | 47.8% | 26.0%(+21.8)#19 | 40.2%(+7.60)#10,523 |
| 2. | 66215 | 30.3% | 26.0%(+4.30)#112 | 40.2%(-9.90)#15,857 |
| 3. | 66227 | 21.3% | 26.0%(-4.70)#261 | 40.2%(-18.9)#19,844 |
| 4. | 66220 | 14.7% | 26.0%(-11.3)#439 | 40.2%(-25.5)#23,416 |
1
Common Questions
What are the Top 3 Zip Codes with the Highest Percentage of Households Heated by Electricity in Lenexa, KS?
Top 3 Zip Codes with the Highest Percentage of Households Heated by Electricity in Lenexa, KS are:
What zip code has the Highest Percentage of Households Heated by Electricity in Lenexa, KS?
66219 has the Highest Percentage of Households Heated by Electricity in Lenexa, KS with 47.8%.
What is the Percentage of Households Heated by Electricity in Lenexa, KS?
Percentage of Households Heated by Electricity in Lenexa is 31.9%.
What is the Percentage of Households Heated by Electricity in Kansas?
Percentage of Households Heated by Electricity in Kansas is 26.0%.
What is the Percentage of Households Heated by Electricity in the United States?
Percentage of Households Heated by Electricity in the United States is 40.2%.