Zip Codes with the Highest Percentage of Population Employed in Legal Services & Support in Noblesville, IN
RELATED REPORTS & OPTIONS
Legal Services & Support
Noblesville
Compare Zip Codes
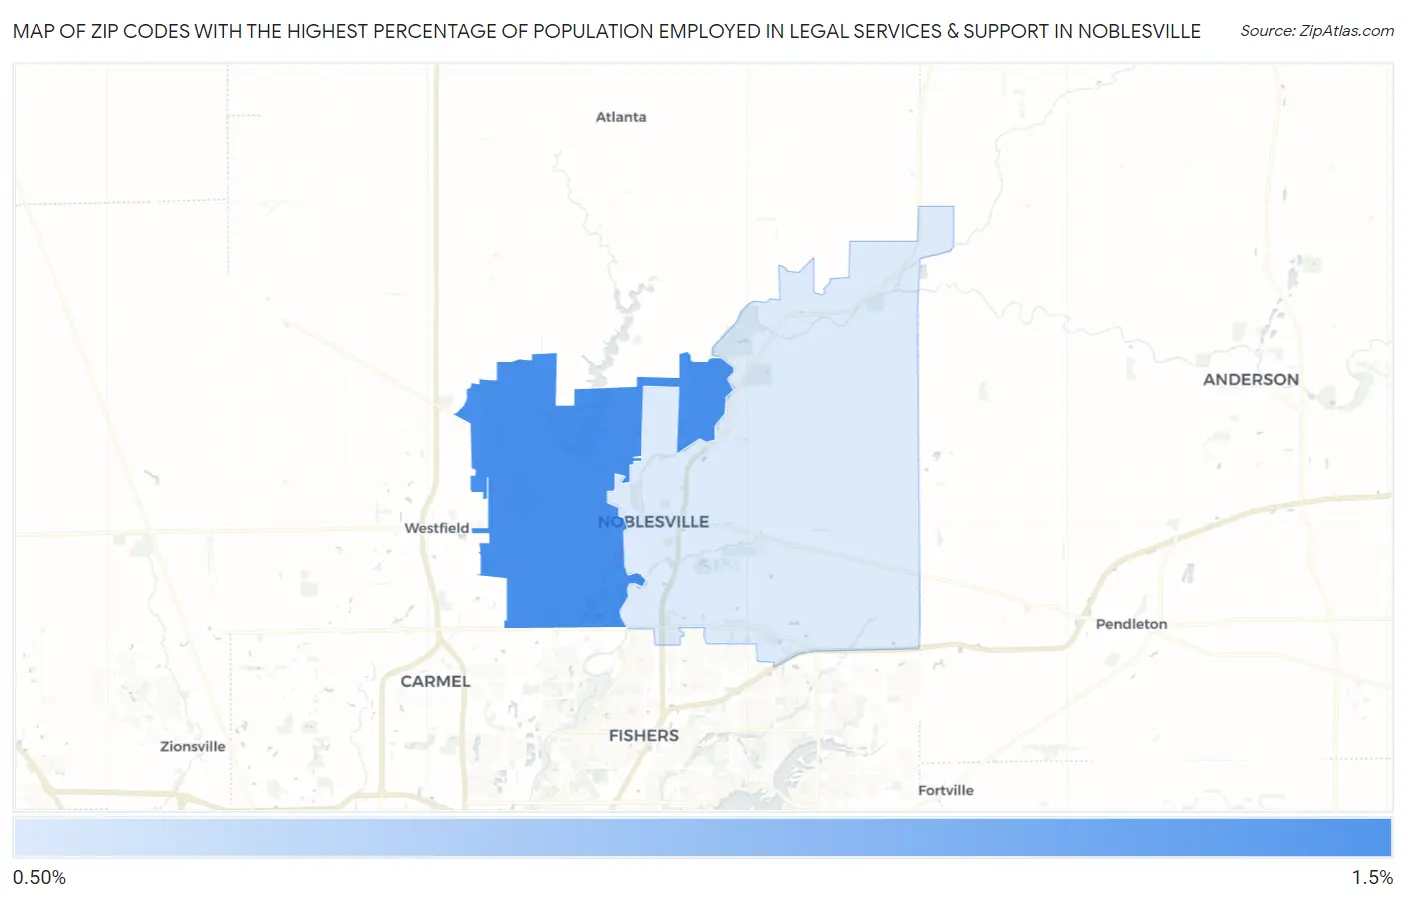
Map of Zip Codes with the Highest Percentage of Population Employed in Legal Services & Support in Noblesville
0.63%
1.2%
Zip Codes with the Highest Percentage of Population Employed in Legal Services & Support in Noblesville, IN
| Zip Code | % Employed | vs State | vs National | |
| 1. | 46062 | 1.2% | 0.76%(+0.434)#87 | 1.2%(+0.012)#6,522 |
| 2. | 46060 | 0.63% | 0.76%(-0.131)#173 | 1.2%(-0.552)#11,115 |
1
Common Questions
What are the Top Zip Codes with the Highest Percentage of Population Employed in Legal Services & Support in Noblesville, IN?
Top Zip Codes with the Highest Percentage of Population Employed in Legal Services & Support in Noblesville, IN are:
What zip code has the Highest Percentage of Population Employed in Legal Services & Support in Noblesville, IN?
46062 has the Highest Percentage of Population Employed in Legal Services & Support in Noblesville, IN with 1.2%.
What is the Percentage of Population Employed in Legal Services & Support in Noblesville, IN?
Percentage of Population Employed in Legal Services & Support in Noblesville is 0.78%.
What is the Percentage of Population Employed in Legal Services & Support in Indiana?
Percentage of Population Employed in Legal Services & Support in Indiana is 0.76%.
What is the Percentage of Population Employed in Legal Services & Support in the United States?
Percentage of Population Employed in Legal Services & Support in the United States is 1.2%.