Zip Codes with the Highest Percentage of Population Employed in Legal Services & Support in Columbus, IN
RELATED REPORTS & OPTIONS
Legal Services & Support
Columbus
Compare Zip Codes
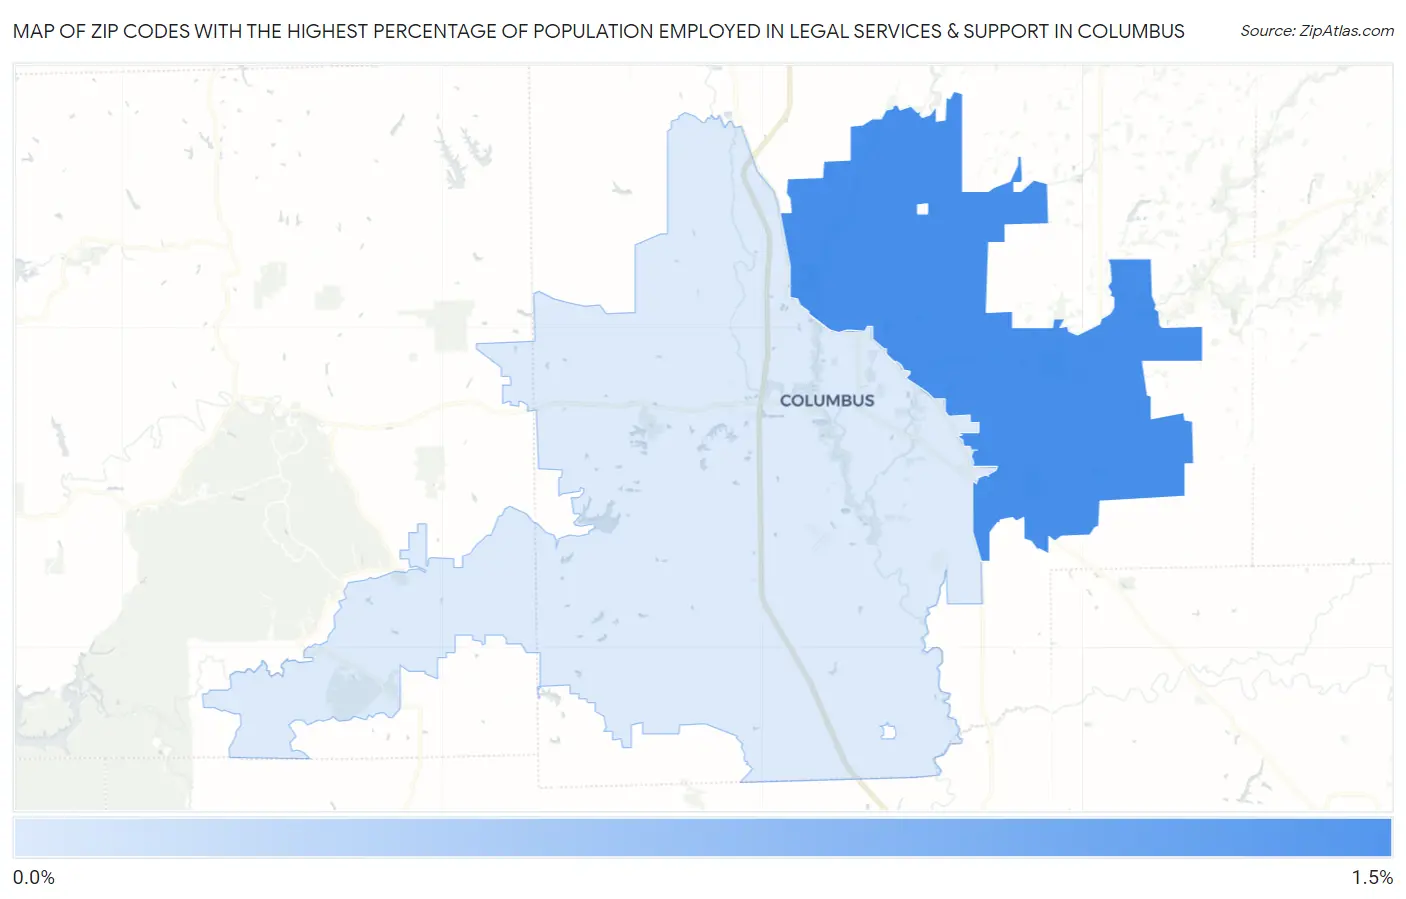
Map of Zip Codes with the Highest Percentage of Population Employed in Legal Services & Support in Columbus
0.33%
1.2%
Zip Codes with the Highest Percentage of Population Employed in Legal Services & Support in Columbus, IN
| Zip Code | % Employed | vs State | vs National | |
| 1. | 47203 | 1.2% | 0.76%(+0.484)#81 | 1.2%(+0.063)#6,228 |
| 2. | 47201 | 0.33% | 0.76%(-0.431)#275 | 1.2%(-0.853)#14,689 |
1
Common Questions
What are the Top Zip Codes with the Highest Percentage of Population Employed in Legal Services & Support in Columbus, IN?
Top Zip Codes with the Highest Percentage of Population Employed in Legal Services & Support in Columbus, IN are:
What zip code has the Highest Percentage of Population Employed in Legal Services & Support in Columbus, IN?
47203 has the Highest Percentage of Population Employed in Legal Services & Support in Columbus, IN with 1.2%.
What is the Percentage of Population Employed in Legal Services & Support in Columbus, IN?
Percentage of Population Employed in Legal Services & Support in Columbus is 0.55%.
What is the Percentage of Population Employed in Legal Services & Support in Indiana?
Percentage of Population Employed in Legal Services & Support in Indiana is 0.76%.
What is the Percentage of Population Employed in Legal Services & Support in the United States?
Percentage of Population Employed in Legal Services & Support in the United States is 1.2%.