Zip Codes with the Highest Percentage of Population Employed in Legal Services & Support in Lafayette, IN
RELATED REPORTS & OPTIONS
Legal Services & Support
Lafayette
Compare Zip Codes
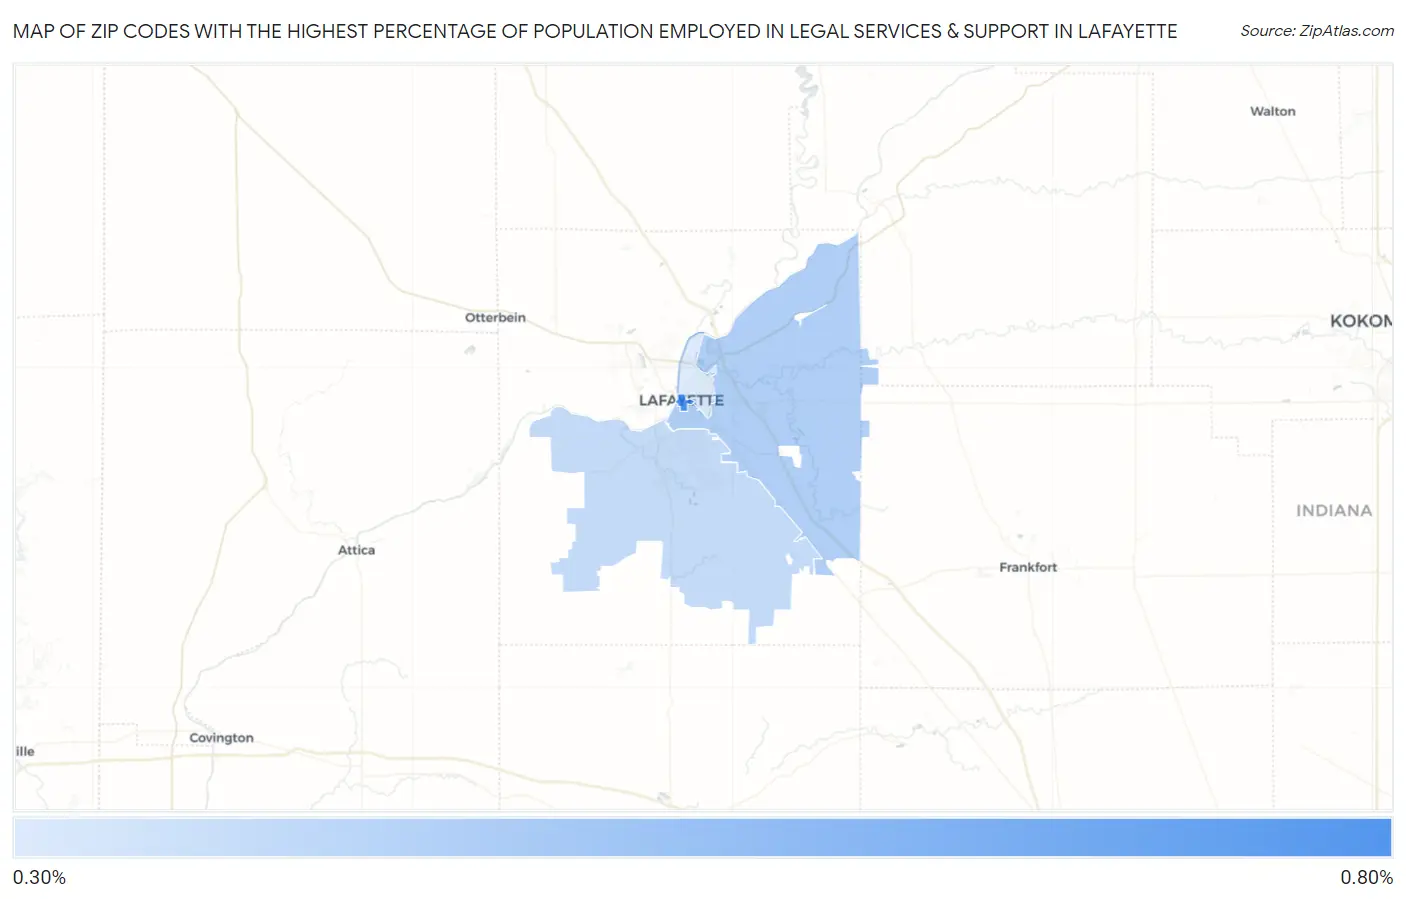
Map of Zip Codes with the Highest Percentage of Population Employed in Legal Services & Support in Lafayette
0.40%
0.63%
Zip Codes with the Highest Percentage of Population Employed in Legal Services & Support in Lafayette, IN
| Zip Code | % Employed | vs State | vs National | |
| 1. | 47901 | 0.63% | 0.76%(-0.136)#175 | 1.2%(-0.558)#11,188 |
| 2. | 47905 | 0.47% | 0.76%(-0.296)#218 | 1.2%(-0.718)#13,052 |
| 3. | 47909 | 0.43% | 0.76%(-0.327)#231 | 1.2%(-0.749)#13,427 |
| 4. | 47904 | 0.40% | 0.76%(-0.365)#242 | 1.2%(-0.786)#13,863 |
1
Common Questions
What are the Top 3 Zip Codes with the Highest Percentage of Population Employed in Legal Services & Support in Lafayette, IN?
Top 3 Zip Codes with the Highest Percentage of Population Employed in Legal Services & Support in Lafayette, IN are:
What zip code has the Highest Percentage of Population Employed in Legal Services & Support in Lafayette, IN?
47901 has the Highest Percentage of Population Employed in Legal Services & Support in Lafayette, IN with 0.63%.
What is the Percentage of Population Employed in Legal Services & Support in Lafayette, IN?
Percentage of Population Employed in Legal Services & Support in Lafayette is 0.49%.
What is the Percentage of Population Employed in Legal Services & Support in Indiana?
Percentage of Population Employed in Legal Services & Support in Indiana is 0.76%.
What is the Percentage of Population Employed in Legal Services & Support in the United States?
Percentage of Population Employed in Legal Services & Support in the United States is 1.2%.