Zip Codes with the Highest Percentage of Population Employed in Food Preparation & Serving in Lafayette, IN
RELATED REPORTS & OPTIONS
Food Preparation & Serving
Lafayette
Compare Zip Codes
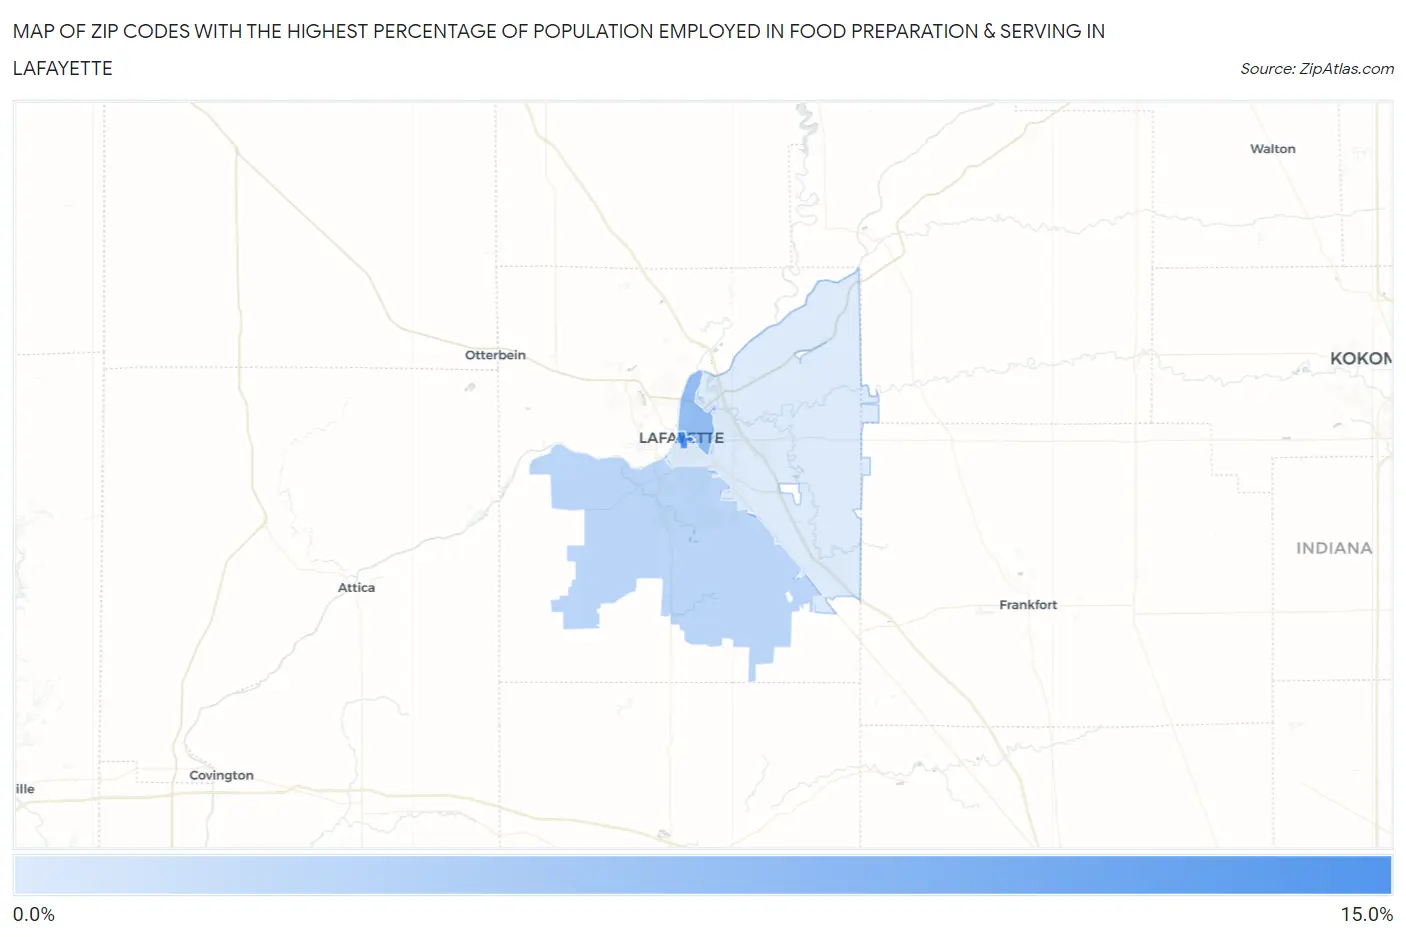
Map of Zip Codes with the Highest Percentage of Population Employed in Food Preparation & Serving in Lafayette
3.7%
14.5%
Zip Codes with the Highest Percentage of Population Employed in Food Preparation & Serving in Lafayette, IN
| Zip Code | % Employed | vs State | vs National | |
| 1. | 47901 | 14.5% | 5.3%(+9.15)#18 | 5.3%(+9.18)#1,065 |
| 2. | 47904 | 8.9% | 5.3%(+3.55)#83 | 5.3%(+3.57)#3,655 |
| 3. | 47909 | 6.0% | 5.3%(+0.700)#232 | 5.3%(+0.728)#9,301 |
| 4. | 47905 | 3.7% | 5.3%(-1.64)#465 | 5.3%(-1.61)#18,468 |
1
Common Questions
What are the Top 3 Zip Codes with the Highest Percentage of Population Employed in Food Preparation & Serving in Lafayette, IN?
Top 3 Zip Codes with the Highest Percentage of Population Employed in Food Preparation & Serving in Lafayette, IN are:
What zip code has the Highest Percentage of Population Employed in Food Preparation & Serving in Lafayette, IN?
47901 has the Highest Percentage of Population Employed in Food Preparation & Serving in Lafayette, IN with 14.5%.
What is the Percentage of Population Employed in Food Preparation & Serving in Lafayette, IN?
Percentage of Population Employed in Food Preparation & Serving in Lafayette is 6.8%.
What is the Percentage of Population Employed in Food Preparation & Serving in Indiana?
Percentage of Population Employed in Food Preparation & Serving in Indiana is 5.3%.
What is the Percentage of Population Employed in Food Preparation & Serving in the United States?
Percentage of Population Employed in Food Preparation & Serving in the United States is 5.3%.