Zip Codes with the Highest Percentage of Population Employed in Food Preparation & Serving in Goshen, IN
RELATED REPORTS & OPTIONS
Food Preparation & Serving
Goshen
Compare Zip Codes
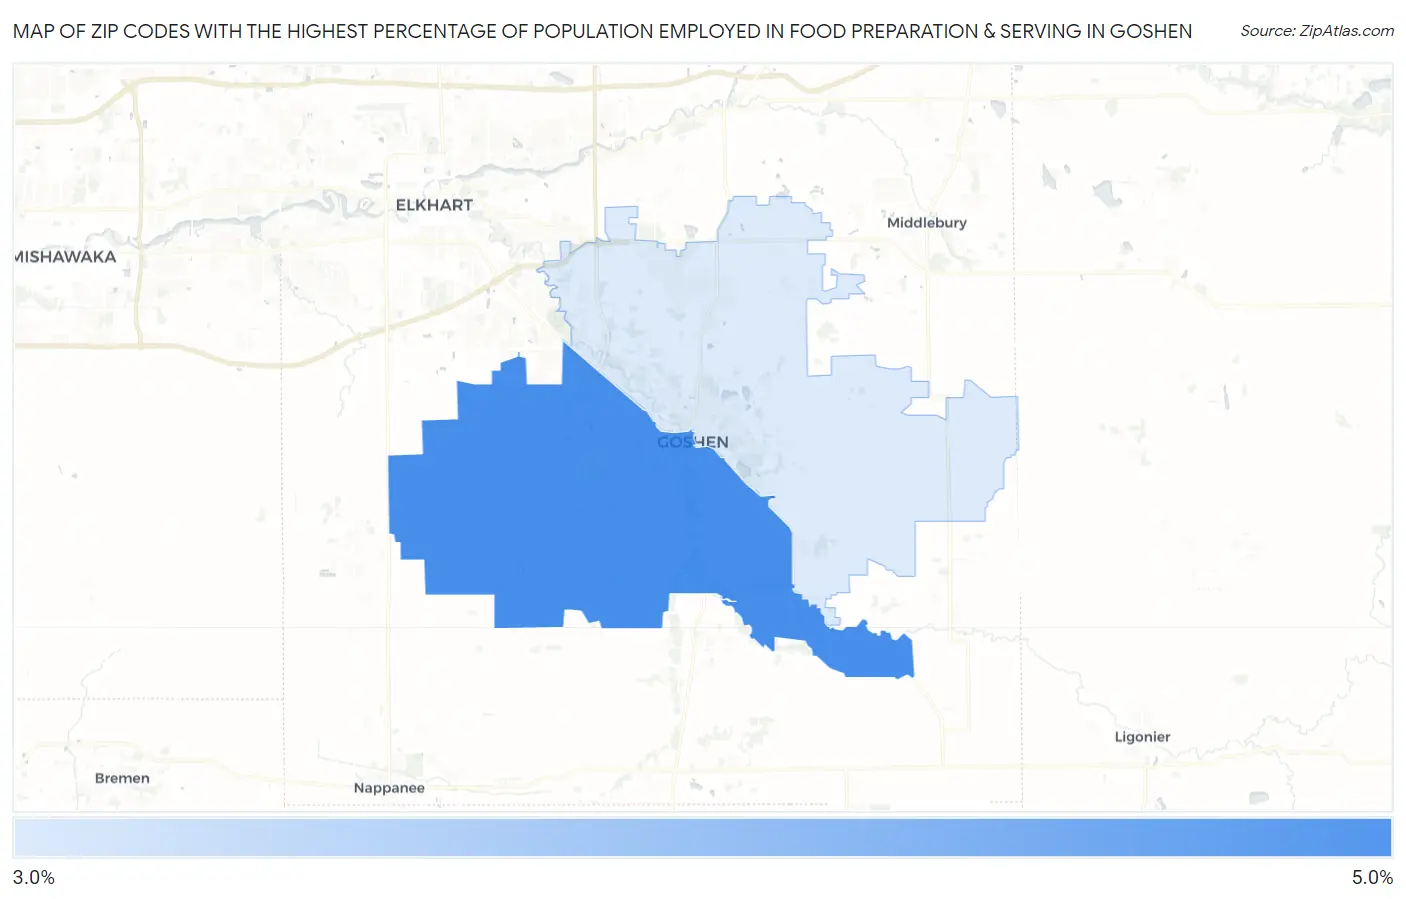
Map of Zip Codes with the Highest Percentage of Population Employed in Food Preparation & Serving in Goshen
3.0%
4.3%
Zip Codes with the Highest Percentage of Population Employed in Food Preparation & Serving in Goshen, IN
| Zip Code | % Employed | vs State | vs National | |
| 1. | 46526 | 4.3% | 5.3%(-1.04)#404 | 5.3%(-1.01)#15,982 |
| 2. | 46528 | 3.0% | 5.3%(-2.30)#530 | 5.3%(-2.27)#21,219 |
1
Common Questions
What are the Top Zip Codes with the Highest Percentage of Population Employed in Food Preparation & Serving in Goshen, IN?
Top Zip Codes with the Highest Percentage of Population Employed in Food Preparation & Serving in Goshen, IN are:
What zip code has the Highest Percentage of Population Employed in Food Preparation & Serving in Goshen, IN?
46526 has the Highest Percentage of Population Employed in Food Preparation & Serving in Goshen, IN with 4.3%.
What is the Percentage of Population Employed in Food Preparation & Serving in Goshen, IN?
Percentage of Population Employed in Food Preparation & Serving in Goshen is 4.5%.
What is the Percentage of Population Employed in Food Preparation & Serving in Indiana?
Percentage of Population Employed in Food Preparation & Serving in Indiana is 5.3%.
What is the Percentage of Population Employed in Food Preparation & Serving in the United States?
Percentage of Population Employed in Food Preparation & Serving in the United States is 5.3%.