Zip Codes with the Highest Percentage of Population Employed in Office & Administration in Evanston, IL
RELATED REPORTS & OPTIONS
Office & Administration
Evanston
Compare Zip Codes
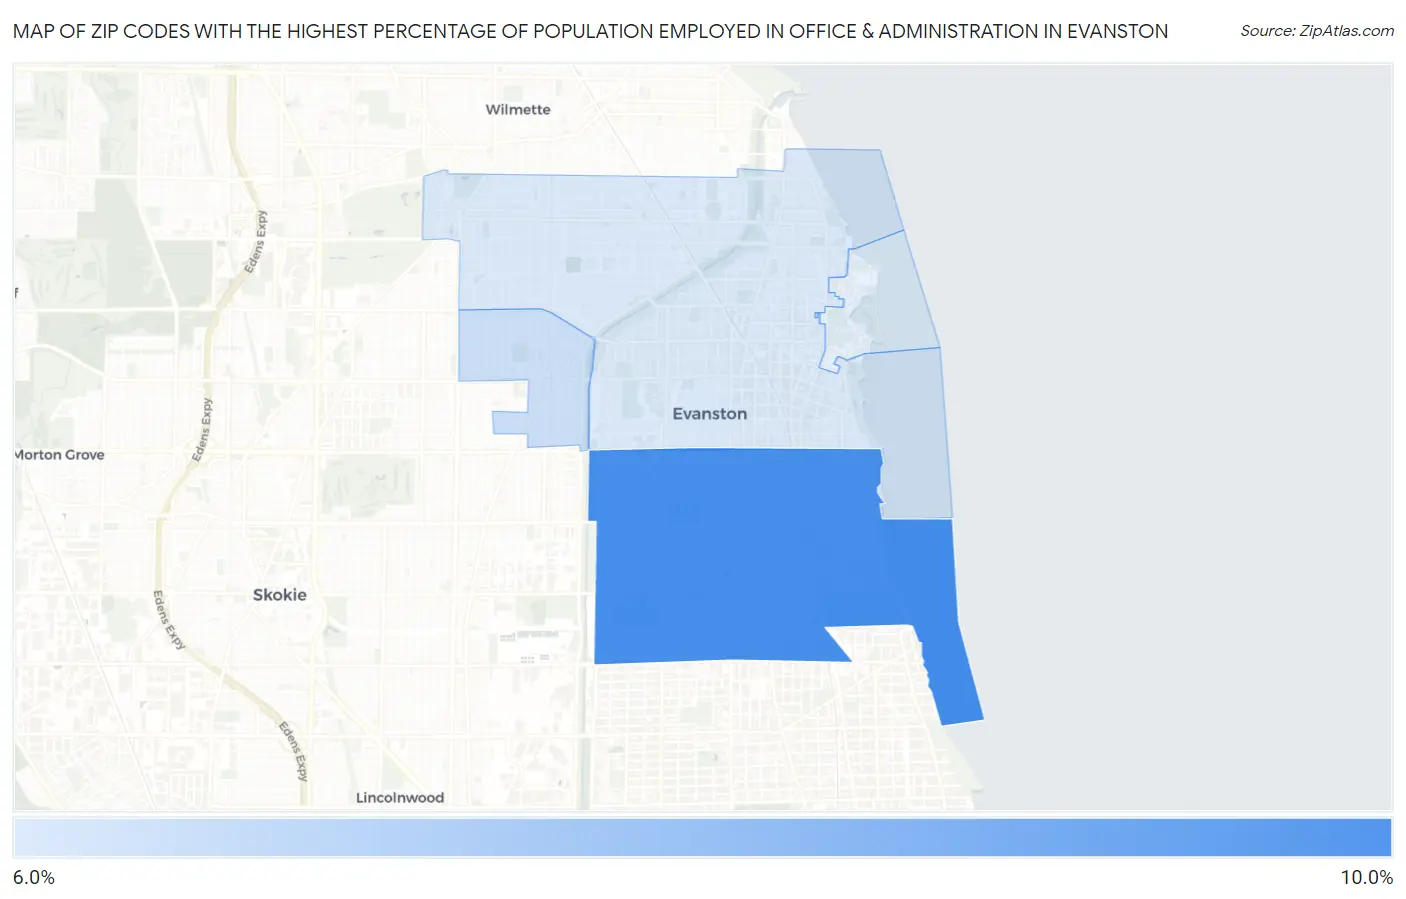
Map of Zip Codes with the Highest Percentage of Population Employed in Office & Administration in Evanston
6.1%
8.2%
Zip Codes with the Highest Percentage of Population Employed in Office & Administration in Evanston, IL
| Zip Code | % Employed | vs State | vs National | |
| 1. | 60202 | 8.2% | 10.8%(-2.53)#1,002 | 10.9%(-2.62)#22,418 |
| 2. | 60203 | 6.3% | 10.8%(-4.47)#1,185 | 10.9%(-4.56)#26,420 |
| 3. | 60201 | 6.1% | 10.8%(-4.71)#1,196 | 10.9%(-4.80)#26,776 |
1
Common Questions
What are the Top 3 Zip Codes with the Highest Percentage of Population Employed in Office & Administration in Evanston, IL?
Top 3 Zip Codes with the Highest Percentage of Population Employed in Office & Administration in Evanston, IL are:
What zip code has the Highest Percentage of Population Employed in Office & Administration in Evanston, IL?
60202 has the Highest Percentage of Population Employed in Office & Administration in Evanston, IL with 8.2%.
What is the Percentage of Population Employed in Office & Administration in Evanston, IL?
Percentage of Population Employed in Office & Administration in Evanston is 7.1%.
What is the Percentage of Population Employed in Office & Administration in Illinois?
Percentage of Population Employed in Office & Administration in Illinois is 10.8%.
What is the Percentage of Population Employed in Office & Administration in the United States?
Percentage of Population Employed in Office & Administration in the United States is 10.9%.