Zip Codes with the Highest Percentage of Population Employed in Office & Administration in Orland Park, IL
RELATED REPORTS & OPTIONS
Office & Administration
Orland Park
Compare Zip Codes
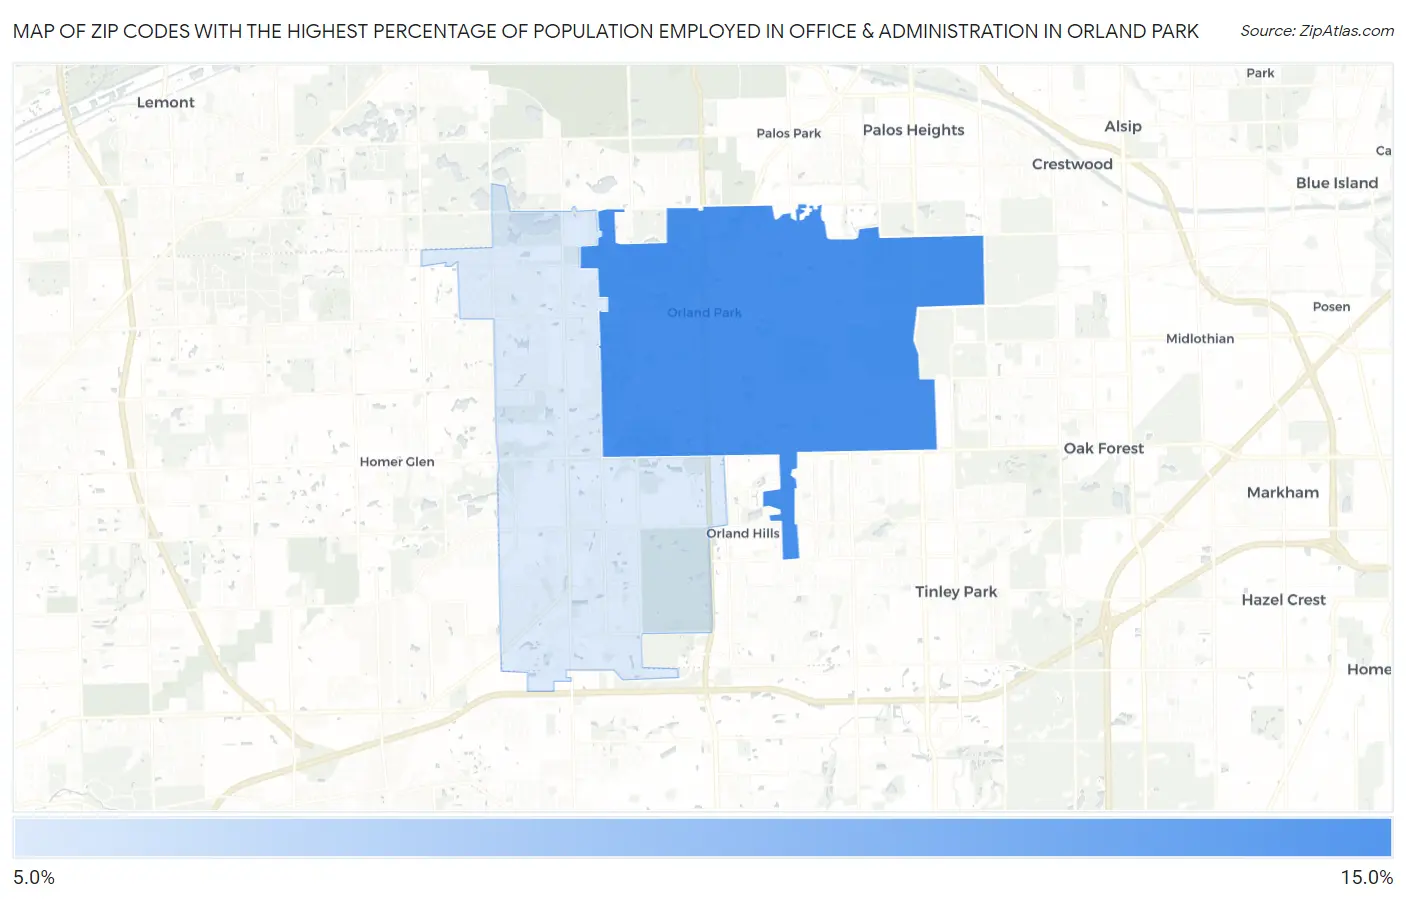
Map of Zip Codes with the Highest Percentage of Population Employed in Office & Administration in Orland Park
7.5%
10.3%
Zip Codes with the Highest Percentage of Population Employed in Office & Administration in Orland Park, IL
| Zip Code | % Employed | vs State | vs National | |
| 1. | 60462 | 10.3% | 10.8%(-0.508)#738 | 10.9%(-0.600)#16,310 |
| 2. | 60467 | 7.5% | 10.8%(-3.27)#1,078 | 10.9%(-3.36)#24,159 |
1
Common Questions
What are the Top Zip Codes with the Highest Percentage of Population Employed in Office & Administration in Orland Park, IL?
Top Zip Codes with the Highest Percentage of Population Employed in Office & Administration in Orland Park, IL are:
What zip code has the Highest Percentage of Population Employed in Office & Administration in Orland Park, IL?
60462 has the Highest Percentage of Population Employed in Office & Administration in Orland Park, IL with 10.3%.
What is the Percentage of Population Employed in Office & Administration in Orland Park, IL?
Percentage of Population Employed in Office & Administration in Orland Park is 9.0%.
What is the Percentage of Population Employed in Office & Administration in Illinois?
Percentage of Population Employed in Office & Administration in Illinois is 10.8%.
What is the Percentage of Population Employed in Office & Administration in the United States?
Percentage of Population Employed in Office & Administration in the United States is 10.9%.