Zip Codes with the Highest Percentage of Population Employed in Office & Administration in Des Plaines, IL
RELATED REPORTS & OPTIONS
Office & Administration
Des Plaines
Compare Zip Codes
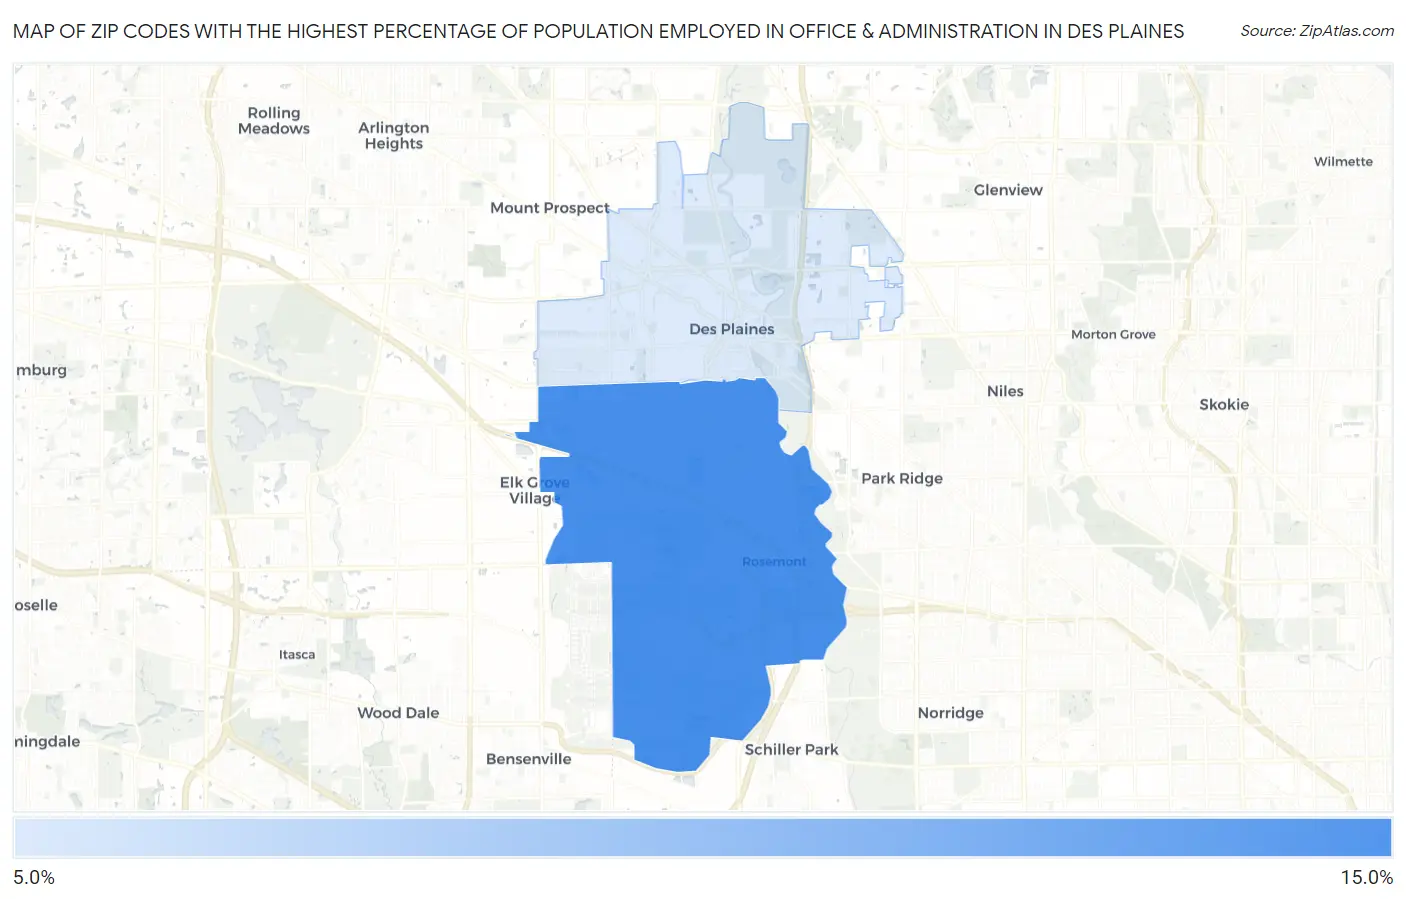
Map of Zip Codes with the Highest Percentage of Population Employed in Office & Administration in Des Plaines
9.9%
12.0%
Zip Codes with the Highest Percentage of Population Employed in Office & Administration in Des Plaines, IL
| Zip Code | % Employed | vs State | vs National | |
| 1. | 60018 | 12.0% | 10.8%(+1.28)#508 | 10.9%(+1.19)#10,576 |
| 2. | 60016 | 9.9% | 10.8%(-0.831)#789 | 10.9%(-0.923)#17,337 |
1
Common Questions
What are the Top Zip Codes with the Highest Percentage of Population Employed in Office & Administration in Des Plaines, IL?
Top Zip Codes with the Highest Percentage of Population Employed in Office & Administration in Des Plaines, IL are:
What zip code has the Highest Percentage of Population Employed in Office & Administration in Des Plaines, IL?
60018 has the Highest Percentage of Population Employed in Office & Administration in Des Plaines, IL with 12.0%.
What is the Percentage of Population Employed in Office & Administration in Des Plaines, IL?
Percentage of Population Employed in Office & Administration in Des Plaines is 11.0%.
What is the Percentage of Population Employed in Office & Administration in Illinois?
Percentage of Population Employed in Office & Administration in Illinois is 10.8%.
What is the Percentage of Population Employed in Office & Administration in the United States?
Percentage of Population Employed in Office & Administration in the United States is 10.9%.