Zip Codes with the Highest Percentage of Population Employed in Office & Administration in Belleville, IL
RELATED REPORTS & OPTIONS
Office & Administration
Belleville
Compare Zip Codes
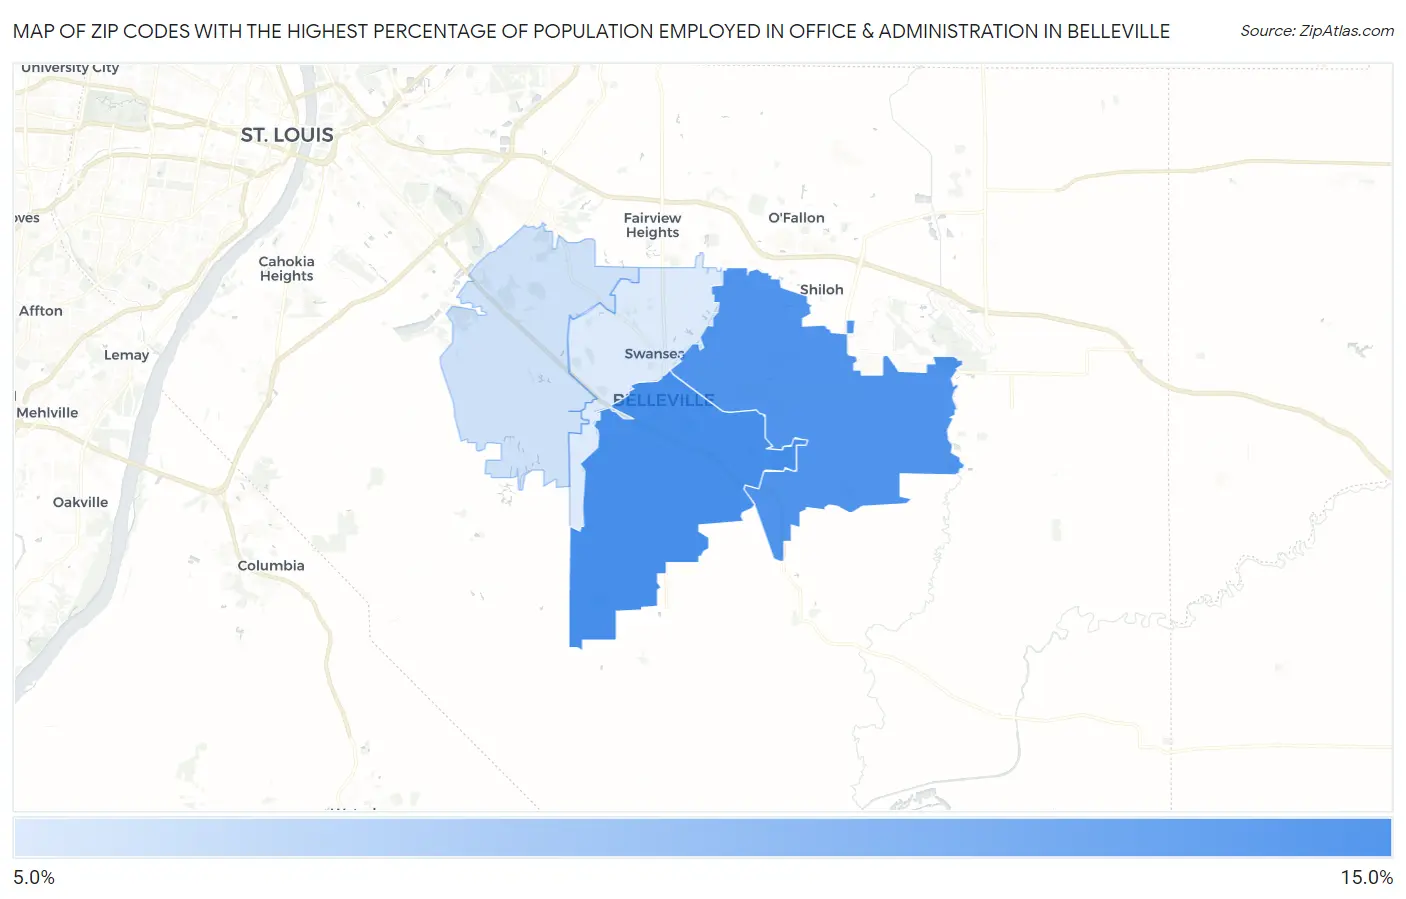
Map of Zip Codes with the Highest Percentage of Population Employed in Office & Administration in Belleville
8.7%
13.5%
Zip Codes with the Highest Percentage of Population Employed in Office & Administration in Belleville, IL
| Zip Code | % Employed | vs State | vs National | |
| 1. | 62220 | 13.5% | 10.8%(+2.75)#328 | 10.9%(+2.66)#6,888 |
| 2. | 62221 | 13.2% | 10.8%(+2.48)#355 | 10.9%(+2.39)#7,489 |
| 3. | 62223 | 9.2% | 10.8%(-1.58)#889 | 10.9%(-1.67)#19,715 |
| 4. | 62226 | 8.7% | 10.8%(-2.03)#948 | 10.9%(-2.12)#21,047 |
1
Common Questions
What are the Top 3 Zip Codes with the Highest Percentage of Population Employed in Office & Administration in Belleville, IL?
Top 3 Zip Codes with the Highest Percentage of Population Employed in Office & Administration in Belleville, IL are:
What zip code has the Highest Percentage of Population Employed in Office & Administration in Belleville, IL?
62220 has the Highest Percentage of Population Employed in Office & Administration in Belleville, IL with 13.5%.
What is the Percentage of Population Employed in Office & Administration in Belleville, IL?
Percentage of Population Employed in Office & Administration in Belleville is 12.2%.
What is the Percentage of Population Employed in Office & Administration in Illinois?
Percentage of Population Employed in Office & Administration in Illinois is 10.8%.
What is the Percentage of Population Employed in Office & Administration in the United States?
Percentage of Population Employed in Office & Administration in the United States is 10.9%.