Zip Codes with the Highest Percentage of Population Employed in Office & Administration in Waukegan, IL
RELATED REPORTS & OPTIONS
Office & Administration
Waukegan
Compare Zip Codes
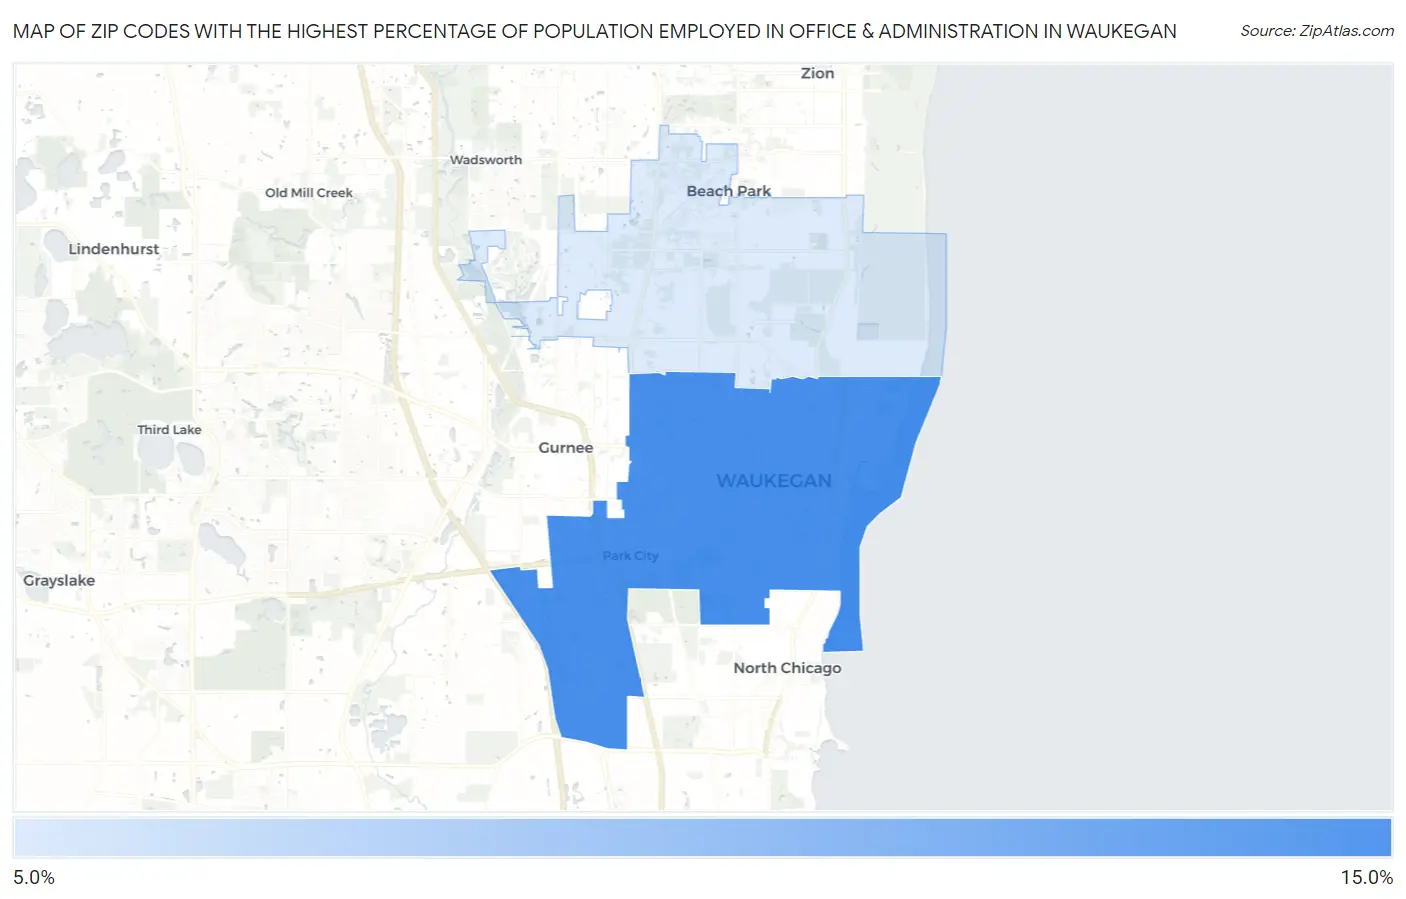
Map of Zip Codes with the Highest Percentage of Population Employed in Office & Administration in Waukegan
10.6%
12.5%
Zip Codes with the Highest Percentage of Population Employed in Office & Administration in Waukegan, IL
| Zip Code | % Employed | vs State | vs National | |
| 1. | 60085 | 12.5% | 10.8%(+1.72)#457 | 10.9%(+1.63)#9,341 |
| 2. | 60087 | 10.6% | 10.8%(-0.214)#703 | 10.9%(-0.306)#15,297 |
1
Common Questions
What are the Top Zip Codes with the Highest Percentage of Population Employed in Office & Administration in Waukegan, IL?
Top Zip Codes with the Highest Percentage of Population Employed in Office & Administration in Waukegan, IL are:
What zip code has the Highest Percentage of Population Employed in Office & Administration in Waukegan, IL?
60085 has the Highest Percentage of Population Employed in Office & Administration in Waukegan, IL with 12.5%.
What is the Percentage of Population Employed in Office & Administration in Waukegan, IL?
Percentage of Population Employed in Office & Administration in Waukegan is 11.9%.
What is the Percentage of Population Employed in Office & Administration in Illinois?
Percentage of Population Employed in Office & Administration in Illinois is 10.8%.
What is the Percentage of Population Employed in Office & Administration in the United States?
Percentage of Population Employed in Office & Administration in the United States is 10.9%.