Zip Codes with the Highest Percentage of Population Employed in Health Diagnosing & Treating in Belleville, IL
RELATED REPORTS & OPTIONS
Health Diagnosing & Treating
Belleville
Compare Zip Codes
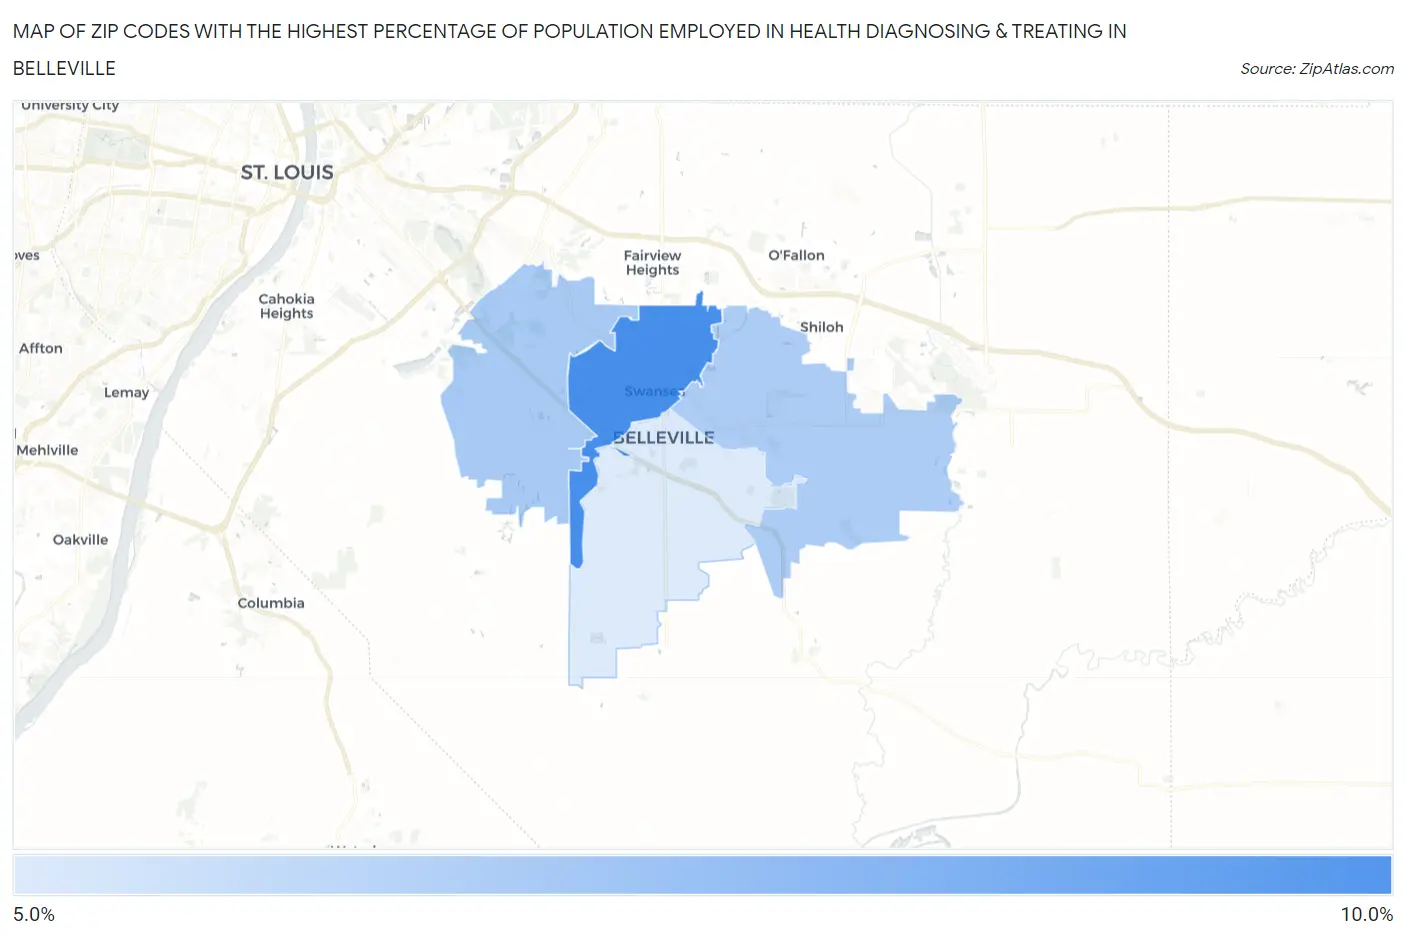
Map of Zip Codes with the Highest Percentage of Population Employed in Health Diagnosing & Treating in Belleville
5.1%
8.5%
Zip Codes with the Highest Percentage of Population Employed in Health Diagnosing & Treating in Belleville, IL
| Zip Code | % Employed | vs State | vs National | |
| 1. | 62226 | 8.5% | 6.2%(+2.23)#320 | 6.2%(+2.22)#6,404 |
| 2. | 62223 | 6.3% | 6.2%(+0.043)#596 | 6.2%(+0.035)#12,843 |
| 3. | 62221 | 6.2% | 6.2%(-0.049)#613 | 6.2%(-0.057)#13,200 |
| 4. | 62220 | 5.1% | 6.2%(-1.15)#825 | 6.2%(-1.16)#17,387 |
1
Common Questions
What are the Top 3 Zip Codes with the Highest Percentage of Population Employed in Health Diagnosing & Treating in Belleville, IL?
Top 3 Zip Codes with the Highest Percentage of Population Employed in Health Diagnosing & Treating in Belleville, IL are:
What zip code has the Highest Percentage of Population Employed in Health Diagnosing & Treating in Belleville, IL?
62226 has the Highest Percentage of Population Employed in Health Diagnosing & Treating in Belleville, IL with 8.5%.
What is the Percentage of Population Employed in Health Diagnosing & Treating in Belleville, IL?
Percentage of Population Employed in Health Diagnosing & Treating in Belleville is 5.4%.
What is the Percentage of Population Employed in Health Diagnosing & Treating in Illinois?
Percentage of Population Employed in Health Diagnosing & Treating in Illinois is 6.2%.
What is the Percentage of Population Employed in Health Diagnosing & Treating in the United States?
Percentage of Population Employed in Health Diagnosing & Treating in the United States is 6.2%.