Zip Codes with the Highest Percentage of Population Employed in Health Diagnosing & Treating in Palatine, IL
RELATED REPORTS & OPTIONS
Health Diagnosing & Treating
Palatine
Compare Zip Codes
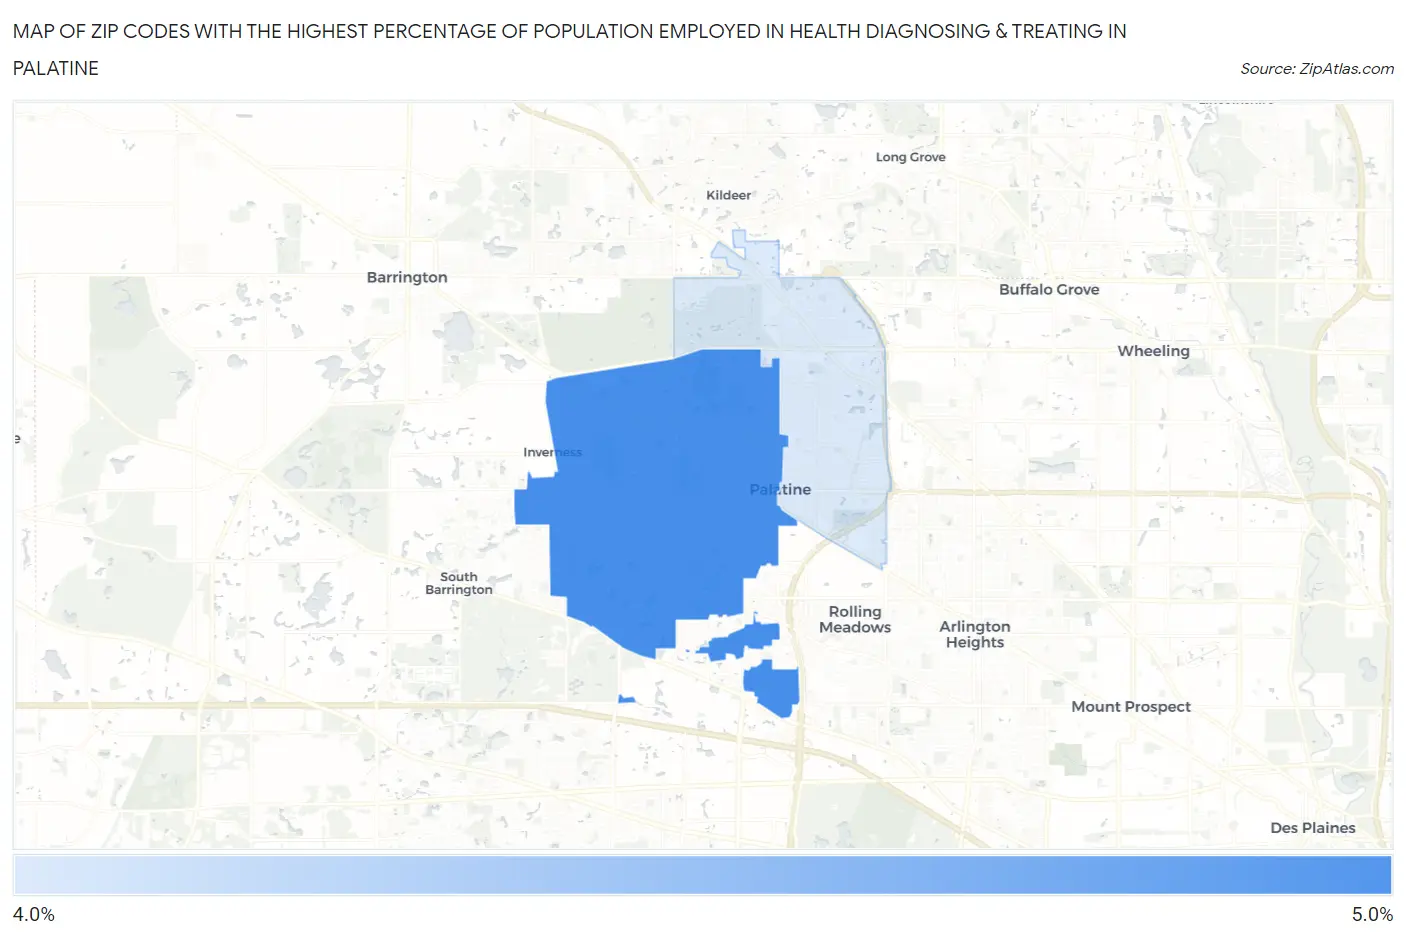
Map of Zip Codes with the Highest Percentage of Population Employed in Health Diagnosing & Treating in Palatine
4.6%
4.9%
Zip Codes with the Highest Percentage of Population Employed in Health Diagnosing & Treating in Palatine, IL
| Zip Code | % Employed | vs State | vs National | |
| 1. | 60067 | 4.9% | 6.2%(-1.30)#854 | 6.2%(-1.31)#17,954 |
| 2. | 60074 | 4.6% | 6.2%(-1.59)#916 | 6.2%(-1.60)#19,071 |
1
Common Questions
What are the Top Zip Codes with the Highest Percentage of Population Employed in Health Diagnosing & Treating in Palatine, IL?
Top Zip Codes with the Highest Percentage of Population Employed in Health Diagnosing & Treating in Palatine, IL are:
What zip code has the Highest Percentage of Population Employed in Health Diagnosing & Treating in Palatine, IL?
60067 has the Highest Percentage of Population Employed in Health Diagnosing & Treating in Palatine, IL with 4.9%.
What is the Percentage of Population Employed in Health Diagnosing & Treating in Palatine, IL?
Percentage of Population Employed in Health Diagnosing & Treating in Palatine is 4.5%.
What is the Percentage of Population Employed in Health Diagnosing & Treating in Illinois?
Percentage of Population Employed in Health Diagnosing & Treating in Illinois is 6.2%.
What is the Percentage of Population Employed in Health Diagnosing & Treating in the United States?
Percentage of Population Employed in Health Diagnosing & Treating in the United States is 6.2%.