Zip Codes with the Highest Percentage of Population Employed in Health Diagnosing & Treating in Rockford, IL
RELATED REPORTS & OPTIONS
Health Diagnosing & Treating
Rockford
Compare Zip Codes
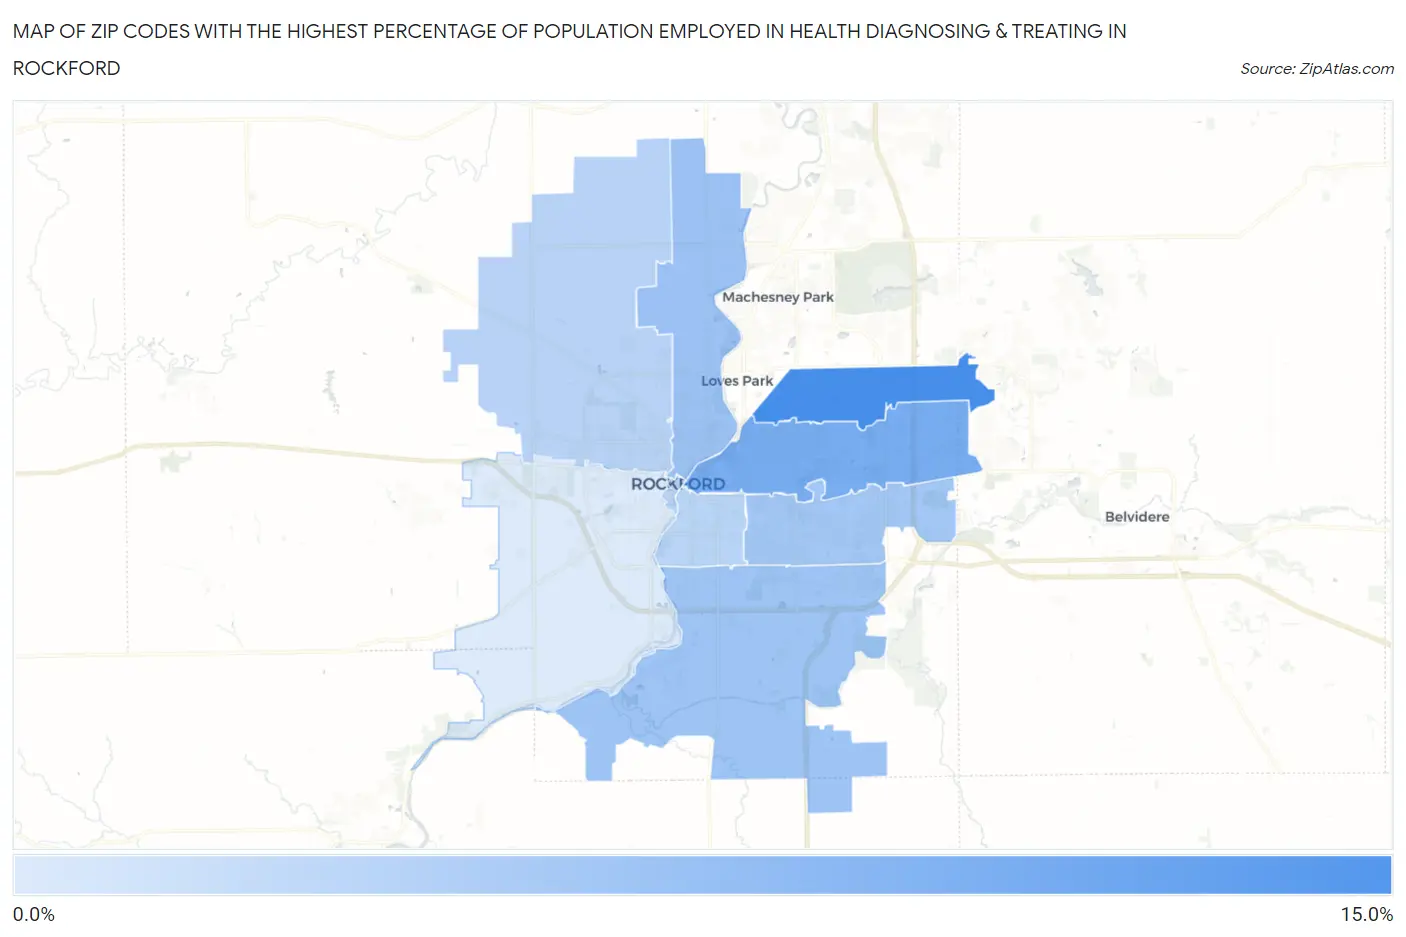
Map of Zip Codes with the Highest Percentage of Population Employed in Health Diagnosing & Treating in Rockford
0.68%
12.6%
Zip Codes with the Highest Percentage of Population Employed in Health Diagnosing & Treating in Rockford, IL
| Zip Code | % Employed | vs State | vs National | |
| 1. | 61114 | 12.6% | 6.2%(+6.35)#100 | 6.2%(+6.34)#1,914 |
| 2. | 61107 | 8.7% | 6.2%(+2.42)#300 | 6.2%(+2.41)#6,027 |
| 3. | 61103 | 5.9% | 6.2%(-0.332)#663 | 6.2%(-0.341)#14,206 |
| 4. | 61109 | 5.4% | 6.2%(-0.852)#764 | 6.2%(-0.860)#16,228 |
| 5. | 61108 | 5.1% | 6.2%(-1.11)#815 | 6.2%(-1.12)#17,231 |
| 6. | 61101 | 3.5% | 6.2%(-2.77)#1,070 | 6.2%(-2.78)#23,010 |
| 7. | 61104 | 3.3% | 6.2%(-2.95)#1,102 | 6.2%(-2.96)#23,518 |
| 8. | 61102 | 0.68% | 6.2%(-5.55)#1,283 | 6.2%(-5.56)#28,165 |
1
Common Questions
What are the Top 5 Zip Codes with the Highest Percentage of Population Employed in Health Diagnosing & Treating in Rockford, IL?
Top 5 Zip Codes with the Highest Percentage of Population Employed in Health Diagnosing & Treating in Rockford, IL are:
What zip code has the Highest Percentage of Population Employed in Health Diagnosing & Treating in Rockford, IL?
61114 has the Highest Percentage of Population Employed in Health Diagnosing & Treating in Rockford, IL with 12.6%.
What is the Percentage of Population Employed in Health Diagnosing & Treating in Rockford, IL?
Percentage of Population Employed in Health Diagnosing & Treating in Rockford is 6.1%.
What is the Percentage of Population Employed in Health Diagnosing & Treating in Illinois?
Percentage of Population Employed in Health Diagnosing & Treating in Illinois is 6.2%.
What is the Percentage of Population Employed in Health Diagnosing & Treating in the United States?
Percentage of Population Employed in Health Diagnosing & Treating in the United States is 6.2%.