Zip Codes with the Highest Percentage of Population Employed in Health Diagnosing & Treating in Urbandale, IA
RELATED REPORTS & OPTIONS
Health Diagnosing & Treating
Urbandale
Compare Zip Codes
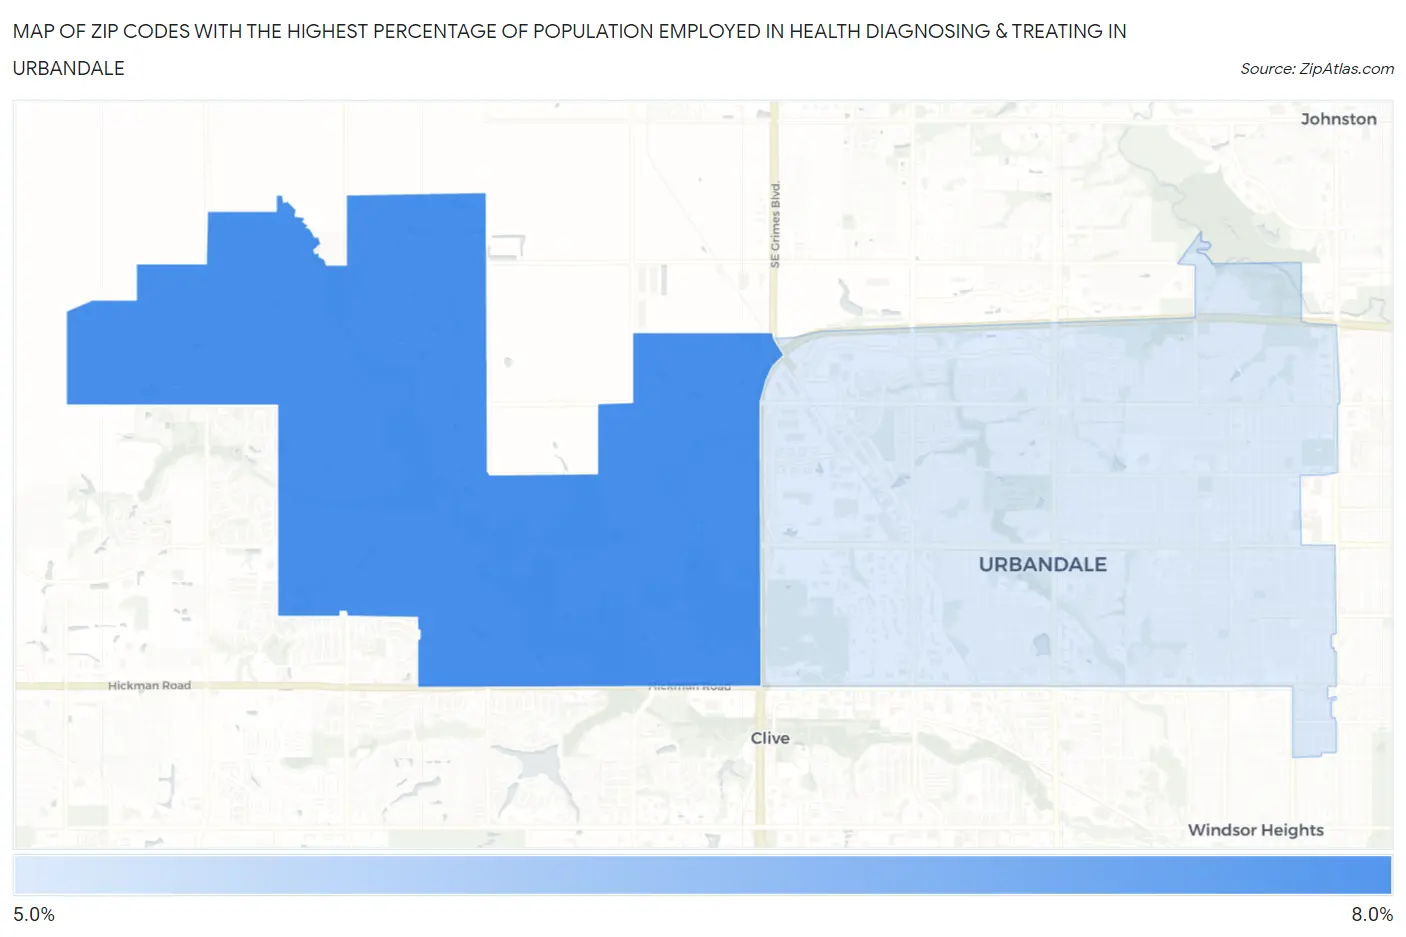
Map of Zip Codes with the Highest Percentage of Population Employed in Health Diagnosing & Treating in Urbandale
5.2%
7.4%
Zip Codes with the Highest Percentage of Population Employed in Health Diagnosing & Treating in Urbandale, IA
| Zip Code | % Employed | vs State | vs National | |
| 1. | 50323 | 7.4% | 6.2%(+1.22)#258 | 6.2%(+1.14)#9,166 |
| 2. | 50322 | 5.2% | 6.2%(-0.970)#461 | 6.2%(-1.05)#16,957 |
1
Common Questions
What are the Top Zip Codes with the Highest Percentage of Population Employed in Health Diagnosing & Treating in Urbandale, IA?
Top Zip Codes with the Highest Percentage of Population Employed in Health Diagnosing & Treating in Urbandale, IA are:
What zip code has the Highest Percentage of Population Employed in Health Diagnosing & Treating in Urbandale, IA?
50323 has the Highest Percentage of Population Employed in Health Diagnosing & Treating in Urbandale, IA with 7.4%.
What is the Percentage of Population Employed in Health Diagnosing & Treating in Urbandale, IA?
Percentage of Population Employed in Health Diagnosing & Treating in Urbandale is 6.0%.
What is the Percentage of Population Employed in Health Diagnosing & Treating in Iowa?
Percentage of Population Employed in Health Diagnosing & Treating in Iowa is 6.2%.
What is the Percentage of Population Employed in Health Diagnosing & Treating in the United States?
Percentage of Population Employed in Health Diagnosing & Treating in the United States is 6.2%.