Zip Codes with the Highest Percentage of Population Employed in Accommodation & Food Services in Urbandale, IA
RELATED REPORTS & OPTIONS
Accommodation & Food Services
Urbandale
Compare Zip Codes
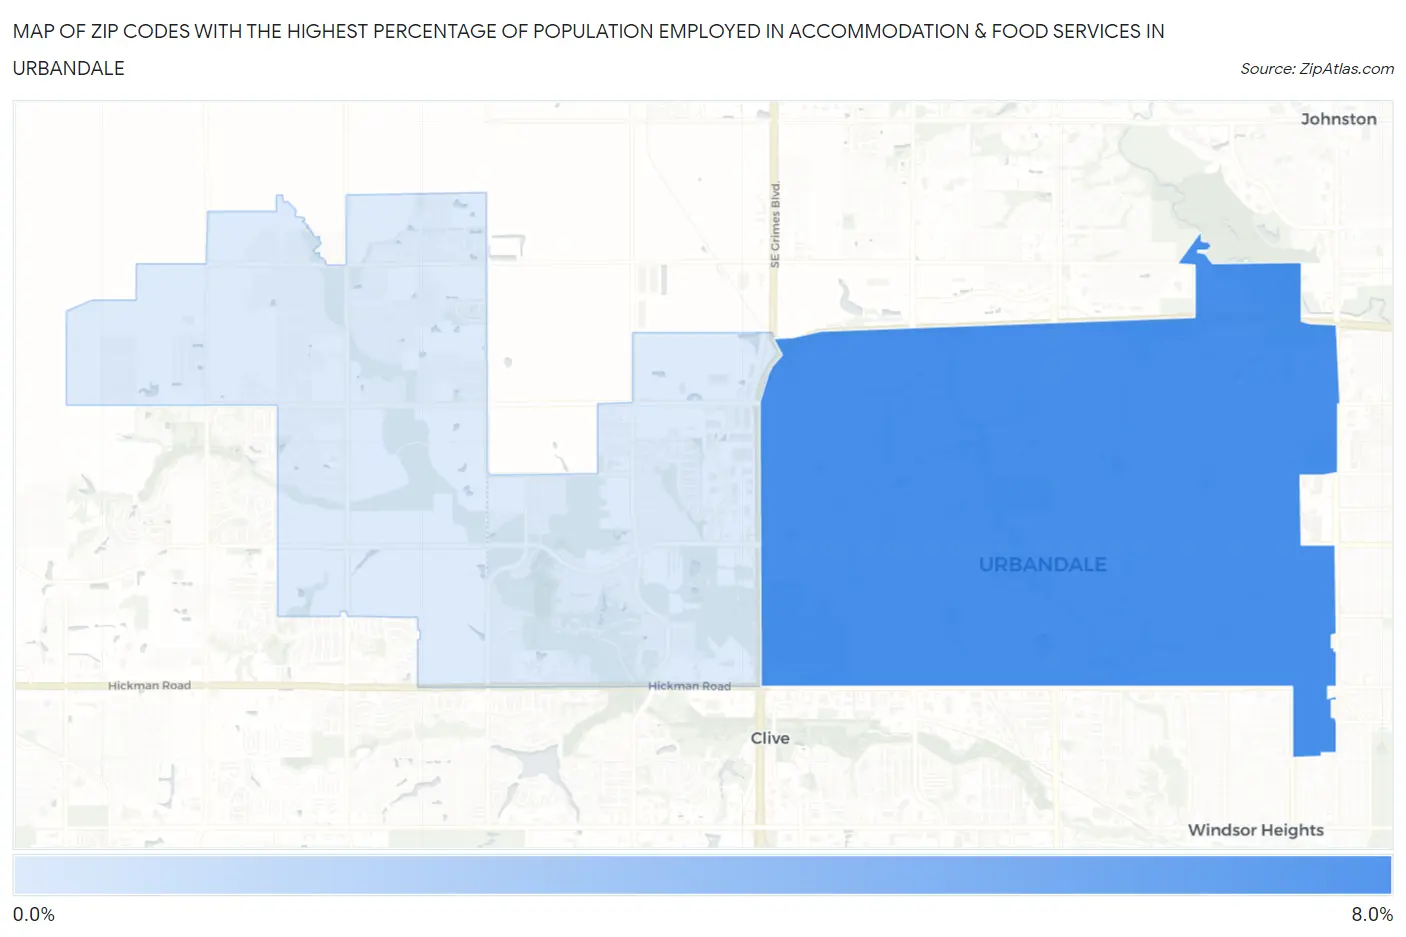
Map of Zip Codes with the Highest Percentage of Population Employed in Accommodation & Food Services in Urbandale
1.3%
6.7%
Zip Codes with the Highest Percentage of Population Employed in Accommodation & Food Services in Urbandale, IA
| Zip Code | % Employed | vs State | vs National | |
| 1. | 50322 | 6.7% | 5.5%(+1.21)#139 | 6.9%(-0.179)#11,202 |
| 2. | 50323 | 1.3% | 5.5%(-4.24)#708 | 6.9%(-5.63)#26,896 |
1
Common Questions
What are the Top Zip Codes with the Highest Percentage of Population Employed in Accommodation & Food Services in Urbandale, IA?
Top Zip Codes with the Highest Percentage of Population Employed in Accommodation & Food Services in Urbandale, IA are:
What zip code has the Highest Percentage of Population Employed in Accommodation & Food Services in Urbandale, IA?
50322 has the Highest Percentage of Population Employed in Accommodation & Food Services in Urbandale, IA with 6.7%.
What is the Percentage of Population Employed in Accommodation & Food Services in Urbandale, IA?
Percentage of Population Employed in Accommodation & Food Services in Urbandale is 4.8%.
What is the Percentage of Population Employed in Accommodation & Food Services in Iowa?
Percentage of Population Employed in Accommodation & Food Services in Iowa is 5.5%.
What is the Percentage of Population Employed in Accommodation & Food Services in the United States?
Percentage of Population Employed in Accommodation & Food Services in the United States is 6.9%.