Zip Codes with the Highest Percentage of Population Employed in Food Preparation & Serving in Urbandale, IA
RELATED REPORTS & OPTIONS
Food Preparation & Serving
Urbandale
Compare Zip Codes
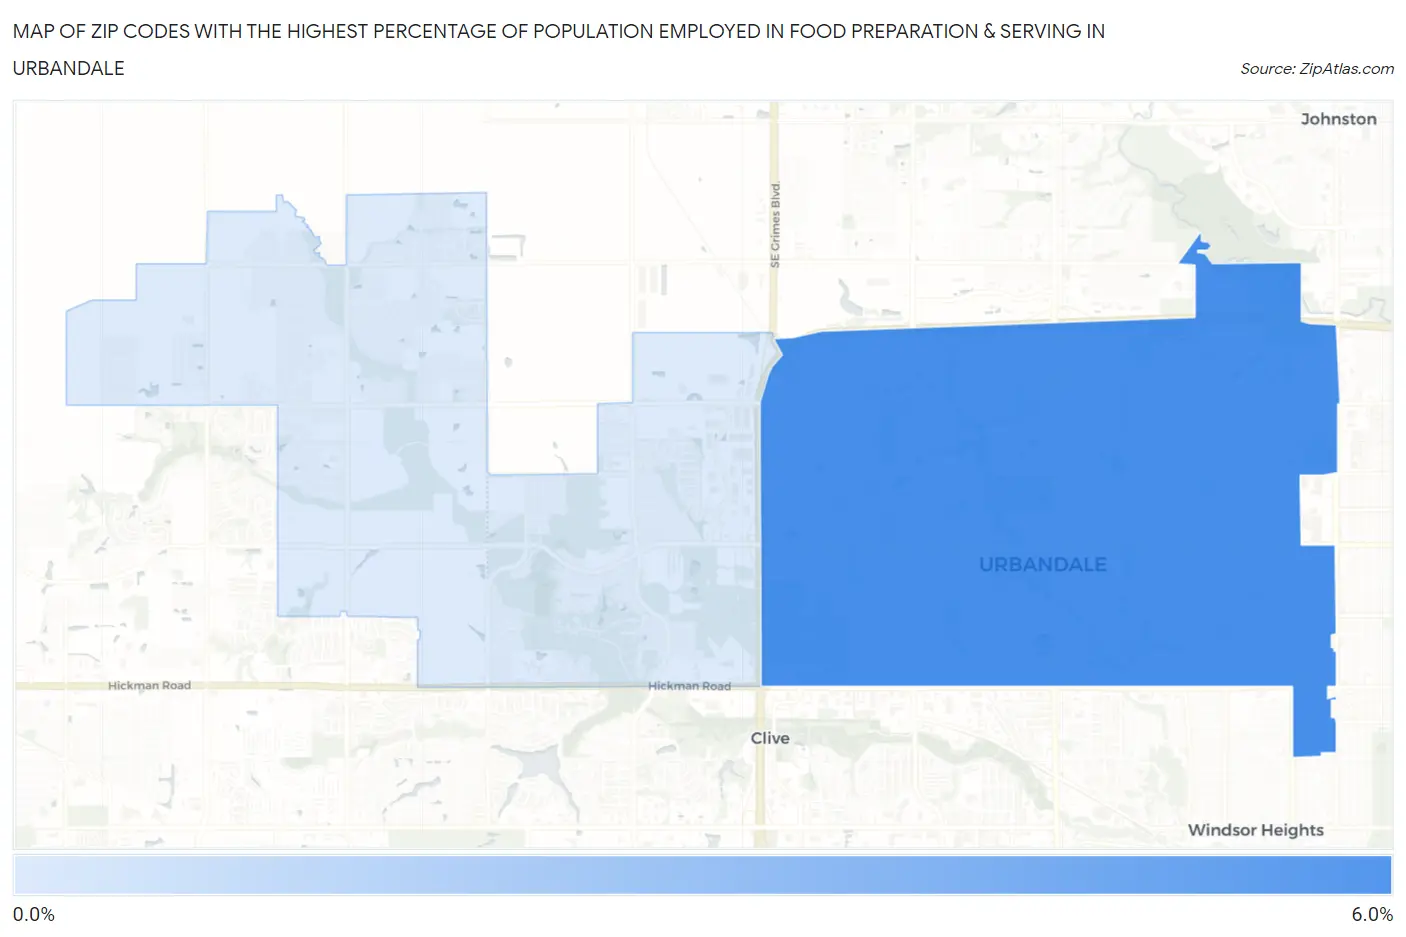
Map of Zip Codes with the Highest Percentage of Population Employed in Food Preparation & Serving in Urbandale
0.94%
5.5%
Zip Codes with the Highest Percentage of Population Employed in Food Preparation & Serving in Urbandale, IA
| Zip Code | % Employed | vs State | vs National | |
| 1. | 50322 | 5.5% | 5.1%(+0.340)#249 | 5.3%(+0.168)#11,206 |
| 2. | 50323 | 0.94% | 5.1%(-4.17)#816 | 5.3%(-4.35)#27,073 |
1
Common Questions
What are the Top Zip Codes with the Highest Percentage of Population Employed in Food Preparation & Serving in Urbandale, IA?
Top Zip Codes with the Highest Percentage of Population Employed in Food Preparation & Serving in Urbandale, IA are:
What zip code has the Highest Percentage of Population Employed in Food Preparation & Serving in Urbandale, IA?
50322 has the Highest Percentage of Population Employed in Food Preparation & Serving in Urbandale, IA with 5.5%.
What is the Percentage of Population Employed in Food Preparation & Serving in Urbandale, IA?
Percentage of Population Employed in Food Preparation & Serving in Urbandale is 3.8%.
What is the Percentage of Population Employed in Food Preparation & Serving in Iowa?
Percentage of Population Employed in Food Preparation & Serving in Iowa is 5.1%.
What is the Percentage of Population Employed in Food Preparation & Serving in the United States?
Percentage of Population Employed in Food Preparation & Serving in the United States is 5.3%.