Zip Codes with the Highest Percentage of Population Employed in Legal Services & Support in Urbandale, IA
RELATED REPORTS & OPTIONS
Legal Services & Support
Urbandale
Compare Zip Codes
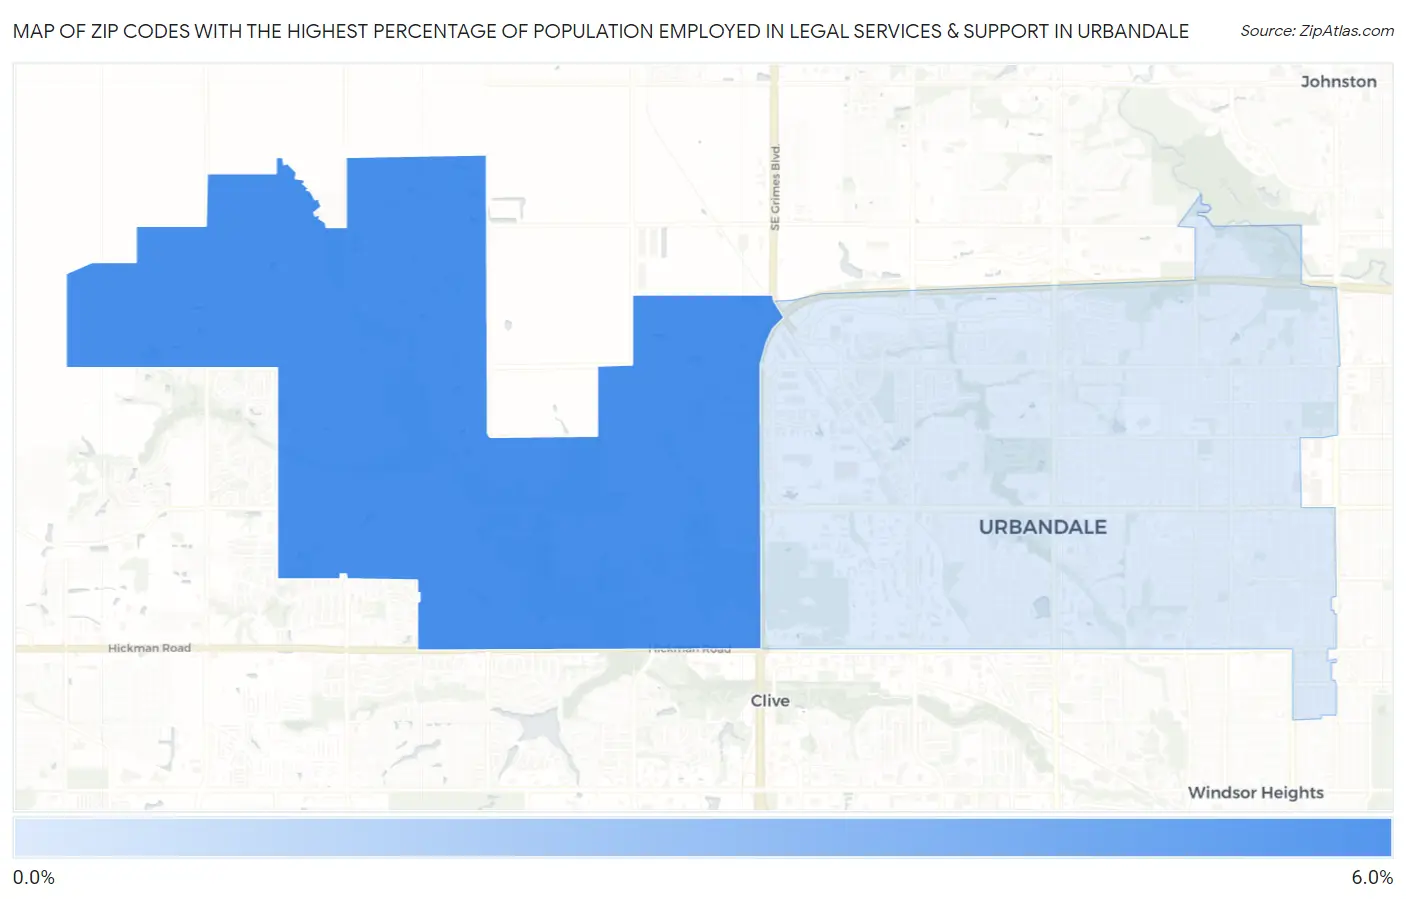
Map of Zip Codes with the Highest Percentage of Population Employed in Legal Services & Support in Urbandale
1.1%
5.3%
Zip Codes with the Highest Percentage of Population Employed in Legal Services & Support in Urbandale, IA
| Zip Code | % Employed | vs State | vs National | |
| 1. | 50323 | 5.3% | 0.75%(+4.59)#4 | 1.2%(+4.15)#631 |
| 2. | 50322 | 1.1% | 0.75%(+0.375)#107 | 1.2%(-0.063)#7,014 |
1
Common Questions
What are the Top Zip Codes with the Highest Percentage of Population Employed in Legal Services & Support in Urbandale, IA?
Top Zip Codes with the Highest Percentage of Population Employed in Legal Services & Support in Urbandale, IA are:
What zip code has the Highest Percentage of Population Employed in Legal Services & Support in Urbandale, IA?
50323 has the Highest Percentage of Population Employed in Legal Services & Support in Urbandale, IA with 5.3%.
What is the Percentage of Population Employed in Legal Services & Support in Urbandale, IA?
Percentage of Population Employed in Legal Services & Support in Urbandale is 2.6%.
What is the Percentage of Population Employed in Legal Services & Support in Iowa?
Percentage of Population Employed in Legal Services & Support in Iowa is 0.75%.
What is the Percentage of Population Employed in Legal Services & Support in the United States?
Percentage of Population Employed in Legal Services & Support in the United States is 1.2%.